South Florida Decadal Rainfall Drops

Weather events from around the world plus Astronomy and Geology and other Natural events.

Moderator: S2k Moderators

Forum rules

The posts in this forum are NOT official forecast and should not be used as such. They are just the opinion of the poster and may or may not be backed by sound meteorological data. They are NOT endorsed by any professional institution or STORM2K.

Help Support Storm2K
Message
Author
User avatar
gigabite
S2K Supporter
S2K Supporter
Posts: 916
Age: 71
Joined: Wed May 05, 2004 4:09 pm
Location: Naples, Florida

South Florida Decadal Rainfall Drops

#1 Postby gigabite » Sun Jan 01, 2012 11:45 am

Image

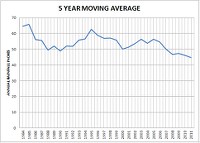
South Florida decadal rainfall drops by 15 percent in 30 years

Using a 5 year moving average to smooth the rain pattern, it becomes evident that there is a decadal pattern with peaks at 1985, 1995, and 2005. The included graph clearly indicates a formation of lower highs and lower lows. At first I suspected that there was an issue with development around the rain gauge or that the site data had been corrupted by movement of the gauge, but I confirmed the trend with another gauge with a data record back to the 1980’s.

After months of tinkering with a spread sheet converting daily rainfall into monthly and yearly, I have developed my latest graph image. This graph goes back 30 years and seems to indicate that annual rainfall is dropping off at the rate of 5 percent per decade. This corresponds with my belief that the earth is entering a phase somewhat like Milankovich would expect, but on a smaller time scale. The earth is closer to the sun in the summer and further from the sun in the winter by small amounts every year. That could account for the migration of the rain pattern moving more into the winter months. It is a matter of the plasma sphere expanding in the summer creating more high pressure systems and less rainfall.

I am working on a Map that to demonstrate the local differences in the pattern. The bothersome thing is this data trend conflicts with the CPC rainfall totals that show only one decadal rainfall shortfall on the leeward side of the Rockies in Oregon. It may be the difference between radar rainfall summaries and ground truth.


Uploaded with ImageShack.us
0 likes   

User avatar
jasons2k
Storm2k Executive
Storm2k Executive
Posts: 8080
Age: 50
Joined: Wed Jul 06, 2005 12:32 pm
Location: The Woodlands, TX

#2 Postby jasons2k » Sat Feb 04, 2012 12:12 am

This is concerning. I wonder if there is any correlation to the increased urban development and decreased water flow into the Everglades. If that's the case, feedback mechanisms could make this a real problem in the future.
0 likes   

User avatar
gigabite
S2K Supporter
S2K Supporter
Posts: 916
Age: 71
Joined: Wed May 05, 2004 4:09 pm
Location: Naples, Florida

Re: South Florida Decadal Rainfall Drops

#3 Postby gigabite » Sat Feb 04, 2012 7:28 am

Image

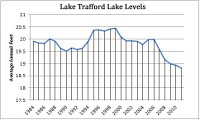
One of the gauges I have been using is at the Corkscrew Swamp Headquarters. This gauge should be out of the range of any “heat island effect” caused by development. This gauge is usually the wettest in the county and is just west of Lake Trafford the largest fresh water body in the county. There is, as you suggest a corollary effect on the lake the base element of the Corkscrew Swamp system.

The Corkscrew Gauge is a good climate metric. It catches rain brought in on the westerlies. The westerlies also bring in the Sahara Dust. There may be some recent local anthropological consequence, but this is more than likely part of a zonal climatologically shift.

Capacity in the region’s municipal water supply has not been reported, and as long as the early spring rains continue the rural drinking water wells will not dry out.

Uploaded with ImageShack.us
0 likes   


Return to “Global Weather”

Who is online

Users browsing this forum: No registered users and 44 guests