

YYYY...NS...MHD.......Ratio*......#TC w/ ≥ 1 MH(C4+) LF...(M)H(C4+) LF...
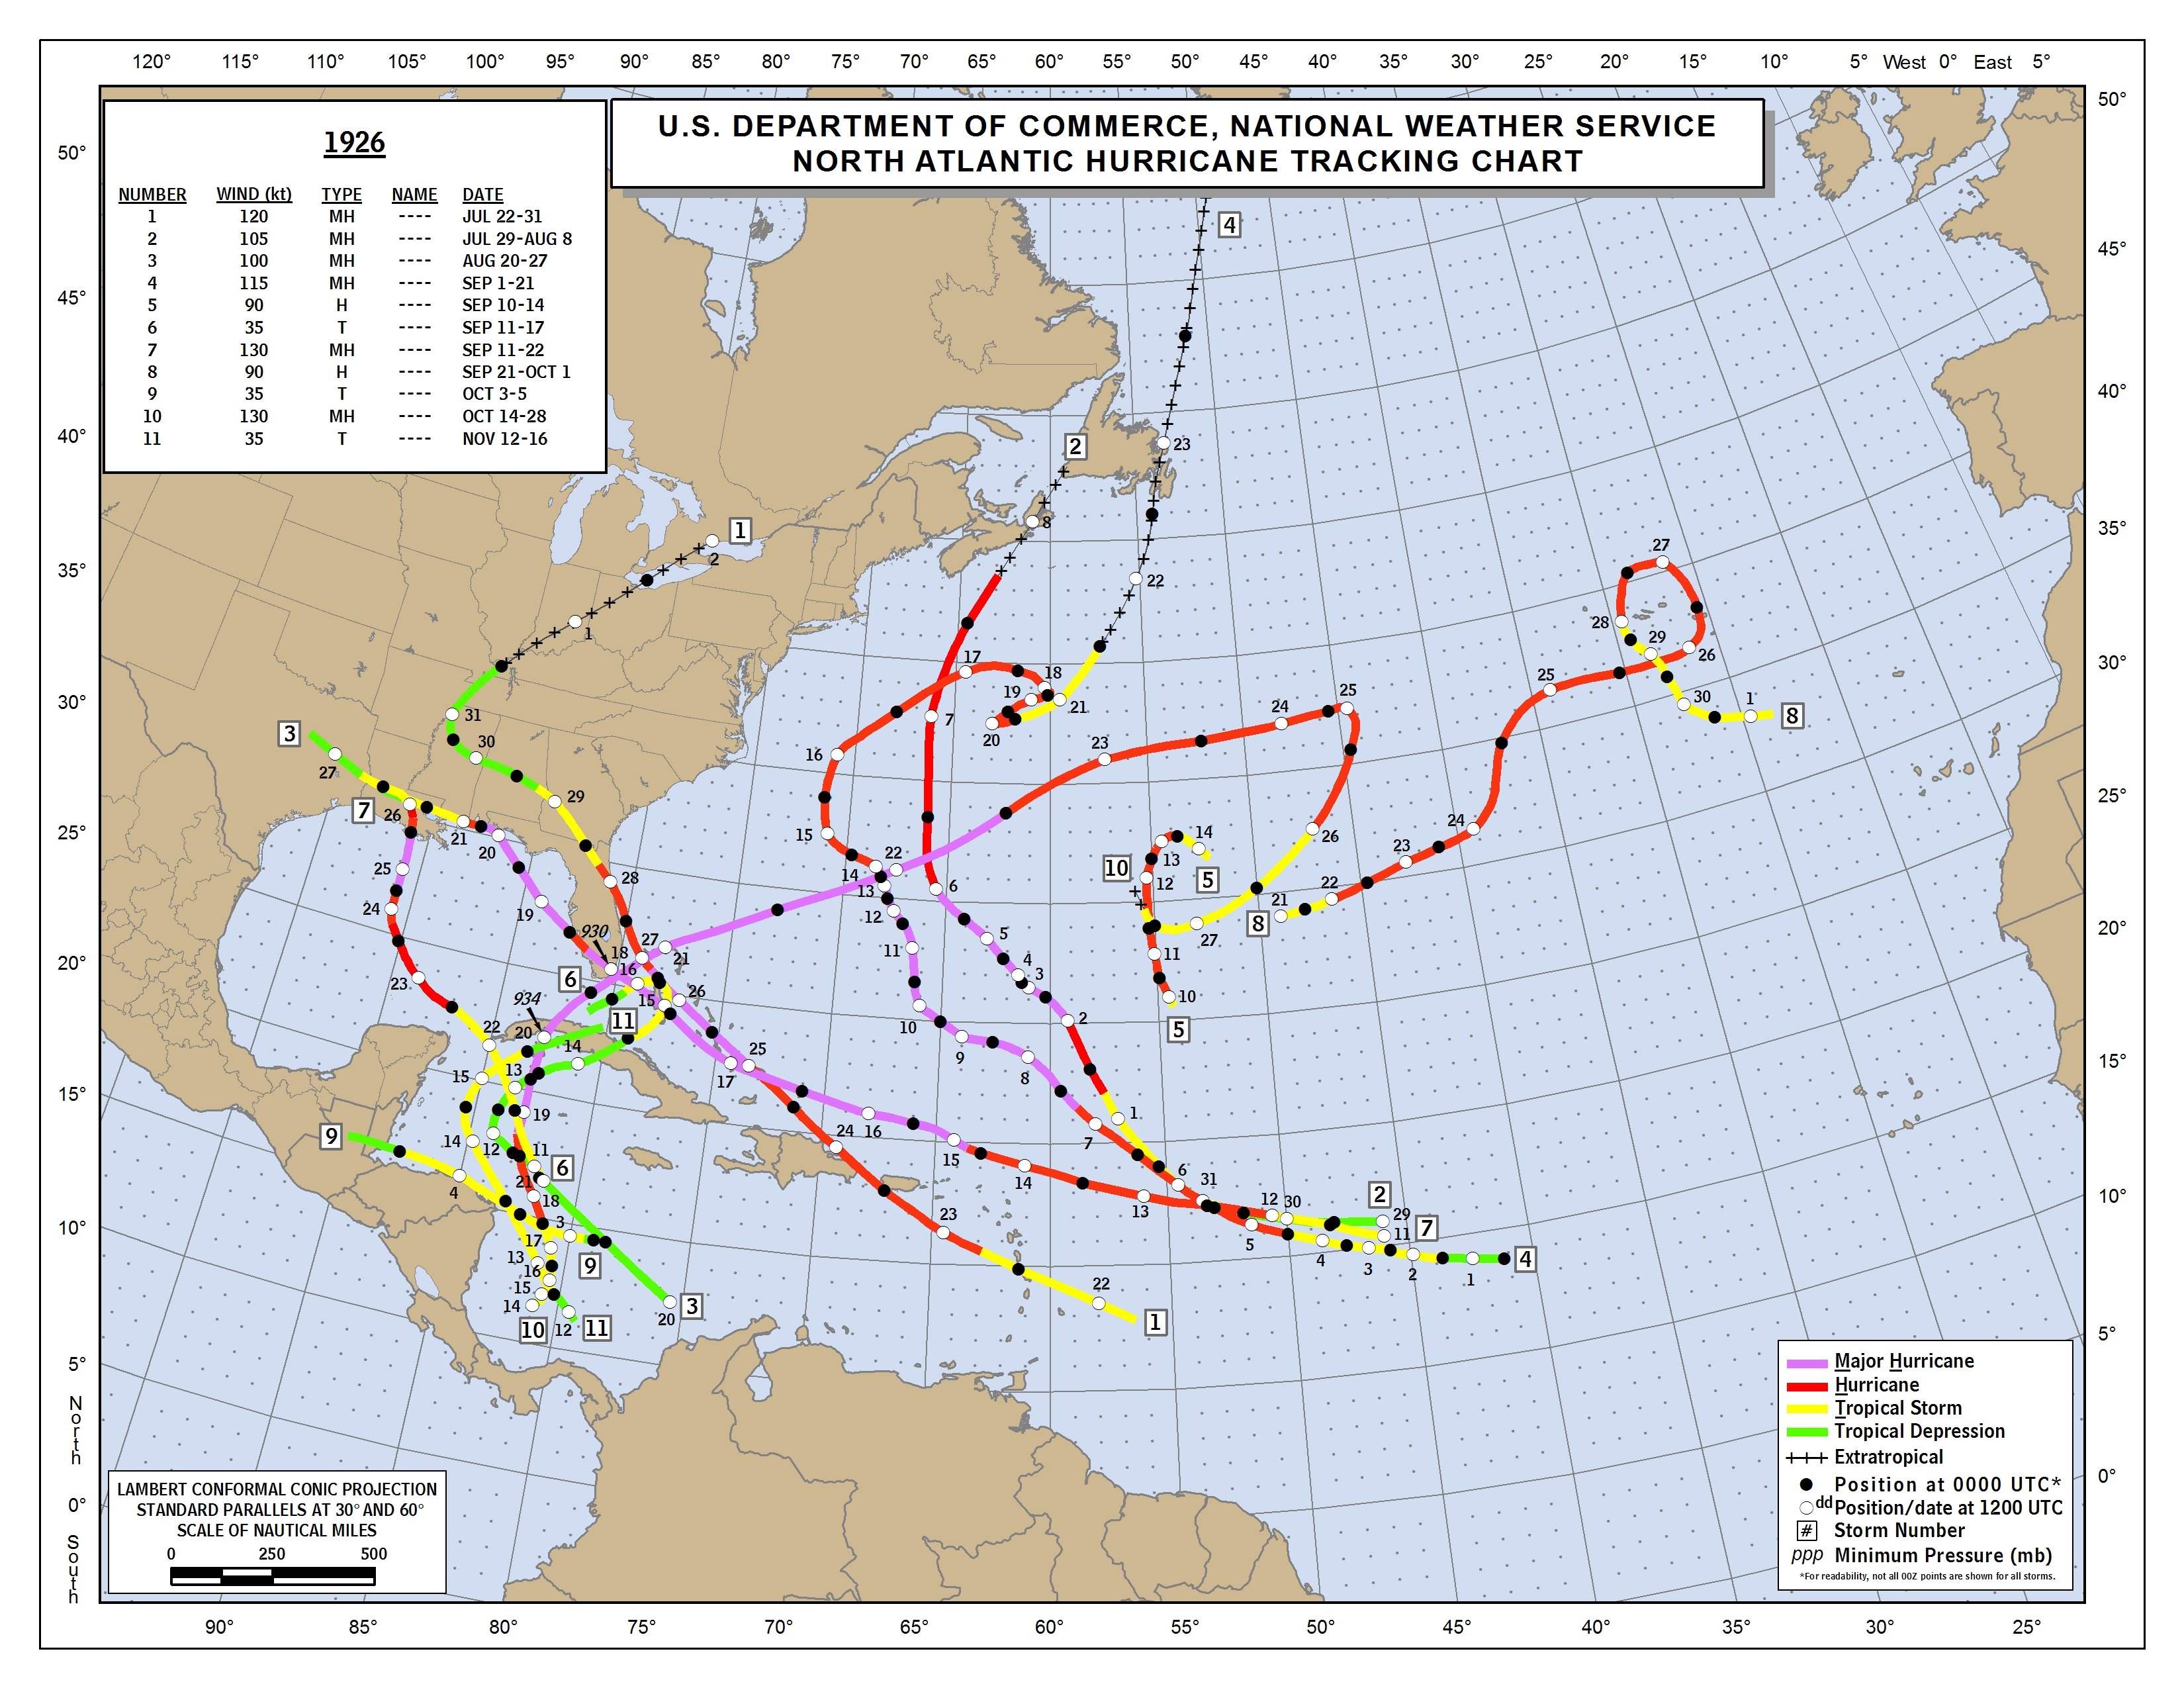
1926...11...22.75....~207%.....4(3)...................................(AL),(BM),(BS),(CU),(FL),(LA),PR,PT
1893...12...22.........~183%.....4(1)...................................(BS),CA,(GA),GP,HN,(LA),MX,(NC),NI,NY,(PR)
2004...15...22.25....~148%.....4(1)...................................(BS),(CU),DO,(FL),SC
1961...12...16.........~133%.....2(2)...................................(BZ),HN,(TX)
1999...12...14.25....~119%.....3(1)...................................AG,BL,(BS),FL,MF,NC,(TX)
2017...17...19.25....~113%.....3(3)...................................(AG),(BS),(CU),(DM),(FL),LA,(MF),MS,MX,(PR),(TX),(VG)
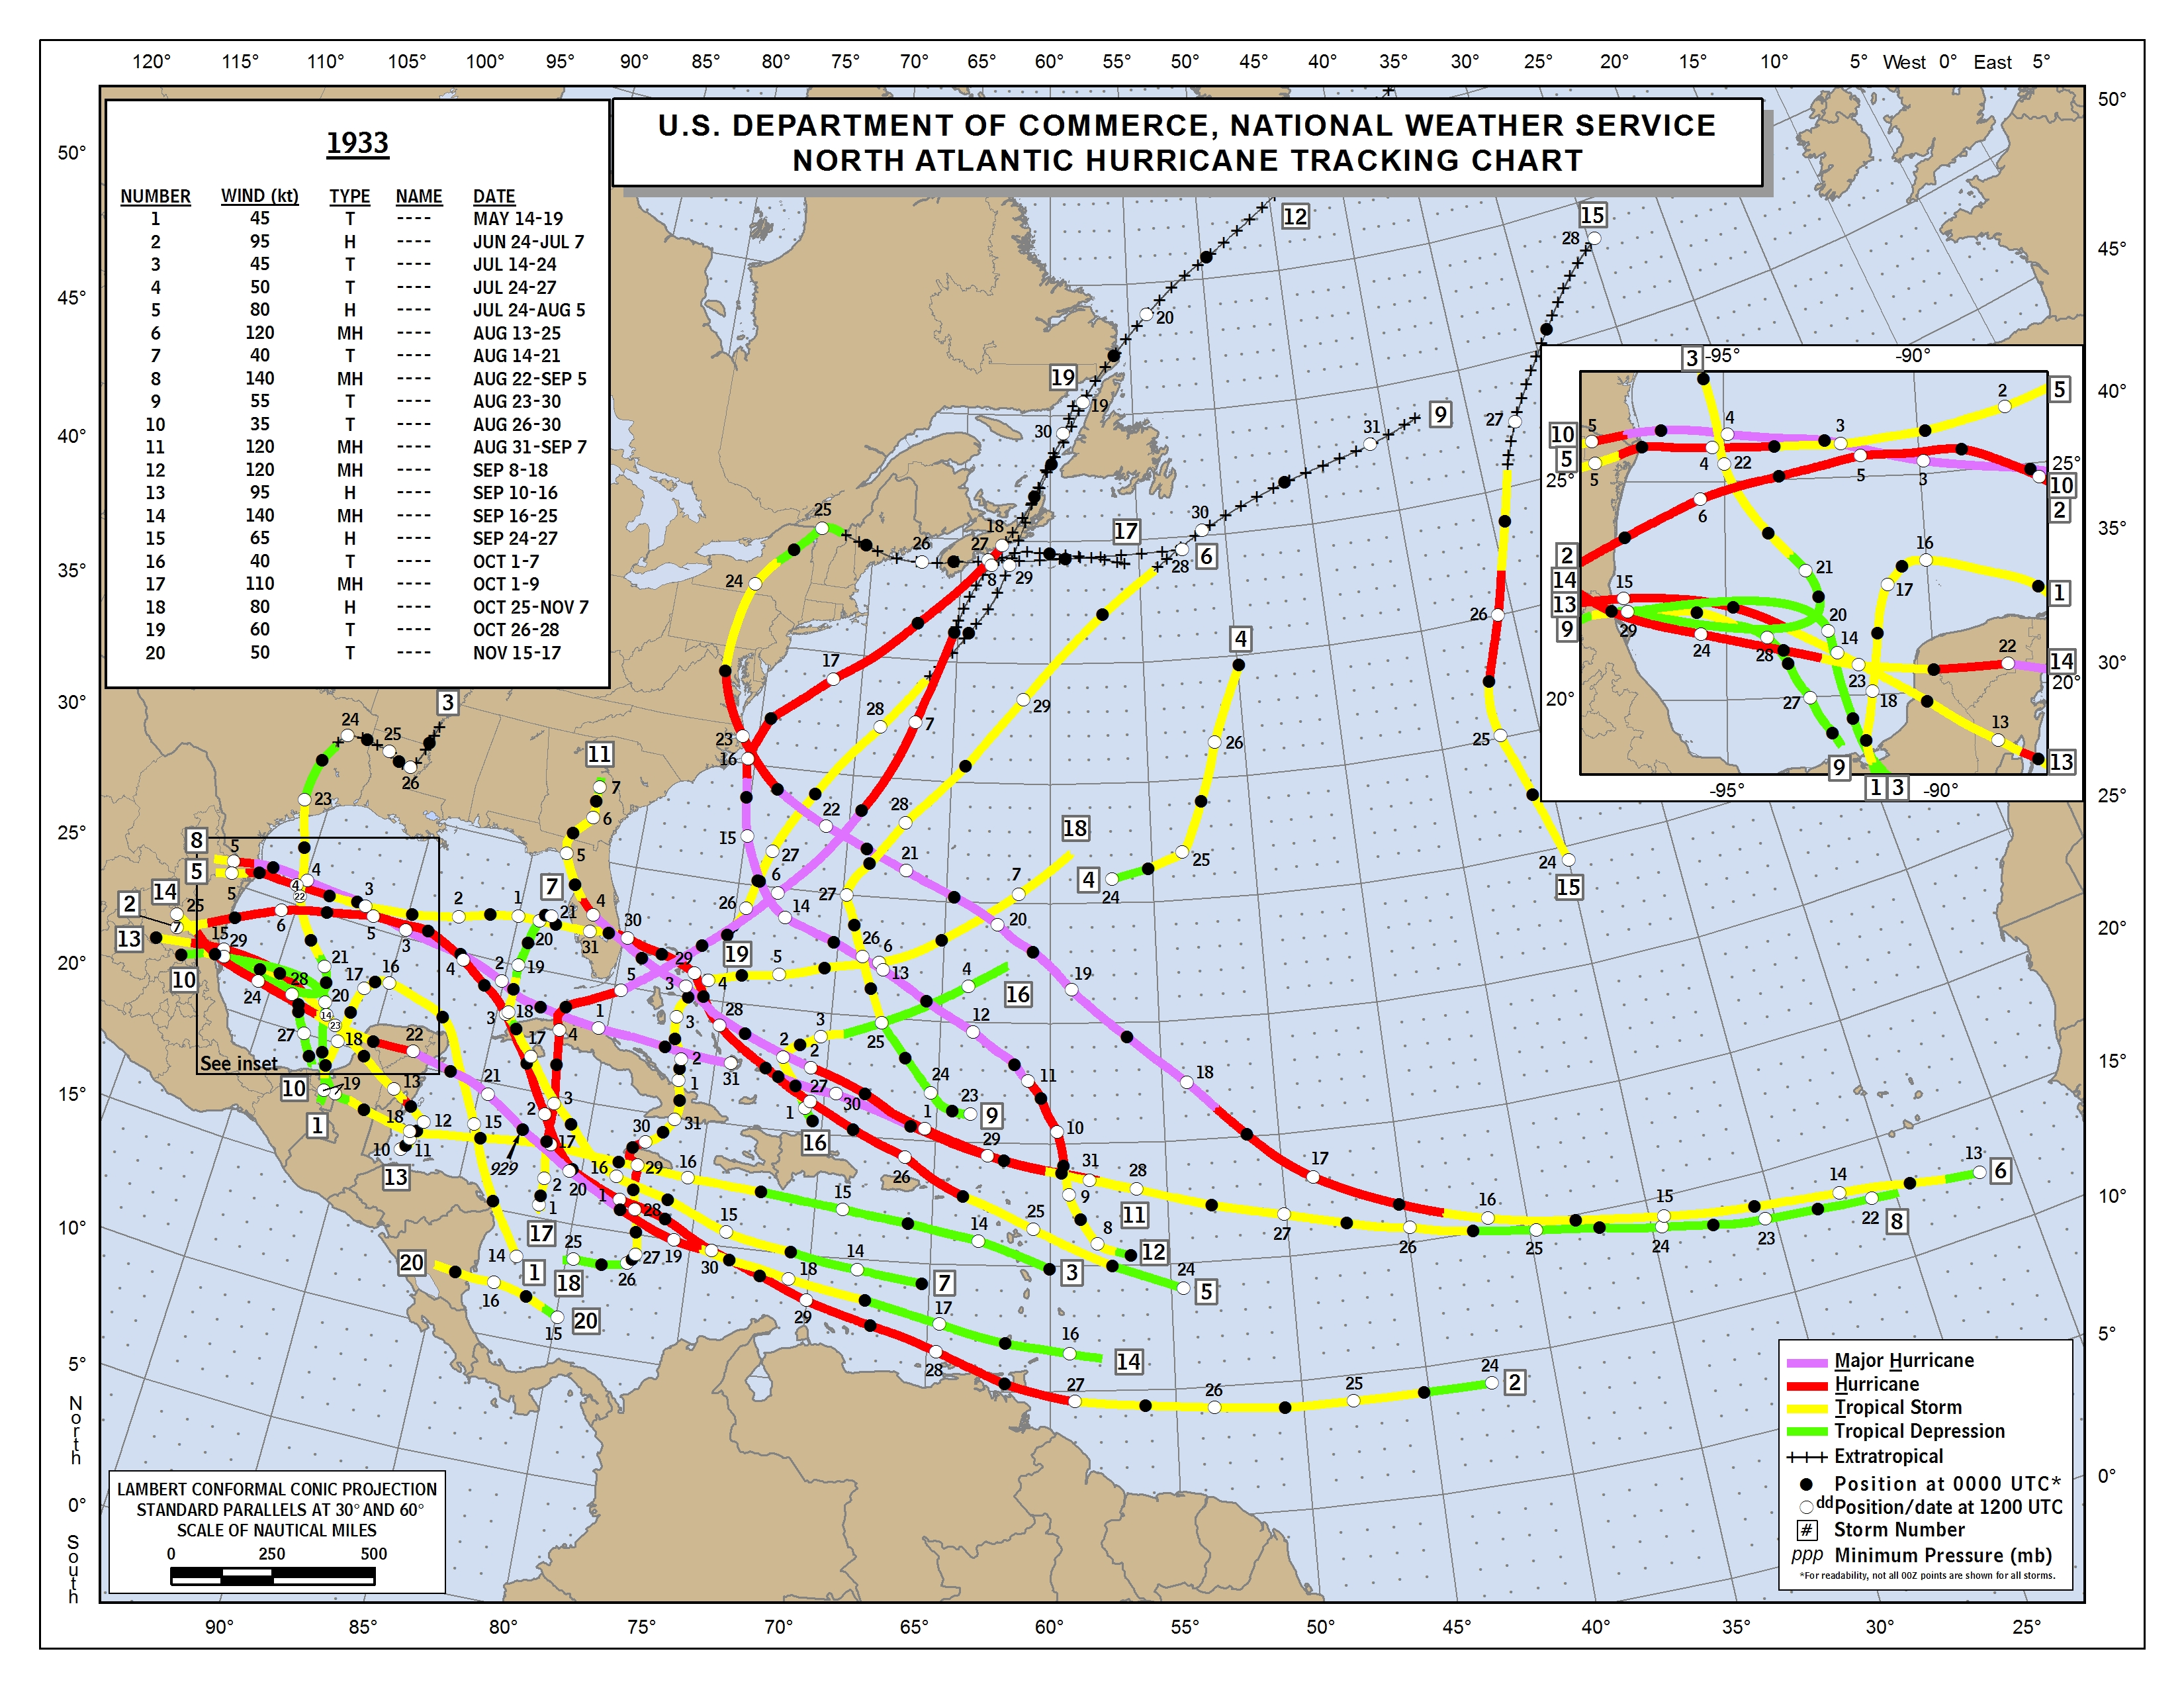
1933...20...21.75....~109%.....4(3)...................................BQ,(BS),(CU),(FL),JM,(MX),NC,TT,(TX),VE
2003...16...16.75....~105%.....0.......................................CA,MX,NC,TX
1996...13...13..........100%......1.......................................AI,BH,BL,CA,CU,MF,MX,NC,NI,PR
1950...16...15.5......~97%.......3(1)...................................(AI),AL,CA,CU,(FL),MX
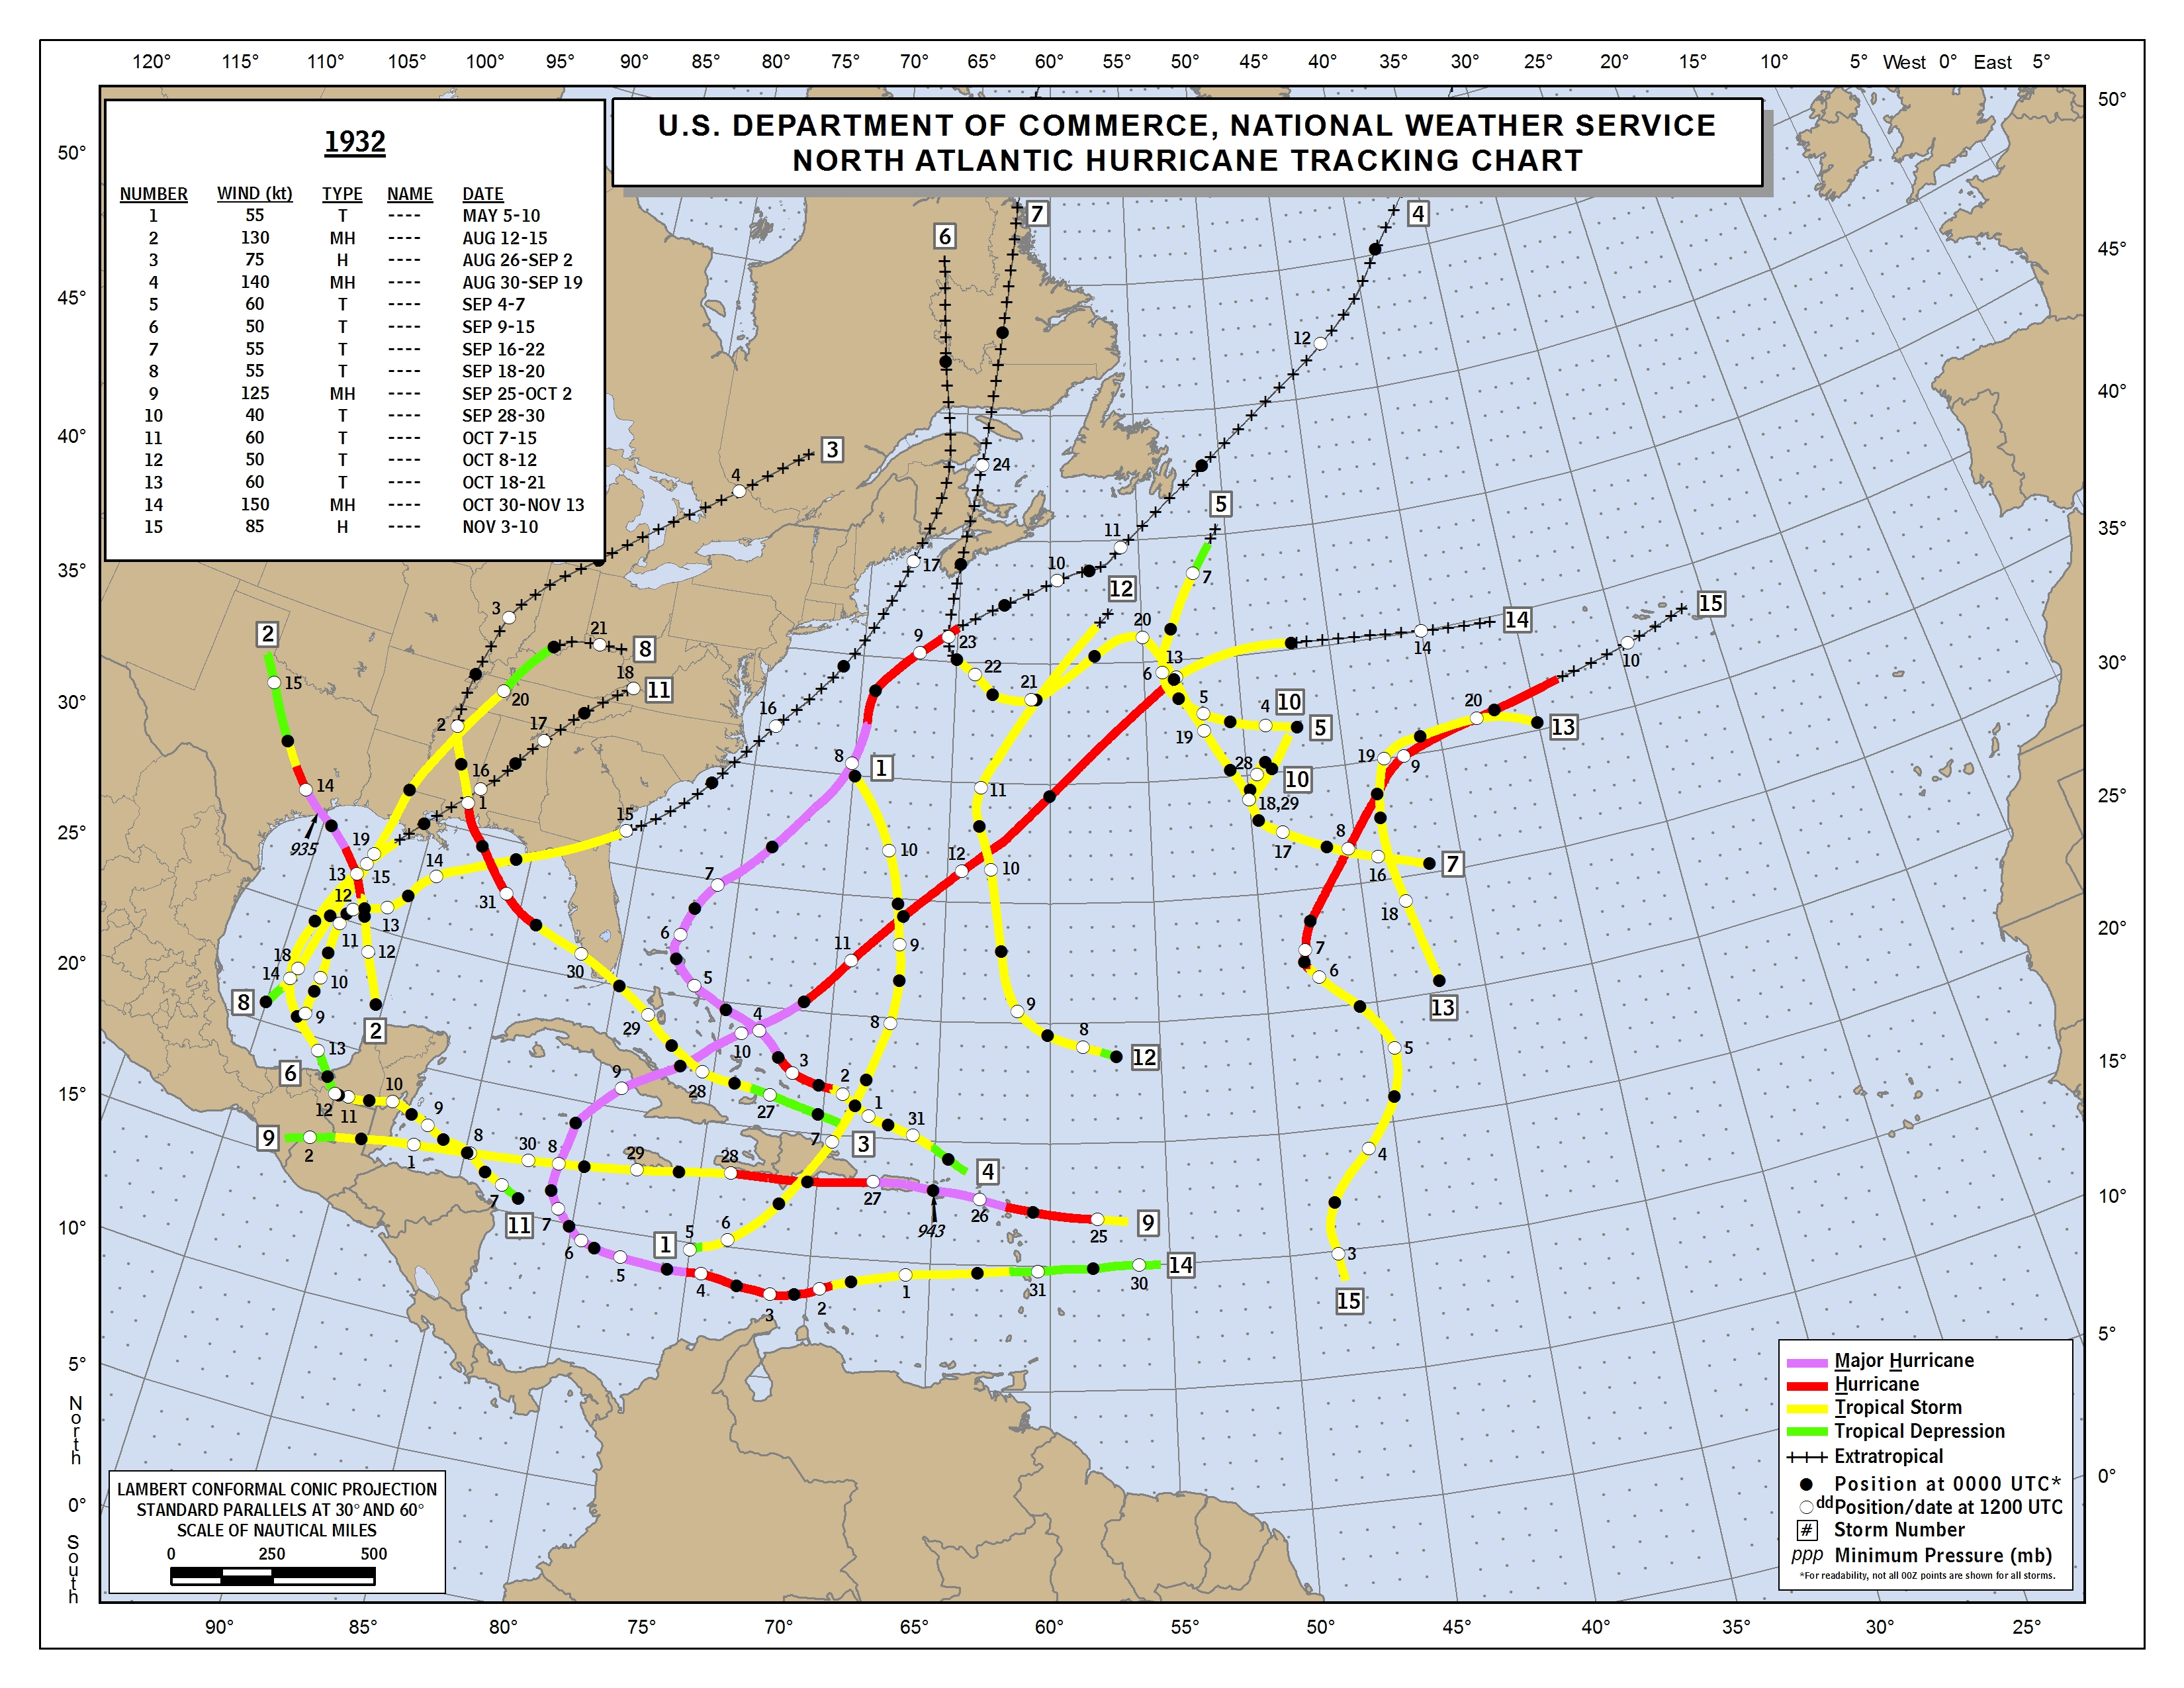
1932...15...13.........~87%.......4(4)...................................AL,(BS),(CU),DO,(KY),(PR),(TX)
1878...12...10.........~83%.......0.......................................BS,CA,CU,DO,FL,HT,NC,SC,TT
1964...13...9...........~69%.......1(1)...................................CU,FL,(GP),(HT),LA
1998...14...9.5........~68%.......1.......................................(AG),CU,(DO),FL,HN,(KN),MS,(PR),VI
1955...13...8.5........~65%.......2(1)...................................DO,(HN),SX,(MX),NC,VC
2005...28...17.5......~63%.......5(3)...................................(CU),(FL),(LA),(MX),VC
1995...19...11.5......~61%.......3(1)...................................(AG),BS,CA,DM,(FL),(MX),VG,VI
2010...19...11.........~58%.......1.......................................CA,BZ,(MX),VC
1886...12...4.5........~38%.......3(1)...................................BS,CA,(CU),DO,FL,JM,(LA),MX,(TX),VC
1887...19...6.75......~36%.......1.......................................(BS),CU,FL,HT,LA,MX,TX
1969...18...6.5........~36%.......2(1)...................................BZ,CU,ME,(MS)
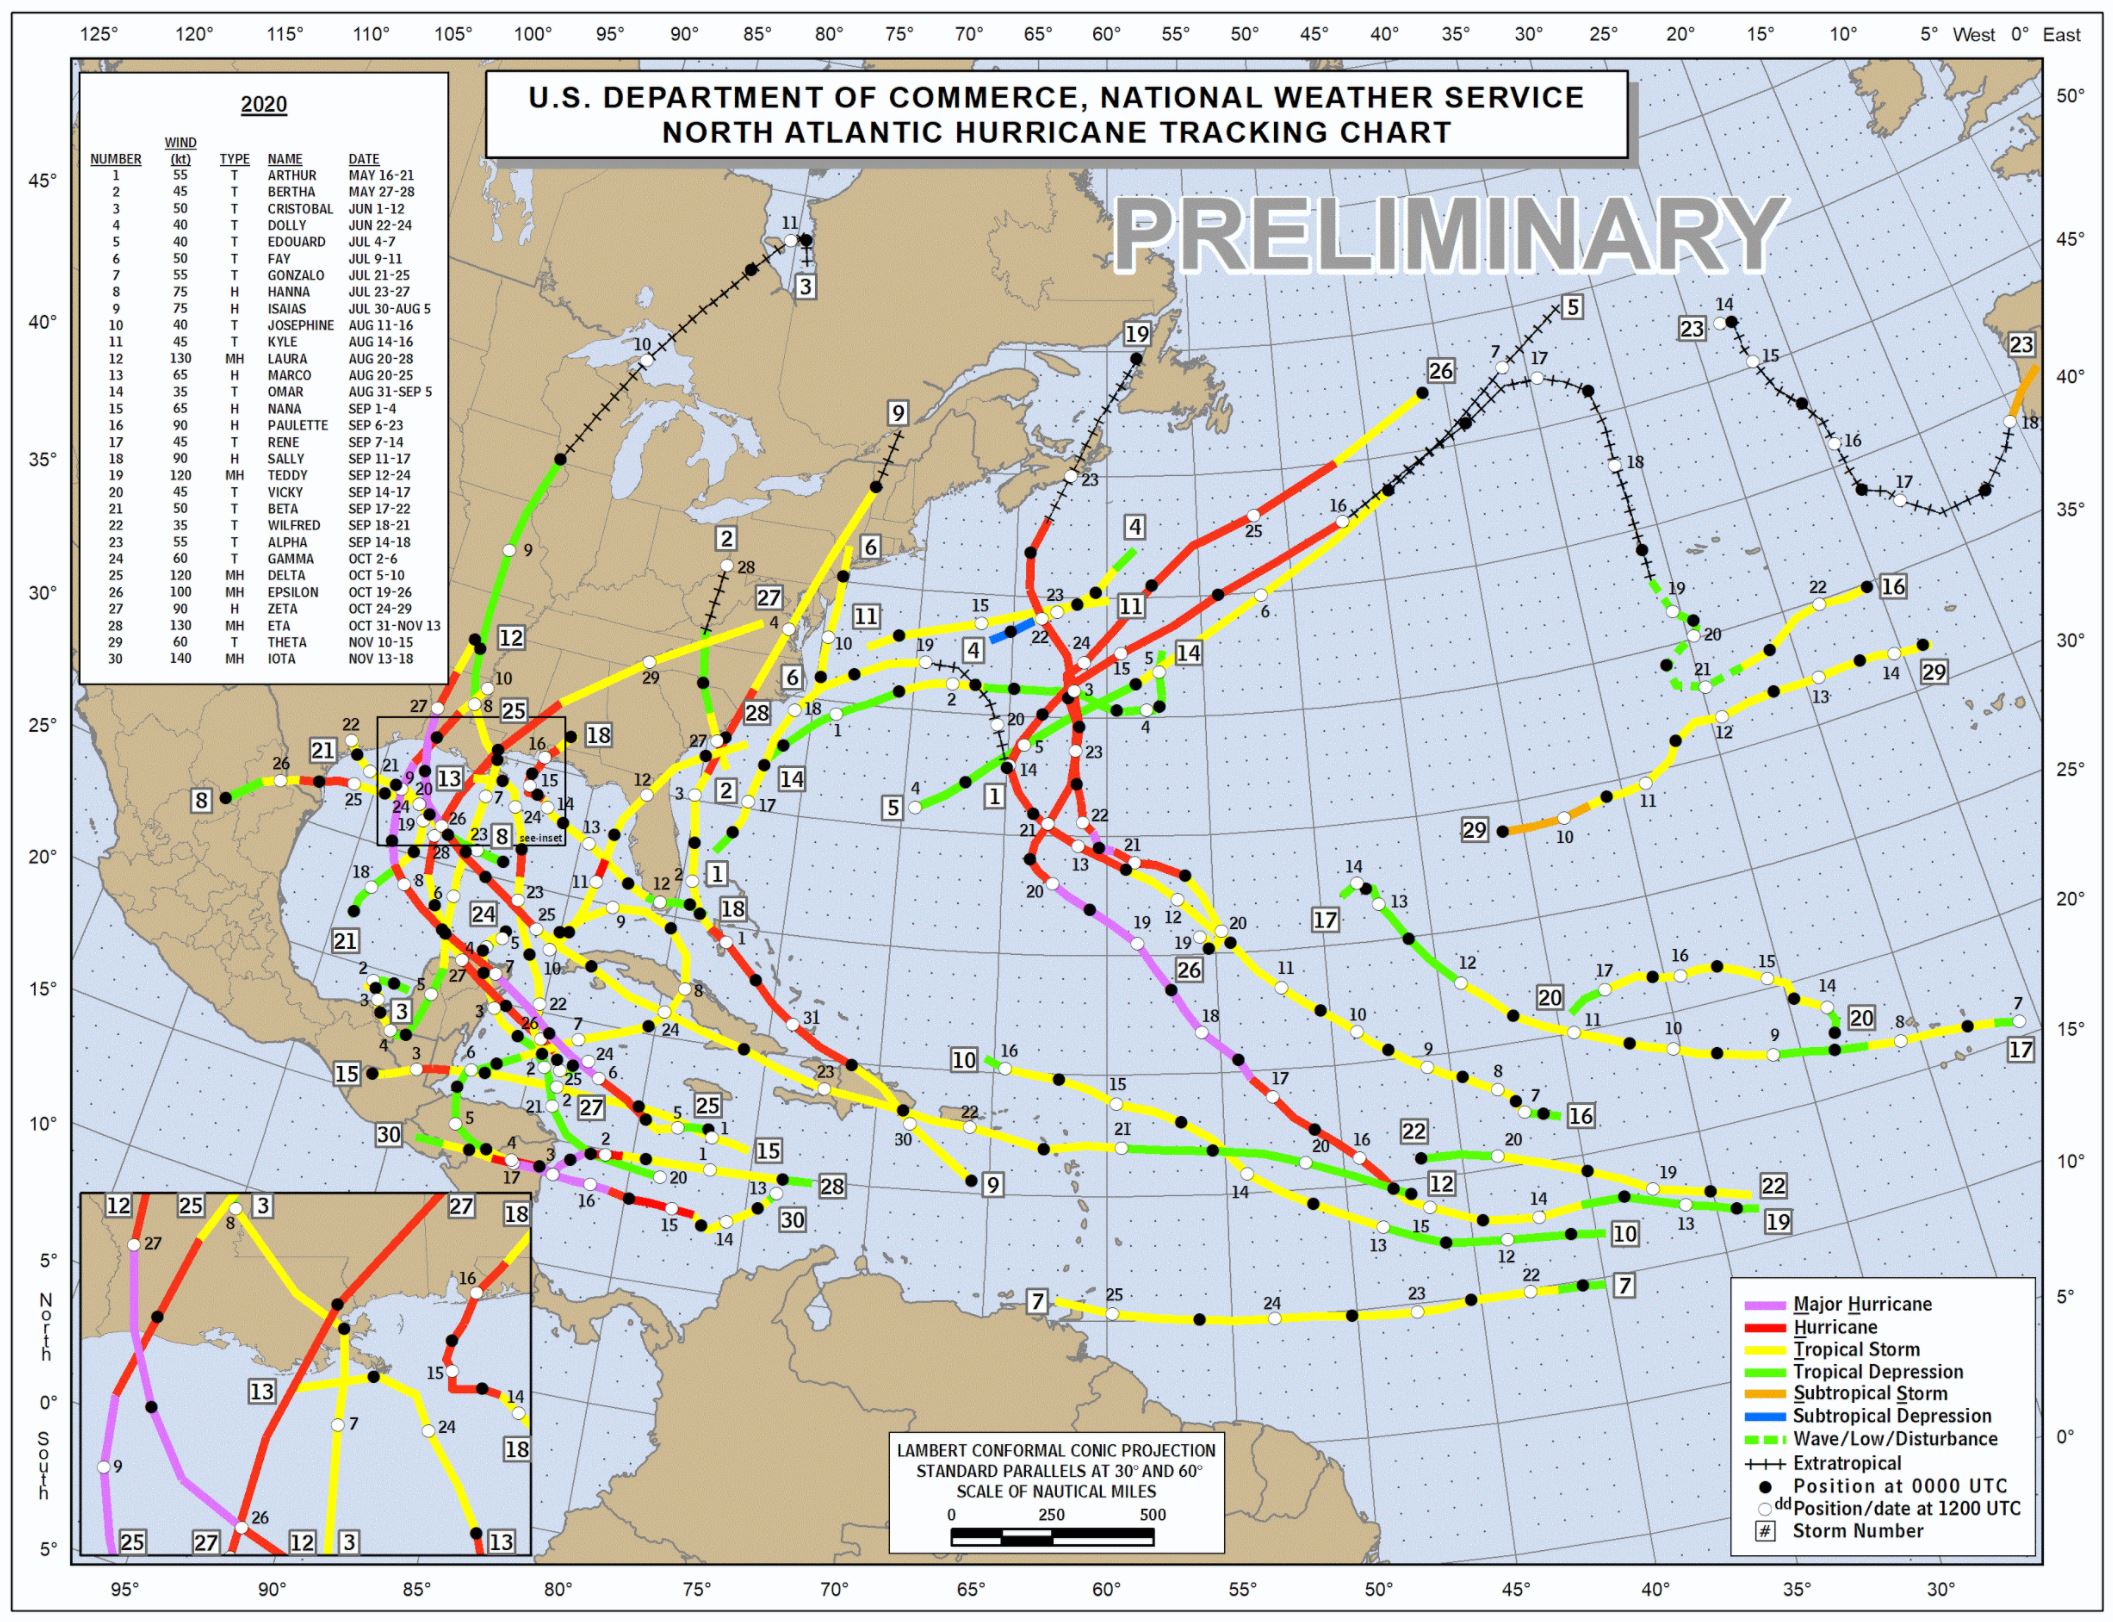
2020...30...8.75......~29%.......3(3)...................................AL,BM,BS,BZ,(LA),MX,NC,(NI),TX
*Ratio of major hurricane days (MHD) to total named storms (NS)
AG = Antigua and Barbuda, AI = Anguilla, BL = Saint-Barthélemy, BM = Bermuda, BQ = Bonaire, Sint Eustatius and Saba, BS = Bahamas, BZ = Belize, CA = Canada, CU = Cuba, DM = Dominica, DO = Dominican Republic, GP = Guadeloupe, HN = Honduras, HT = Haiti, JM = Jamaica, KN = Saint Kitts and Nevis, KY = Cayman Islands, LI = Leeward Islands, MF = Saint-Martin, MX = Mexico, NI = Nicaragua, PR = Puerto Rico, PT = Portugal (including Azores), SX = Sint Maarten, TT = Trinidad and Tobago, VC = Saint Vincent and the Grenadines, VE = Venezuela, VG = British Virgin Islands, VI = American Virgin Islands
Sources: A, B, C, D
Based on the data, the most impactful seasons seem to have been 1926, 1932, 1933, and 2017: the totality of which produced (M)H impacts → AL, (The Bahamas), (Bermuda), (the Cayman Islands), (Cuba), (FL), (LA), (the Leeward Islands), (Mexico), MS, NC, (Puerto Rico), (TX), and (the Windward Islands). These seasons generated an unusually high proportion of intense, long-lived, westward-tracking major hurricanes, many of which made one or more landfalls as Category-4+ systems. Here are the Category-4+ impacts from those seasons:
- Storm......................SSHS......Peak MSW.....Cat-4+ LF
- 1926 Storm #1........Cat 4 — 120 knots — The Bahamas
- 1926 Storm #7........Cat 4 — 130 knots — The Bahamas, FL
- 1926 Storm #10......Cat 4 — 130 knots — Cuba
- 1932 Storm #2........Cat 4 — 130 knots — TX
- 1932 Storm #4........Cat 5 — 140 knots — The Bahamas
- 1932 Storm #9........Cat 4 — 125 knots — Puerto Rico
- 1932 Storm #14......Cat 5 — 150 knots — Cayman Islands, Cuba
- 1933 Storm #8........Cat 5 — 140 knots — The Bahamas
- 1933 Storm #11......Cat 4 — 120 knots — The Bahamas
- 1933 Storm #14......Cat 5 — 140 knots — Mexico
- 2017 Harvey............Cat 4 — 115 knots — TX
- 2017 Irma...............Cat 5 — 155 knots — Antigua and Barbuda, British Virgin Islands, Cuba, FL, Saint-Martin, The Bahamas
- 2017 Maria..............Cat 5 — 150 knots — Dominica, Puerto Rico


