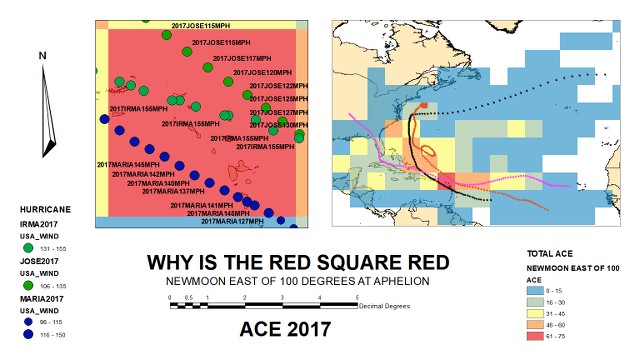

I took the database posted by TheAustinMan and blended it with the New Moon database. The scatterplot I posted showed a bifurcation either side of East 100. I took the top 20 high ACE years 10 East of East 100 and 10 West of it and totaled the ACE for each 5 degree cells. They look a little different. The west side had more storm frequency the east side had stronger storms the bottom line is that difference between more storms and stronger storms is about 3% more energy comes fewer but stronger storms which agrees with the same data split over the new 1944 to 2019 database which showed a 4.5% increase across the East 100 degree meridian.
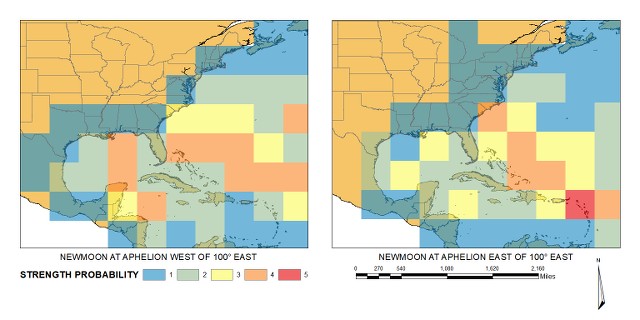
The conclusion is that at this resolution there is a consistency between the versions showing hot spots along the carolinas, Louisiana, Delaware, and the Virgin Islands. Florida is relatively tame considering iit is right in the middle of things.