
Why is the 2024 Atlantic hurricane season underperforming expectations?
Moderator: S2k Moderators
Forum rules

The posts in this forum are NOT official forecasts and should not be used as such. They are just the opinion of the poster and may or may not be backed by sound meteorological data. They are NOT endorsed by any professional institution or STORM2K. For official information, please refer to products from the National Hurricane Center and National Weather Service.
Re: The baffling late August-early September Atlantic shutdown of 2024
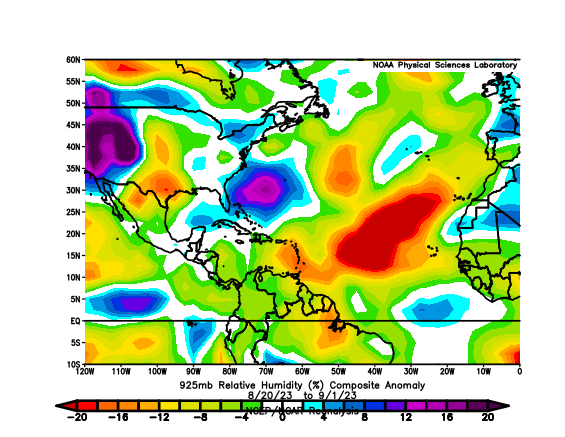
I did a bit more digging with 2023, and found that Tropical Storm Lee formed when the basin looked like this. It became a Cat 5 two days later.
7 likes
TC naming lists: retirements and intensity
Most aggressive Advisory #1's in North Atlantic (cr. kevin for starting the list)
Most aggressive Advisory #1's in North Atlantic (cr. kevin for starting the list)

Re: The baffling late August-early September Atlantic shutdown of 2024
Teban54 wrote:Ubuntwo wrote:Mid-level dry, stable air is what prevented the developing vortex on the west basin tropical wave from surviving a diurnal cycle. One diurnal minimum period with persistent concentrated convection, and we would be talking about a caribbean cruiser and likely high end Gulf coast landfall (hence the highly bifurcated ensemble solutions between limited/no development and long tracking major hurricane). The precursor waves to both Ernesto and Debby also dealt with this same airmass delaying development. Transport of mid level dryness and overall levels of stability are two big things to look into, IMO.
Assuming we're talking about the diurnal min on the night of Aug 31 - Sep 1, when the wave had the best possible chances of organizing, it looks like the layer that's significantly dryer than average was actually in the lower levels. The loop below plays from 500 to 925 mb, and the wave was at roughly 10N 50W at that time. While 600 mb is a little bit dry, other levels seem roughly okay -- except when you get to 925 mb, where that exact spot has one of the lowest RH anomalies in the Atlantic.
This is also a persistent theme during the entire August 2024: 925 mb dry air off the coast of South America.
https://i.postimg.cc/9FmbM8sQ/ezgif-com-animated-gif-maker-1.gif
Mid levels do look dry when you look at absolute values, not anomalies. But that's where I found another interesting discovery -- You know what's even drier? 2023!
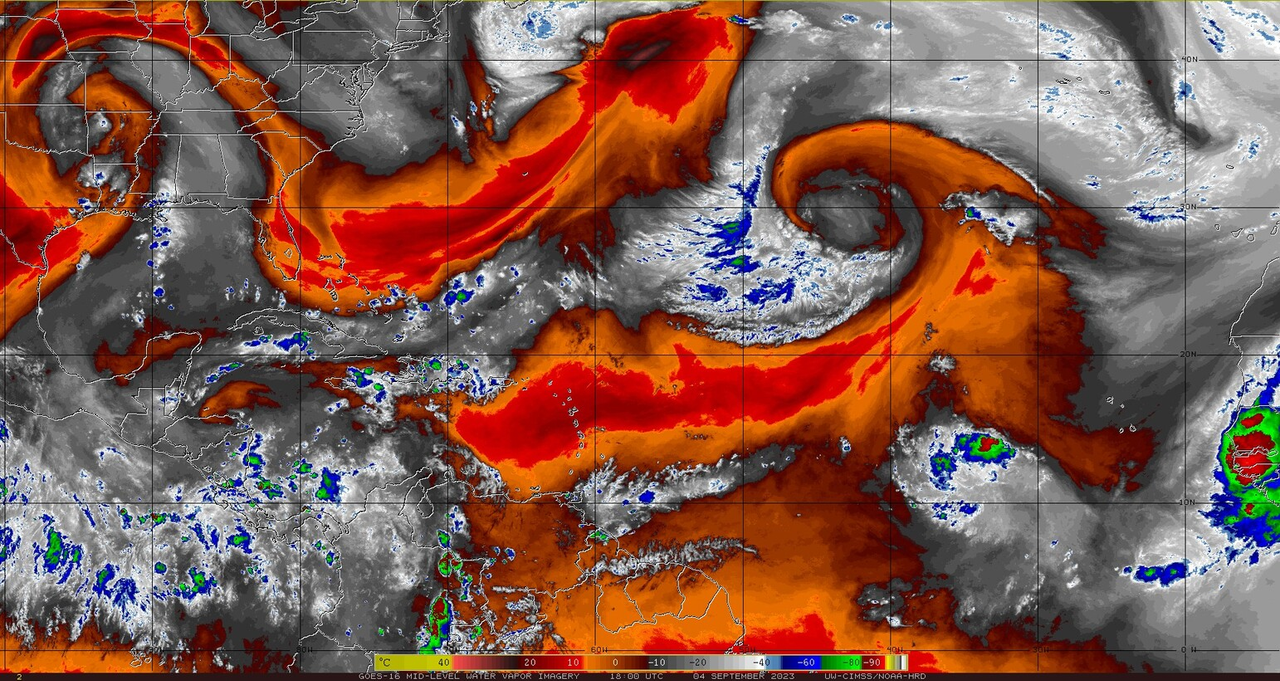
Here's mid-level water vapor imagery at the same time in 2024 vs. 2023. Low-level images look similar.
12z Aug 31, 2024
https://i.postimg.cc/vm46Tjrf/image.png
12z Aug 31, 2023
(NW Atlantic looks wet primarily due to ex-Idalia.)
https://i.postimg.cc/28Cbh3dz/image.png
I've also checked 2023's averages during the Aug 20 - Sep 1 period: It was exceptionally dry at 925 mb, and at all other levels, the tropical Atlantic seems at least a bit drier than the same period in 2024.
https://i.postimg.cc/MGfvqBwY/image.png
Yet, 7 storms formed during the 12-day period in 2023, vs. 0 in 2024, despite a drier tropics overall. But why?
This is where things may relate to Woofde's commentabout randomness. Our 0/40 wave found one of the worst possible spots to be in on that night in the entire tropical Atlantic; if only it was a bit further north near the Leeward Islands, it would have moisture to develop into a strong (likely recurving) hurricane. Or, if the western MDR was just a little bit wetter to sustain convection, we could be looking at a storm similar to Laura and Ida right now. This is not saying bad luck was the only reason for the lull, but 2024 was probably just extremely unlucky in getting all kinds of random negative factors -- many of which are unpredictable -- at the same time.
I agree - timing was poor, especially with wave placement. It did not help that many waves splashing down in mid August were basically dead on arrival due to the extreme easterly shear. But like you said, in absolute terms 500-700 mb was pretty dry. We would expect strong positive anomalies in all layers over a tropical wave, not values closer to average. I wish there was a better way to get a look at basin-wide stability over the broken instability plot.
3 likes
Kendall -> SLO -> PBC
Memorable Storms: Katrina (for its Florida landfall...) Wilma Matthew Irma
Memorable Storms: Katrina (for its Florida landfall...) Wilma Matthew Irma
-
Emmett_Brown

- Category 5

- Posts: 1433
- Joined: Wed Aug 24, 2005 9:10 pm
- Location: Sarasota FL
Re: The baffling late August-early September Atlantic shutdown of 2024
3 days from now, we could be tracking 3 simultaneous TC's, or maybe none. I saw on Twitter/X today that the polar vortex is currently much weaker than average for this time of year (can't find the post). I'm not an expert, but to me, this is interesting, since upper level warming can lead to weakening of the vortex. This is a stretch, but perhaps it's another sign that recent solar activity is warming the upper levels of the atmosphere enough to enhance stability, alter weather patterns etc. Just a thought.
2 likes
-
CyclonicFury

- Category 5
- Posts: 2032
- Age: 27
- Joined: Sun Jul 02, 2017 12:32 pm
- Location: NC
- Contact:
Re: The baffling late August-early September Atlantic shutdown of 2024
Here's another fascinating stat: we've seen a total of only nine "invests" this season (90L-98L). 7 of the 9 were in *June*. Since July 1 the NATL has only seen 2 invests, which became Debby and Ernesto, and no invests since August 12. I don't think even seasons like 2013 had this few attempts at TCG.
8 likes
NCSU B.S. in Meteorology Class of 2021. Tropical weather blogger at http://www.cyclonicfury.com. My forecasts and thoughts are NOT official, for official forecasts please consult the National Hurricane Center.
Re: The baffling late August-early September Atlantic shutdown of 2024
2013 produced 14 named storms. So far in 2024 we are at 5.I know the season is not over but I don’t see things picking up the way the ITCZ is right now. The home grown activity is also non existent as well.
1 likes

Re: The baffling late August-early September Atlantic shutdown of 2024
CyclonicFury wrote:Here's another fascinating stat: we've seen a total of only nine "invests" this season (90L-98L). 7 of the 9 were in *June*. Since July 1 the NATL has only seen 2 invests, which became Debby and Ernesto, and no invests since August 12. I don't think even seasons like 2013 had this few attempts at TCG.
It's worth noting that they seem like they've been limiting how often invests are tagged from 2016 onward, there haven't been a lot of non-developing invests compared to prior to that, as it appears they're basing them on whether they reach 60% or not
5 likes
The above post is not official and should not be used as such. It is the opinion of the poster and may or may not be backed by sound meteorological data. It is not endorsed by any professional institution or storm2k.org. For official information, please refer to the NHC and NWS products.
Re: The baffling late August-early September Atlantic shutdown of 2024
Hammy wrote:CyclonicFury wrote:Here's another fascinating stat: we've seen a total of only nine "invests" this season (90L-98L). 7 of the 9 were in *June*. Since July 1 the NATL has only seen 2 invests, which became Debby and Ernesto, and no invests since August 12. I don't think even seasons like 2013 had this few attempts at TCG.
It's worth noting that they seem like they've been limiting how often invests are tagged from 2016 onward, there haven't been a lot of non-developing invests compared to prior to that, as it appears they're basing them on whether they reach 60% or not
You mean something like the Caribbean wave would have been declared an invest in earlier years, when it was still in the central Atlantic?
2 likes
TC naming lists: retirements and intensity
Most aggressive Advisory #1's in North Atlantic (cr. kevin for starting the list)
Most aggressive Advisory #1's in North Atlantic (cr. kevin for starting the list)
Re: The baffling late August-early September Atlantic shutdown of 2024
Teban54 wrote:Hammy wrote:CyclonicFury wrote:Here's another fascinating stat: we've seen a total of only nine "invests" this season (90L-98L). 7 of the 9 were in *June*. Since July 1 the NATL has only seen 2 invests, which became Debby and Ernesto, and no invests since August 12. I don't think even seasons like 2013 had this few attempts at TCG.
It's worth noting that they seem like they've been limiting how often invests are tagged from 2016 onward, there haven't been a lot of non-developing invests compared to prior to that, as it appears they're basing them on whether they reach 60% or not
You mean something like the Caribbean wave would have been declared an invest in earlier years, when it was still in the central Atlantic?
More than likely, a decade ago all three marked systems in the Atlantic would've been.
To my knowledge, they tag them mostly since having a tracked system helps the models better--as the models got better (up until this year apparently) it simply became less necessary to tag them when confidence in development was low.
edit: I calculated the number of invests per season and how many failed to develop
From 2007-2015, an average of 55% of invests failed to develop (07/09/13/14 exceeded 60%, and only 2012 fell below 40%)
From 2016-2023, an average of 36% of invests failed to develop (no years exceeded 60%--2022 at 53% was the highest, and only 17/21/22 exceeded 40%)
So there was definitely a policy change as far as how invests are tagged that led to a general reduction of issuances, and 2024 is at 25%, on par with 2020 percentage-wise
Last edited by Hammy on Tue Sep 03, 2024 6:18 pm, edited 2 times in total.
2 likes
The above post is not official and should not be used as such. It is the opinion of the poster and may or may not be backed by sound meteorological data. It is not endorsed by any professional institution or storm2k.org. For official information, please refer to the NHC and NWS products.
Re: The baffling late August-early September Atlantic shutdown of 2024
Hammy wrote:Teban54 wrote:Hammy wrote:
It's worth noting that they seem like they've been limiting how often invests are tagged from 2016 onward, there haven't been a lot of non-developing invests compared to prior to that, as it appears they're basing them on whether they reach 60% or not
You mean something like the Caribbean wave would have been declared an invest in earlier years, when it was still in the central Atlantic?
More than likely, a decade ago all three marked systems in the Atlantic would've been.
To my knowledge, they tag them mostly since having a tracked system helps the models better--as the models got better (up until this year apparently) it simply became less necessary to tag them when confidence in development was low.
Getting away from the conversation itself, but the bolded part is an interesting point, and fortunately this thread is exactly the place to discuss it.
Are there any verifications done on how well models have done this year compared to past years? It's easy to get the impression that they're doing poorly (as seen above), but a few points on top of my head:
- Global models ended up largely accurate on their portrayal of a quiet late August and early September, up to today (and quite plausibly in the next 7 days). In earlier years when the switch did "flip on time" around August 20, models would often similarly show little to no development 10+ days out, only to change drastically later. Meanwhile, 2022 was notorious for having model storms after model storms in the MDR that didn't materialize until Earl.
- Ensembles did overhype the wave that's currently in the Caribbean, and global models later caught on the same trend for a few days. But such phantom storms and/or way overestimated intensities weren't unique to 2024 either: Philippe 2023, Bonnie 2022 and Peter 2021 are some examples that I can easily recall, and I'm sure there are others. Also, the wave probably did have a 50% chance of becoming a significant storm (as it could have easily developed east of Lesser Antilles), just that it didn't materialize -- the outcomes were feast or femine.
- On the other hand, while there were ensemble signals for Debby and Ernesto further out, operational models didn't show them until a week or less in advance. That can be seen as bad performance, but 2024 was not the only year it happened. For example, I was digging through the 2017 archives a while back, and its early August storms (Franklin and Gert) came with similarly little notice.
It's probably a question that nobody has a great answer to, but still worth raising nevertheless.
0 likes
TC naming lists: retirements and intensity
Most aggressive Advisory #1's in North Atlantic (cr. kevin for starting the list)
Most aggressive Advisory #1's in North Atlantic (cr. kevin for starting the list)
Re: The baffling late August-early September Atlantic shutdown of 2024
Teban54 wrote:Hammy wrote:Teban54 wrote:You mean something like the Caribbean wave would have been declared an invest in earlier years, when it was still in the central Atlantic?
More than likely, a decade ago all three marked systems in the Atlantic would've been.
To my knowledge, they tag them mostly since having a tracked system helps the models better--as the models got better (up until this year apparently) it simply became less necessary to tag them when confidence in development was low.
Getting away from the conversation itself, but the bolded part is an interesting point, and fortunately this thread is exactly the place to discuss it.
Are there any verifications done on how well models have done this year compared to past years? It's easy to get the impression that they're doing poorly (as seen above), but a few points on top of my head:My overall question is: How much should we trust the models this year, and how likely are they to either show a flip or show that it won't happen? Some of the points above would give some credence to the models, but the consensus from earlier discussions seems to be that if/when the flip does come, we won't know until just a few days out.
- Global models ended up largely accurate on their portrayal of a quiet late August and early September, up to today (and quite plausibly in the next 7 days). In earlier years when the switch did "flip on time" around August 20, models would often similarly show little to no development 10+ days out, only to change drastically later. Meanwhile, 2022 was notorious for having model storms after model storms in the MDR that didn't materialize until Earl.
- Ensembles did overhype the wave that's currently in the Caribbean, and global models later caught on the same trend for a few days. But such phantom storms and/or way overestimated intensities weren't unique to 2024 either: Philippe 2023, Bonnie 2022 and Peter 2021 are some examples that I can easily recall, and I'm sure there are others. Also, the wave probably did have a 50% chance of becoming a significant storm (as it could have easily developed east of Lesser Antilles), just that it didn't materialize -- the outcomes were feast or femine.
- On the other hand, while there were ensemble signals for Debby and Ernesto further out, operational models didn't show them until a week or less in advance. That can be seen as bad performance, but 2024 was not the only year it happened. For example, I was digging through the 2017 archives a while back, and its early August storms (Franklin and Gert) came with similarly little notice.
It's probably a question that nobody has a great answer to, but still worth raising nevertheless.
I can easily address the bold and expand on what I meant, the models have been painfully inconsistent this year in a way I've never seen in prior years--whether we see just a couple more storms, or an intensely back loaded season, the models seem like they're all over the place from run to run--even out to 72 hours--to the point where we can't even tell what kind of trend is going on.
The models failed to pick up Beryl until a couple of days out, and similarly, they keep showing storms in the short term that just aren't happening.
Aside from whatever's going on with the season itself, something is clearly going on with the models as well, either how they're run, or with the data collection and integration.
0 likes
The above post is not official and should not be used as such. It is the opinion of the poster and may or may not be backed by sound meteorological data. It is not endorsed by any professional institution or storm2k.org. For official information, please refer to the NHC and NWS products.
Re: The baffling late August-early September Atlantic shutdown of 2024
Here's a tweet about earlier seasonal forecasts. Apparently, the C3S forecast for July-October, issued as late as June, did correctly indicate the Sahara to be much wetter than normal... But it also showed near-record precipitation across basically the entire Atlantic, when most of the basin turned out slightly below-average in JJA, with the notable exceptions of GoM and NW Atlantic.
(Hurricane2022, if you need a repost of the tweets due to being blocked in Brazil, either reply here or shoot me a DM.)
https://x.com/wxmann/status/1831093633795395746
--------------------------------------------------------------------------------
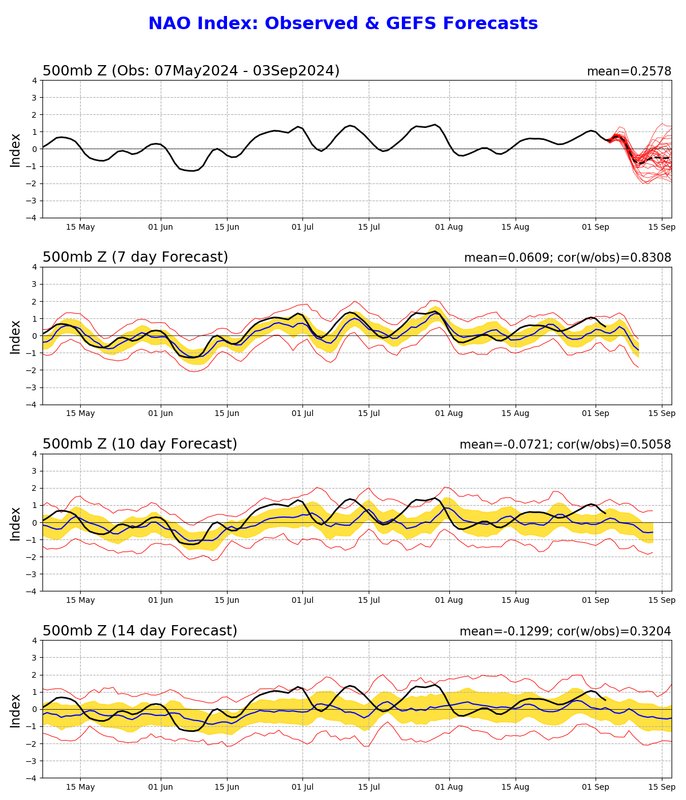
Some other chatters about +NAO: August has the most positive NAO on record for any calendar month. However, this was forecast well in advance, and I do recall such a pattern showing up on seasonal forecasts since March or April.
While others had previously linked the pattern to the persistent +NAO, as Danny said here, I do recall other years that were hyperactive with +NAO; in fact, such setups were seen as potentially dangerous, as it would push storms further west. Personally, I had made the point a few times back then that I didn't expect the off-the-roof +2C MDR SSTAs to last due to the +NAO, and that it would return to a more "typical hyperactive season" level around +1C, which the seasonal models showed and which did happen in reality. Models were also showing the extratropics warming up, in line with the +NAO. However, I don't think anyone could have seen the implications of such a pattern that far out in advance (at least none of the professional seasonal forecasters did).
Meanwhile, NAO is expected to turn negative by the end of this week.
https://x.com/WorldClimateSvc/status/1831059382450499794
https://x.com/dmorris9661/status/1831069625205031018
(Hurricane2022, if you need a repost of the tweets due to being blocked in Brazil, either reply here or shoot me a DM.)
https://x.com/wxmann/status/1831093633795395746
--------------------------------------------------------------------------------
Some other chatters about +NAO: August has the most positive NAO on record for any calendar month. However, this was forecast well in advance, and I do recall such a pattern showing up on seasonal forecasts since March or April.
While others had previously linked the pattern to the persistent +NAO, as Danny said here, I do recall other years that were hyperactive with +NAO; in fact, such setups were seen as potentially dangerous, as it would push storms further west. Personally, I had made the point a few times back then that I didn't expect the off-the-roof +2C MDR SSTAs to last due to the +NAO, and that it would return to a more "typical hyperactive season" level around +1C, which the seasonal models showed and which did happen in reality. Models were also showing the extratropics warming up, in line with the +NAO. However, I don't think anyone could have seen the implications of such a pattern that far out in advance (at least none of the professional seasonal forecasters did).
Meanwhile, NAO is expected to turn negative by the end of this week.
https://x.com/WorldClimateSvc/status/1831059382450499794
https://x.com/dmorris9661/status/1831069625205031018
1 likes
TC naming lists: retirements and intensity
Most aggressive Advisory #1's in North Atlantic (cr. kevin for starting the list)
Most aggressive Advisory #1's in North Atlantic (cr. kevin for starting the list)
-
SFLcane

- S2K Supporter

- Posts: 10281
- Age: 48
- Joined: Sat Jun 05, 2010 1:44 pm
- Location: Lake Worth Florida
Re: The baffling late August-early September Atlantic shutdown of 2024
If your wondering we’re the hurricanes are I highly recommend you give this video a watch from a former NHC director highly respected in the tropical community Rick Kabb.
Link: https://youtube.com/watch?v=cKC8V9HNeYA
Link: https://youtube.com/watch?v=cKC8V9HNeYA
1 likes

Re: The baffling late August-early September Atlantic shutdown of 2024
Caribbean wave struggling but worthy of monitoring, while the surprisingly muted Atlantic plods forward
https://theeyewall.com/caribbean-wave-s ... s-forward/
The Sahara and Sahel have been wet lately. The thunderstorms are going to the deserts of North Africa.
https://theeyewall.com/caribbean-wave-s ... s-forward/
The Sahara and Sahel have been wet lately. The thunderstorms are going to the deserts of North Africa.
0 likes
Re: The baffling late August-early September Atlantic shutdown of 2024
Here’s Joe D’Aleo’s write-up from 2011 on the affects of high solar causing a warmer upper atmosphere in the winter of 2001-02:
https://www.weatherbell.com/newsletter-10-11-2011-f
“The only year since 1998 since I have been doing this which has significantly departed for the seasons was 2001/02 winter when a strong second solar max in terms of solar flux and UV warmed low and mioddle latitude atmospheres and shrunk the polar vortex.
I presented this at NWS regional winter workshops in the fall of 2002 and was invited the present that to CPC in Maryland. High ultraviolet produces warming through ozone chemistry, a finding that was speculated by Labitzke and van Loon (1997) and confirmed by Hansen's super modeler Drew Shindell (1999) who included ozone chemistry and flux/UV in a special climate model and got improved verficiation retrospectively..They all found a tendency for the warmth to work its way down from the high atmosphere where to the middle troposphere where it affected the jet stream and flow patterns.
The peak in flux/UV in 2001/02 winter was very clear (from September 2001 to March 2002.
The resultant warming in the low and middle latiudes was likewise very clear. This is the 500mb height in February. This looks more like the southern hemispehre with a tight polar vortec in blue - trapping real cold air in the polarregions and a warm ring in low and middle latitudes.”
0 likes
Personal Forecast Disclaimer:
The posts in this forum are NOT official forecasts and should not be used as such. They are just the opinion of the poster and may or may not be backed by sound meteorological data. They are NOT endorsed by any professional institution or storm2k.org. For official information, please refer to the NHC and NWS products.
The posts in this forum are NOT official forecasts and should not be used as such. They are just the opinion of the poster and may or may not be backed by sound meteorological data. They are NOT endorsed by any professional institution or storm2k.org. For official information, please refer to the NHC and NWS products.
Re: The baffling late August-early September Atlantic shutdown of 2024
I think we need a special "season cancel" remainder of the season poll. I think I i had 20/10/5. My troll post was 2-1-0. I shoulda stuck with that!!!
2 likes
-
TomballEd
- Category 5
- Posts: 1260
- Age: 62
- Joined: Wed Aug 16, 2023 4:52 pm
- Location: Spring/Klein area, not Tomball
Re: The baffling late August-early September Atlantic shutdown of 2024
Unless they are deep intrusions of cold air with stronger than usual early season fronts, I'd think the atmosphere would cool feaster than the oceans. Something like D-MAX, but seasonal.
Euro weeklies have just below normal ACE week 3 and above normal ACE week 4. Although TS strike probabilities seem to suggest some of that will be systems out of the deep tropics.

Euro weeklies have just below normal ACE week 3 and above normal ACE week 4. Although TS strike probabilities seem to suggest some of that will be systems out of the deep tropics.
0 likes

Re: The baffling late August-early September Atlantic shutdown of 2024
TomballEd wrote:Unless they are deep intrusions of cold air with stronger than usual early season fronts, I'd think the atmosphere would cool feaster than the oceans. Something like D-MAX, but seasonal.
Euro weeklies have just below normal ACE week 3 and above normal ACE week 4. Although TS strike probabilities seem to suggest some of that will be systems out of the deep tropics.
https://charts.ecmwf.int/streaming/20240904-2000/ee/ps2png-worker-commands-b85dd8d98-88lfr-6fe5cac1a363ec1525f54343b6cc9fd8-xwcz4ar7.png
I just do not know if its reasonable to have any faith in this EURO weeklies forecast of 624 - 792 hr.'s under normal circumstances let alone given a season that defies clear explanation yet. On that same note however, I find the suggestion that October would be devoid of tropical development south of 20N very odd and interesting.
0 likes
Andy D
(For official information, please refer to the NHC and NWS products.)
(For official information, please refer to the NHC and NWS products.)
-
TomballEd
- Category 5
- Posts: 1260
- Age: 62
- Joined: Wed Aug 16, 2023 4:52 pm
- Location: Spring/Klein area, not Tomball
Re: The baffling late August-early September Atlantic shutdown of 2024
chaser1 wrote:TomballEd wrote:Unless they are deep intrusions of cold air with stronger than usual early season fronts, I'd think the atmosphere would cool feaster than the oceans. Something like D-MAX, but seasonal.
Euro weeklies have just below normal ACE week 3 and above normal ACE week 4. Although TS strike probabilities seem to suggest some of that will be systems out of the deep tropics.
https://charts.ecmwf.int/streaming/20240904-2000/ee/ps2png-worker-commands-b85dd8d98-88lfr-6fe5cac1a363ec1525f54343b6cc9fd8-xwcz4ar7.png
I just do not know if its reasonable to have any faith in this EURO weeklies forecast of 624 - 792 hr.'s under normal circumstances let alone given a season that defies clear explanation yet. On that same note however, I find the suggestion that October would be devoid of tropical development south of 20N very odd and interesting.
What said was, near normal ACE the last two weeks but probabilities showing little in the deep tropics would suggest less activity at lower latitudes. I didn't say no activity.
0 likes
-
jconsor
- Professional-Met

- Posts: 578
- Joined: Mon Jun 30, 2008 9:31 pm
- Location: Jerusalem, Israel
- Contact:
Re: The baffling late August Atlantic shutdown of 2024
Yes, there is a whole literature of papers researching the connection between solar activity and hurricanes in the Atlantic as well as in other basins.
I would recommend starting with this paper from Elsner and Jagger (2008): https://agupubs.onlinelibrary.wiley.com ... 08GL034431
They state "We speculate that over the western Atlantic including the Caribbean Sea and Gulf of Mexico where oceanic heat content is sufficiently large, the limiting thermodynamic factor for a tropical cyclone to reach its maximum potential intensity (MPI) is the outflow temperature near the tropopause (e.g. at the highest levels of the tropical troposphere, generally around 100-200 mb). Since this variable is inversely related to MPI, we note that an active sun (more sunspots) warms the lower stratosphere and upper troposphere thereby decreasing the cyclone’s potential intensity"
Elsner and Hodges have four excellent papers addressing the connection between sunspot activity and hurricanes in the Atlantic basin:
Elsner Hodges 2014 - https://www.academia.edu/download/49404 ... y4mi1c.pdf
2012 - https://onlinelibrary.wiley.com/doi/pdf ... 012/517962
2010a - http://myweb.fsu.edu/jelsner/PDF/Resear ... er2010.pdf
2010b - http://myweb.fsu.edu/jelsner/temp/PDF/R ... es2010.pdf
According to Elsner's research, there appears to be a negative correlation between sunspot activity and hurricanes in the western half of the Atlantic Basin.
Other papers worth a look include:
Pazos, Mendoza, et. al 2015 -Analysis of precursors of tropical cyclogenesis during different phases of the solar cycle and their correlation with the Dst geomagnetic index: https://ephyslab.uvigo.es/publica/docum ... P_2015.pdf
Rojo-Garibaldi et. al. 2016 - Hurricanes in the Gulf of Mexico and the Caribbean Sea and their Relationship with Sunspots: https://sci-hub.ru/10.1016/j.jastp.2009.09.012
Hutton et. al 2013 - Solar Cycle Extremes as a Seasonal Predictor of Atlantic-Basin Tropical Cyclones: https://sci-hub.ru/10.1353/sgo.2013.0007
IcyTundra wrote:LarryWx wrote:What about the current very active sunspots and a possible lag to consider as possibly one of the main factors keeping things quiet recently? Aug of 2024 had a 216, the highest mean sunspots in Aug since 1991. That means that this Aug had the highest mean for Aug of the current active era so far.
https://www.sidc.be/SILSO/DATA/SN_m_tot_V2.0.txt
Per met. Joe D’Aleo:
“We have mentioned the strong solar spike which research has shown can suppress hurricane activity.”
“One negative may be the big spike in solar in cycle 25. Most cycles have had a dual max and recent ones had the second one higher. This warms the upper atmosphere and hampers development.”
Is there any papers that discuss any potential connection between solar activity and hurricane seasons? I've seen a few people mention this as a possibility but it seems like most mets believe there is no connection. I am personally skeptical but would be interesting to hear an argument that supports it.
9 likes

Who is online
Users browsing this forum: mixedDanilo.E and 86 guests