A snippet from Michael Lowry's new update ..... patience >>>>>>>>>>
Though long-range models don’t currently show any looming threats behind soon-to-be Ernesto, the Atlantic will stay in a broadly conducive configuration for tropical development for the rest of the month.
As we’ve learned with recent storms, the forecast models struggle with detecting potential genesis until a system is closer to forming, so we look at the overall pattern to determine whether activity will persist or settle down beyond a week. There’s nothing right now to suggest a slowdown ahead, so we’ll keep close tabs on the tropical waves rolling off Africa and into the deep Atlantic as primetime hurricane season settles in.
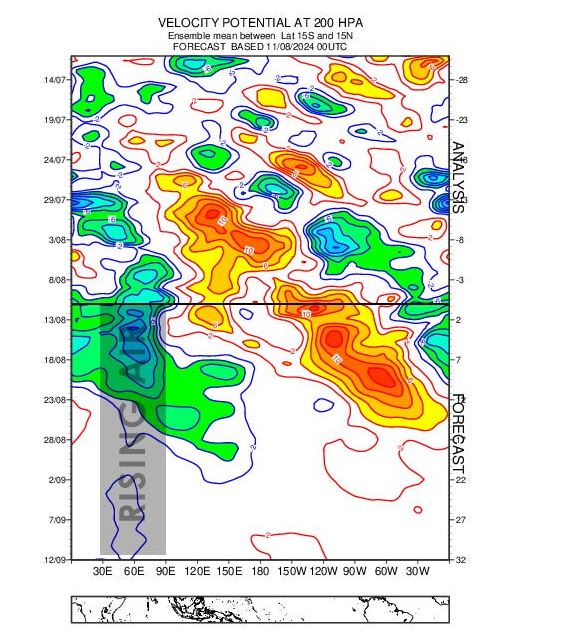
Forecast areas of abnormal rising air (cooler colors) and abnormal sinking air (warmer colors) across the global tropical band from the European forecast model ensemble system. The black line indicates today’s date and everything below the line is a forecast through middle September. The map cutout on the very bottom shows the area of the globe over which we find abnormal rising air or sinking air. When the rising air branch gets “stuck” over the north Indian Ocean and Africa as is indicated in the dark shaded box, it suggests a favorable regime for tropical development in the Atlantic. This coincides with a climatologically favored time of year for hurricane development in the Atlantic, so we don’t expect any prolonged slowdown to the activity. Credit: ECMWF