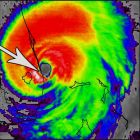
Finally got my office all set up at the new place and some time to really check out Erin and the models this morning! First thing that jumps out on satellite imagery, Erin has a vigorous circulation but is convectively limited. This can be best seen in water vapor RGB composites (and some other features I will point out):


Erin's circulation (green) is easy to spot here, and it’s also very evident convection is not able to build with much height/deepen. A healthy tropical cyclone will have deep white/fringe blue, but here we get this mixture of red in the high cloud (an indication that convection is not able to sustain vertically). There are three main negative factors that I am seeing:
1) the surrounding SSTs and OHC environment is not conducive for deep moisture generation. Water temps are close to 78F, and OHC is 0. This is essentially the minimal surface temperature that can support a system, and it really caps the available latent heat for producing deep convection.
Sea Surface Temperatures with current position:

OHC values with previous track:

2) I want to also note the environment out in front is taking A LOT of work to moisten. I’ve outlined the SAL line riding out in front (orange) in the WV RGB image above, but you can also clearly see it here in the CIMSS product:

3) Additionally, there is a mid level circulation (pink, future track in dashed pink) that has formed within the monsoonal trough, and this will begin to pivot along Erin’s flank today and then head northwest tomorrow (where models show the vorticity being stretched out and the moisture sacrificed to the SAL gods). Over the next two days though, this feature will interact with Erin's moisture envelope/profile and negatively strip some of the convective potential away.
700mb (mid-level) vorticity product showing second mid-level vort to the east of Erin:

So that is kind of what is going on currently, now I’ll transition to what the models are forecasting and note some trends. I’ll start with what the models have been showing the past 4-6 runs, and how they have been verifying. The trend so far has been for shifts to the south in the operational models, which we can analyze with the last 4 runs of the ECMWF (light blue previous runs -> dark blue current run), with verified positions marked in X from
Brian Tang's page:

Here are the last 6 runs of the GFS and CMC:


Some things to note in terms of potential land interaction, and I'll start with the islands/Caribbean here first. The models are showing another WSW motion around ~45W, and we can see in the 06z ECMWF height contours how the orientation of this ridge will lend to that motion. If Erin dips down to 16N, chances of at least some impacts to the islands greatly increases imo.

Thereafter, Erin’s speed and strength will be important factors in how far west she gets. It’s important to note that we only have ~24 hours of data so far on Erin, but in the graphic below can clearly see almost all the models have been too slow and too far north with Erin:

As Erin continues to deal with those negative conditions over the next several days, the question becomes when will Erin have the environment to produce deep convection and really strengthen? The longer that process takes to occur (and the shallower Erin remains), the more influence the low-level steering/trade winds has and the more ‘flex’ the ridge can have on driving Erin at faster forward speed.
Current steering layer for a weak tropical cyclone:

Moving on to potential impacts in the United States, I want to just focus on the main steering elements here (as models have a difficult time nailing these details down at such large lead times right now). Much of what I outlined above has compounding effects on the long-term track of Erin. This is the end of the 06z ECMWF run, and I’ve roughly outlined the ridge in red and have put a purple dash where the weakness/’recurve alley’ will be forming: