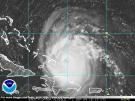
http://twitter.com/hurricanetrack/status/1425591764535156736
2021 Indicators: SST's / SAL / MSLP / Shear / Steering / Instability / Sat Images
Moderator: S2k Moderators
Forum rules

The posts in this forum are NOT official forecasts and should not be used as such. They are just the opinion of the poster and may or may not be backed by sound meteorological data. They are NOT endorsed by any professional institution or STORM2K. For official information, please refer to products from the National Hurricane Center and National Weather Service.
-
toad strangler

- S2K Supporter

- Posts: 4546
- Joined: Sun Jul 28, 2013 3:09 pm
- Location: Earth
- Contact:
-
gatorcane

- S2K Supporter
- Posts: 23708
- Age: 48
- Joined: Sun Mar 13, 2005 3:54 pm
- Location: Boca Raton, FL
Re: ATL: 2021 Indicators: SST's / SAL / MSLP / Shear / Steering / Instability / Sat Images
toad strangler wrote:BobHarlem wrote:The rise of season cancel 2021 edition?
https://twitter.com/DerekOrtt/status/1425508740363587586
Models didn't see squat last year either.
Any possibility the lack of flight data due to less airplanes in the air because of COVID was a contributing factor last year? The models were quite horrendous but last year seemed worse than usual.
2 likes
-
Category5Kaiju

- Category 5

- Posts: 4334
- Joined: Thu Dec 24, 2020 12:45 pm
- Location: Seattle and Phoenix
Re: ATL: 2021 Indicators: SST's / SAL / MSLP / Shear / Steering / Instability / Sat Images
gatorcane wrote:toad strangler wrote:BobHarlem wrote:The rise of season cancel 2021 edition?
https://twitter.com/DerekOrtt/status/1425508740363587586
Models didn't see squat last year either.
Any possibility the lack of flight data due to less airplanes in the air because of COVID was a contributing factor last year? The models were quite horrendous but last year seemed worse than usual.
Cannot remember exactly where I heard it (it actually may have been Mark Sudduth from hurricanetrack who mentioned it in one of his discussion videos that time), but yes I do remember hearing that COVID did likely contribute to less airplanes in the sky taking data for model input.
0 likes
Unless explicitly stated, all info in my posts is based on my own opinions and observations. Tropical storms and hurricanes can be extremely dangerous. Refer to an accredited weather research agency or meteorologist if you need to make serious decisions regarding an approaching storm.

Re: 2021 Indicators: SST's / SAL / MSLP / Shear / Steering / Instability / Sat Images
Looks like Kevin and Linda may have done a number on SST's in the eastern Pacific, according to this method of SST analysis anyways. If the eastern Pacific and Nino 1+2 areas are truly cooling and assuming they continue to do so for a while, this may help break down the eastern Pacific rising cell. Still think the Atlantic is being capped heavily by the eastern Pacific activity due to a copious amount of TUTT's out there right now though. The convective mardi gras over Africa courtesy of the MJO in phase 2 should lead to less dry air over the Atlantic in theory also but then again I've heard more waves push out more dry air, like we saw last year. Feel free to correct me if I am wrong though.
4 likes
-
Category5Kaiju
- Category 5
- Posts: 4334
- Joined: Thu Dec 24, 2020 12:45 pm
- Location: Seattle and Phoenix
Re: 2021 Indicators: SST's / SAL / MSLP / Shear / Steering / Instability / Sat Images
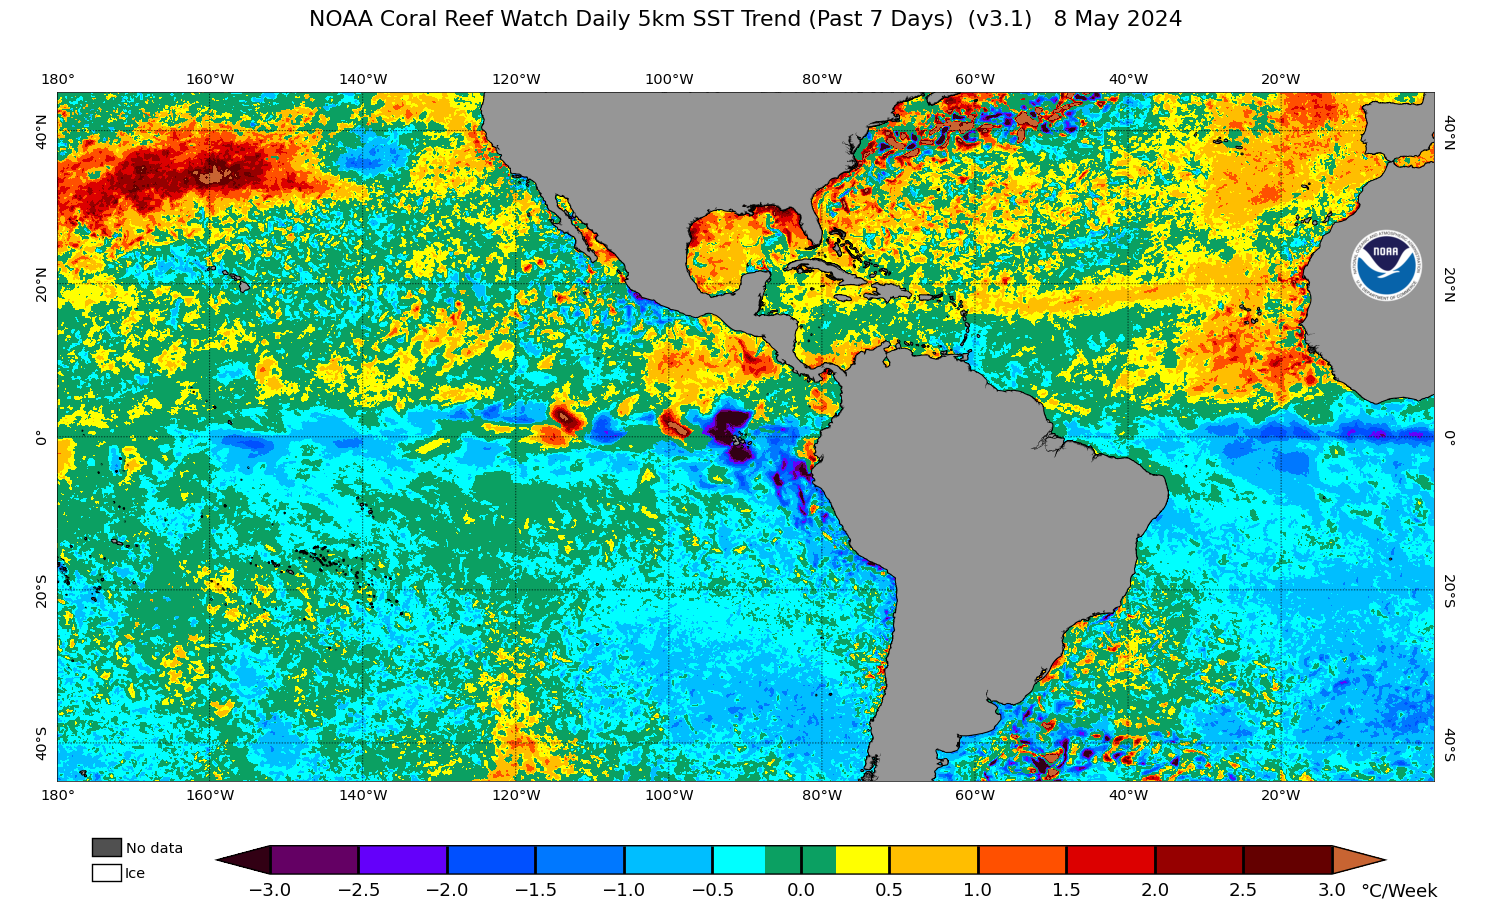
WiscoWx02 wrote:https://coralreefwatch.noaa.gov/data_current/5km/v3.1_op/daily/png/ct5km_sst-trend-7d_v3.1_west_current.png
Looks like Kevin and Linda may have done a number on SST's in the eastern Pacific, according to this method of SST analysis anyways. If the eastern Pacific and Nino 1+2 areas are truly cooling and assuming they continue to do so for a while, this may help break down the eastern Pacific rising cell. Still think the Atlantic is being capped heavily by the eastern Pacific activity due to a copious amount of TUTT's out there right now though. The convective mardi gras over Africa courtesy of the MJO in phase 2 should lead to less dry air over the Atlantic in theory also but then again I've heard more waves push out more dry air, like we saw last year. Feel free to correct me if I am wrong though.
If I recall correctly, last year's African Easterly Jet was so strong though that that advected a lot of dust from the Sahara continously, and June has a massive outbreak, with this partially to blame for the relative lack if significant MDR activity later in the season. This year's SAL outbreaks are a lot less notable, and imho 2020 was an example of the AEJ that pushes waves out being too strong to be a good thing for development.
2 likes
Unless explicitly stated, all info in my posts is based on my own opinions and observations. Tropical storms and hurricanes can be extremely dangerous. Refer to an accredited weather research agency or meteorologist if you need to make serious decisions regarding an approaching storm.
-
AxaltaRacing24
- Category 5
- Posts: 1774
- Age: 25
- Joined: Wed Jul 27, 2016 11:14 am
- Location: Jupiter, FL
Re: 2021 Indicators: SST's / SAL / MSLP / Shear / Steering / Instability / Sat Images
Category5Kaiju wrote:WiscoWx02 wrote:https://coralreefwatch.noaa.gov/data_current/5km/v3.1_op/daily/png/ct5km_sst-trend-7d_v3.1_west_current.png
Looks like Kevin and Linda may have done a number on SST's in the eastern Pacific, according to this method of SST analysis anyways. If the eastern Pacific and Nino 1+2 areas are truly cooling and assuming they continue to do so for a while, this may help break down the eastern Pacific rising cell. Still think the Atlantic is being capped heavily by the eastern Pacific activity due to a copious amount of TUTT's out there right now though. The convective mardi gras over Africa courtesy of the MJO in phase 2 should lead to less dry air over the Atlantic in theory also but then again I've heard more waves push out more dry air, like we saw last year. Feel free to correct me if I am wrong though.
If I recall correctly, last year's African Easterly Jet was so strong though that that advected a lot of dust from the Sahara continously, and June has a massive outbreak, with this partially to blame for the relative lack if significant MDR activity later in the season. This year's SAL outbreaks are a lot less notable, and imho 2020 was an example of the AEJ that pushes waves out being too strong to be a good thing for development.
Yeah. Fred running straight into the shredder at the worst angle sort of takes away how much the ATL has woken up. If it were to track north of that, we are looking at a cat 1-2 at least approaching the keys.
When it comes to the MDR, it should crank out some better storms than 2020, and some of those might threaten land if these early storms are any indicator track wise.
5 likes
-
gatorcane
- S2K Supporter
- Posts: 23708
- Age: 48
- Joined: Sun Mar 13, 2005 3:54 pm
- Location: Boca Raton, FL
Re: 2021 Indicators: SST's / SAL / MSLP / Shear / Steering / Instability / Sat Images
AxaltaRacing24 wrote:Category5Kaiju wrote:WiscoWx02 wrote:https://coralreefwatch.noaa.gov/data_current/5km/v3.1_op/daily/png/ct5km_sst-trend-7d_v3.1_west_current.png
Looks like Kevin and Linda may have done a number on SST's in the eastern Pacific, according to this method of SST analysis anyways. If the eastern Pacific and Nino 1+2 areas are truly cooling and assuming they continue to do so for a while, this may help break down the eastern Pacific rising cell. Still think the Atlantic is being capped heavily by the eastern Pacific activity due to a copious amount of TUTT's out there right now though. The convective mardi gras over Africa courtesy of the MJO in phase 2 should lead to less dry air over the Atlantic in theory also but then again I've heard more waves push out more dry air, like we saw last year. Feel free to correct me if I am wrong though.
If I recall correctly, last year's African Easterly Jet was so strong though that that advected a lot of dust from the Sahara continously, and June has a massive outbreak, with this partially to blame for the relative lack if significant MDR activity later in the season. This year's SAL outbreaks are a lot less notable, and imho 2020 was an example of the AEJ that pushes waves out being too strong to be a good thing for development.
Yeah. Fred running straight into the shredder at the worst angle sort of takes away how much the ATL has woken up. If it were to track north of that, we are looking at a cat 1-2 at least approaching the keys.
When it comes to the MDR, it should crank out some better storms than 2020, and some of those might threaten land if these early storms are any indicator track wise.
Hispaniola was only part of the problem, strong upper-level winds across the Bahamas would have been another obstacle. Not sure the Atlantic has “woken” up yet. Might take a bit longer. Step 1: EPAC needs to settle down.
3 likes
-
AxaltaRacing24
- Category 5
- Posts: 1774
- Age: 25
- Joined: Wed Jul 27, 2016 11:14 am
- Location: Jupiter, FL
Re: 2021 Indicators: SST's / SAL / MSLP / Shear / Steering / Instability / Sat Images
gatorcane wrote:AxaltaRacing24 wrote:Category5Kaiju wrote:
If I recall correctly, last year's African Easterly Jet was so strong though that that advected a lot of dust from the Sahara continously, and June has a massive outbreak, with this partially to blame for the relative lack if significant MDR activity later in the season. This year's SAL outbreaks are a lot less notable, and imho 2020 was an example of the AEJ that pushes waves out being too strong to be a good thing for development.
Yeah. Fred running straight into the shredder at the worst angle sort of takes away how much the ATL has woken up. If it were to track north of that, we are looking at a cat 1-2 at least approaching the keys.
When it comes to the MDR, it should crank out some better storms than 2020, and some of those might threaten land if these early storms are any indicator track wise.
Hispaniola was only part of the problem, strong upper-level winds across the Bahamas would have been another obstacle. Not sure the Atlantic has “woken” up yet. Might take a bit longer. Step 1: EPAC needs to settle down.
1) Based on the guidance before the DR, it would have most likely made a run at cat 1 with the expected conditions that were going to be there, and still might before it ends its time in the Gulf.
2) Of course the basin isn't truly 100% of the way there yet. It always takes the final 10 days of the month until it truly wakes up. Plus, the EPAC should most likely slow down after another storm or 2. Everything there is underperforming anyways, and there is not much expected after possibly Marty.
2 likes

Re: 2021 Indicators: SST's / SAL / MSLP / Shear / Steering / Instability / Sat Images
gatorcane wrote:AxaltaRacing24 wrote:Category5Kaiju wrote:
If I recall correctly, last year's African Easterly Jet was so strong though that that advected a lot of dust from the Sahara continously, and June has a massive outbreak, with this partially to blame for the relative lack if significant MDR activity later in the season. This year's SAL outbreaks are a lot less notable, and imho 2020 was an example of the AEJ that pushes waves out being too strong to be a good thing for development.
Yeah. Fred running straight into the shredder at the worst angle sort of takes away how much the ATL has woken up. If it were to track north of that, we are looking at a cat 1-2 at least approaching the keys.
When it comes to the MDR, it should crank out some better storms than 2020, and some of those might threaten land if these early storms are any indicator track wise.
Hispaniola was only part of the problem, strong upper-level winds across the Bahamas would have been another obstacle. Not sure the Atlantic has “woken” up yet. Might take a bit longer. Step 1: EPAC needs to settle down.
EPAC Tropical Activity, which has been below average, is not the problem for the Atlantic MDR, which has been near to above average. We are only in Aug 11th, this will be another late active season become of La Nina resurfacing.


1 likes
-
Kingarabian

- S2K Supporter
- Posts: 16366
- Joined: Sat Aug 08, 2009 3:06 am
- Location: Honolulu, Hawaii
Re: 2021 Indicators: SST's / SAL / MSLP / Shear / Steering / Instability / Sat Images
NDG wrote:gatorcane wrote:AxaltaRacing24 wrote:Yeah. Fred running straight into the shredder at the worst angle sort of takes away how much the ATL has woken up. If it were to track north of that, we are looking at a cat 1-2 at least approaching the keys.
When it comes to the MDR, it should crank out some better storms than 2020, and some of those might threaten land if these early storms are any indicator track wise.
Hispaniola was only part of the problem, strong upper-level winds across the Bahamas would have been another obstacle. Not sure the Atlantic has “woken” up yet. Might take a bit longer. Step 1: EPAC needs to settle down.
EPAC Tropical Activity, which has been below average, is not the problem for the Atlantic MDR, which has been near to above average. We are only in Aug 11th, this will be another late active season become of La Nina resurfacing.
https://i.imgur.com/eGIBqiO.gif
https://i.imgur.com/SLNT507.gif
How does this chart make any sense when compared to what's actually occurring?
The EPAC is running almost a month and a half earlier than average. Reminds me of those instability charts that hold no weight.
3 likes
RIP Kobe Bryant
Re: 2021 Indicators: SST's / SAL / MSLP / Shear / Steering / Instability / Sat Images
Kingarabian wrote:NDG wrote:gatorcane wrote:
Hispaniola was only part of the problem, strong upper-level winds across the Bahamas would have been another obstacle. Not sure the Atlantic has “woken” up yet. Might take a bit longer. Step 1: EPAC needs to settle down.
EPAC Tropical Activity, which has been below average, is not the problem for the Atlantic MDR, which has been near to above average. We are only in Aug 11th, this will be another late active season become of La Nina resurfacing.
https://i.imgur.com/eGIBqiO.gif
https://i.imgur.com/SLNT507.gif
How does this chart make any sense when compared to what's actually occurring?
The EPAC is running almost a month and a half earlier than average. Reminds me of those instability charts that hold no weight.
I knew that chart was going to rub some EPAC fans the wrong way
At best ACE has been average, the number of many storms doesn't mean anything which many have not become hurricanes, they have struggled with shear that comes out of no where. This year is clearly not a hyperactive season which seem to be the ones that affect the Atlantic Basin.
4 likes
-
Kingarabian
- S2K Supporter
- Posts: 16366
- Joined: Sat Aug 08, 2009 3:06 am
- Location: Honolulu, Hawaii
Re: 2021 Indicators: SST's / SAL / MSLP / Shear / Steering / Instability / Sat Images
NDG wrote:Kingarabian wrote:NDG wrote:
EPAC Tropical Activity, which has been below average, is not the problem for the Atlantic MDR, which has been near to above average. We are only in Aug 11th, this will be another late active season become of La Nina resurfacing.
https://i.imgur.com/eGIBqiO.gif
https://i.imgur.com/SLNT507.gif
How does this chart make any sense when compared to what's actually occurring?
The EPAC is running almost a month and a half earlier than average. Reminds me of those instability charts that hold no weight.
I knew that chart was going to rub some EPAC fans the wrong way
At best ACE has been average, the number of many storms doesn't mean anything which many have not become hurricanes, they have struggled with shear that comes out of no where. This year is clearly not a hyperactive season which seem to be the ones that affect the Atlantic Basin.
Nothing to do with being an EPAC follower or not lol. It's more likely than not that the 2021 Atlantic hurricane season will be very active. But we seen this in prior seasons, the Atlantic doesn't get going until the EPAC peaks. So as Gatorcane has pointed out, we need the EPAC to slow down before the Atlantic can take off, regardless if the storms are sheared or not. Even if it's not a hyperactive season, whenever the EPAC or Atlantic are active, the other is quiet.
viewtopic.php?p=2918467
8 likes
RIP Kobe Bryant
Re: 2021 Indicators: SST's / SAL / MSLP / Shear / Steering / Instability / Sat Images
Kingarabian wrote:NDG wrote:Kingarabian wrote:How does this chart make any sense when compared to what's actually occurring?
The EPAC is running almost a month and a half earlier than average. Reminds me of those instability charts that hold no weight.
I knew that chart was going to rub some EPAC fans the wrong way
At best ACE has been average, the number of many storms doesn't mean anything which many have not become hurricanes, they have struggled with shear that comes out of no where. This year is clearly not a hyperactive season which seem to be the ones that affect the Atlantic Basin.
Nothing to do with being an EPAC follower or not lol. It's more likely than not that the 2021 Atlantic hurricane season will be very active. But we seen this in prior seasons, the Atlantic doesn't get going until the EPAC peaks. So as Gatorcane has pointed out, we need the EPAC to slow down before the Atlantic can take off, regardless if the storms are sheared or not. Even if it's not a hyperactive season, whenever the EPAC or Atlantic are active, the other is quiet.
viewtopic.php?p=2918467
True, it does seem to work that way but not that the outflows of EPAC systems are affecting the western Atlantic currently.
0 likes

Re: 2021 Indicators: SST's / SAL / MSLP / Shear / Steering / Instability / Sat Images
We've now had Elsa and Fred take a track through the Carribean and up towards Florida. Preliminarily 95L looks to do roughly the same. Do you guys think this will be the predominant style of hurricane track for this year, or is it just a coincidence?
0 likes
-
captainbarbossa19

- Professional-Met

- Posts: 1094
- Age: 27
- Joined: Wed Aug 21, 2019 11:09 pm
- Location: Beaumont, TX
Re: 2021 Indicators: SST's / SAL / MSLP / Shear / Steering / Instability / Sat Images
The GFS is showing a ridiculous amount of shear towards the end of this month for most of the basin. I am not convinced, and since it and most other models have been hyping the EPAC every run, I am doing this to them. 
4 likes
-
EquusStorm
- Category 5
- Posts: 1649
- Age: 35
- Joined: Thu Nov 07, 2013 1:04 pm
- Location: Jasper, AL
- Contact:
Re: 2021 Indicators: SST's / SAL / MSLP / Shear / Steering / Instability / Sat Images
We're nearing the midpoint of August, so it's time to bring this up again
As a reminder of how fast things can potentially change in the Atlantic with the ridiculously fast uptick in activity we have in this basin as we near peak every year...
Here is the shear map for August 15, 2017
Here is a huge SAL outbreak on August 19, 2017
Two weeks before the costliest and biggest ACE-producing month in Atlantic history began
5 likes
Colors of lost purpose on the canvas of irrelevance
Not a meteorologist, in fact more of an idiot than anything. You should probably check with the NHC or a local NWS office for official information.
Not a meteorologist, in fact more of an idiot than anything. You should probably check with the NHC or a local NWS office for official information.
-
Category5Kaiju
- Category 5
- Posts: 4334
- Joined: Thu Dec 24, 2020 12:45 pm
- Location: Seattle and Phoenix
Re: 2021 Indicators: SST's / SAL / MSLP / Shear / Steering / Instability / Sat Images
EquusStorm wrote:We're nearing the midpoint of August, so it's time to bring this up again
As a reminder of how fast things can potentially change in the Atlantic with the ridiculously fast uptick in activity we have in this basin as we near peak every year...
Here is the shear map for August 15, 2017
Here is a huge SAL outbreak on August 19, 2017
Two weeks before the costliest and biggest ACE-producing month in Atlantic history began
You should also pull up those for 2019 and 2020, which also featured abrupt turns for the worse merely weeks after people began doubting.
4 likes
Unless explicitly stated, all info in my posts is based on my own opinions and observations. Tropical storms and hurricanes can be extremely dangerous. Refer to an accredited weather research agency or meteorologist if you need to make serious decisions regarding an approaching storm.

Re: 2021 Indicators: SST's / SAL / MSLP / Shear / Steering / Instability / Sat Images
Woofde wrote:We've now had Elsa and Fred take a track through the Carribean and up towards Florida. Preliminarily 95L looks to do roughly the same. Do you guys think this will be the predominant style of hurricane track for this year, or is it just a coincidence?
I think it might be a favored range of tracks due to the strong ridging for ASO, the active wave train, and the lower latitude of AEWs compared to last year. Any waves that develop would be less likely to recurve out into the open Atlantic, and they’ll be at a low enough latitude to pose a problem to the Caribbean and SEUS.
0 likes
Irene '11 Sandy '12 Hermine '16 5/15/2018 Derecho Fay '20 Isaias '20 Elsa '21 Henri '21 Ida '21
I am only a meteorology enthusiast who knows a decent amount about tropical cyclones. Look to the professional mets, the NHC, or your local weather office for the best information.
I am only a meteorology enthusiast who knows a decent amount about tropical cyclones. Look to the professional mets, the NHC, or your local weather office for the best information.
-
EquusStorm
- Category 5
- Posts: 1649
- Age: 35
- Joined: Thu Nov 07, 2013 1:04 pm
- Location: Jasper, AL
- Contact:
Re: 2021 Indicators: SST's / SAL / MSLP / Shear / Steering / Instability / Sat Images
Here's August 19 2019 right before Dorian, and here's August 11 2020, right before Josephine and Kyle, and the dust outbreak got even bigger before and during Marco and Laura. Dunno where to find archived shear maps but I'd bet they would show about the same.
2 likes
Colors of lost purpose on the canvas of irrelevance
Not a meteorologist, in fact more of an idiot than anything. You should probably check with the NHC or a local NWS office for official information.
Not a meteorologist, in fact more of an idiot than anything. You should probably check with the NHC or a local NWS office for official information.
-
cycloneye

- Admin

- Posts: 149505
- Age: 69
- Joined: Thu Oct 10, 2002 10:54 am
- Location: San Juan, Puerto Rico
Re: 2021 Indicators: SST's / SAL / MSLP / Shear / Steering / Instability / Sat Images
1 likes
Visit the Caribbean-Central America Weather Thread where you can find at first post web cams,radars
and observations from Caribbean basin members Click Here
and observations from Caribbean basin members Click Here
Who is online
Users browsing this forum: Ulf and 171 guests