Teban54 wrote:
Imagine if we actually get a sub-900 mb storm.

Wilma 882 mb in 2005. Those are few are far between.
Michael 919 mb just in 2018.
Tis the Caribbean season ... wait and see
Moderator: S2k Moderators


Teban54 wrote:
Imagine if we actually get a sub-900 mb storm.
Teban54 wrote:
Imagine if we actually get a sub-900 mb storm.

toad strangler wrote:I did some quick research on FL peninsula landfalls minimum CAT 1 from Caribbean genesis in October since 1850. All SOUTH of Cedar Key. Please do correct me if I missed something.
toad strangler wrote:Teban54 wrote:
Imagine if we actually get a sub-900 mb storm.
Wilma 882 mb in 2005. Those are few are far between.
Michael 919 mb just in 2018.
Tis the Caribbean season ... wait and see
toad strangler wrote:I did some quick research on FL peninsula landfalls minimum CAT 1 from Caribbean genesis in October since 1850. All SOUTH of Cedar Key. Please do correct me if I missed something.
UN 1857
UN 1865
UN 1870
UN 1873
UN 1876
UN 1880
UN 1904
UN 1906
UN 1910
UN 1921
UN 1924
UN 1944
UN 1946
UN 1947
UN 1948
KING 1950
HAZEL 1953
ISBELL 1964
GLADYS 1968
IRENE 1999
WILMA 2005
Just look at the period 1944 - 1953. SIX storms in 9 years!!!!
Then look ate the DROUGHT from 1968 through today. TWO storms in 52 years beginning in 1969. Wilma being the last SIXTEEN years ago. INCREDIBLE.
Tick tock tick tock.
abajan wrote:toad strangler wrote:Teban54 wrote:Imagine if we actually get a sub-900 mb storm.
Wilma 882 mb in 2005. Those are few are far between.
Michael 919 mb just in 2018.
Tis the Caribbean season ... wait and see
Gilbert had a minimum central pressure of 888 mb.

aspen wrote:If activity were to magically shut down after Sam and we see nothing else develop, 2021 would still be quite a season: 20/7/4 and ~135 ACE with several notable statistics.
—Two 30+ ACE systems, including Sam, which will likely finish at about 50 ACE
—Ida becoming the second 130kt Louisiana landfall in two years, as well as one of the costliest Atlantic hurricanes
—The first occurrence of two or more major hurricane landfalls by September 1st since 2005
—The earliest 5th named storm (Elsa) as well as the second-earliest 18th (Sam), 19th (Teresa), and 20th (Victor) NS.
—A storm formation rate from late August all throughout September that rivaled 2020
—The first year since 2019 or 2017 where an Atlantic storm became the top ACE maker worldwide (Sam has passed both Chanthu and Surige)
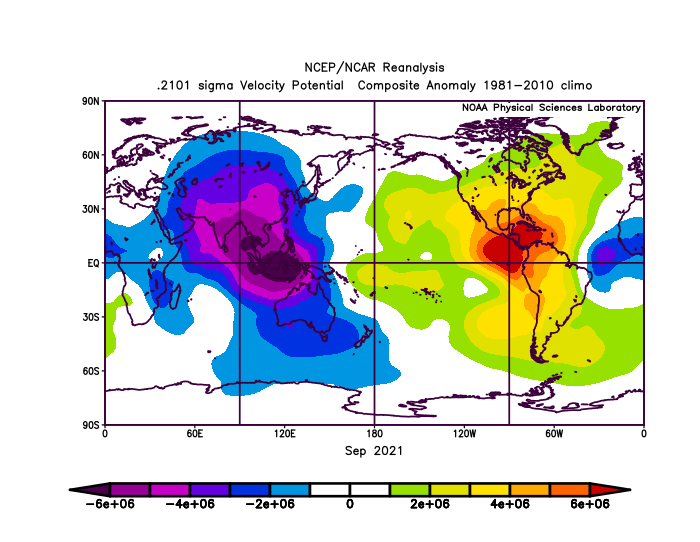
As for how various indicators held up, a bunch were pretty close. The 2020-like VP anomaly forecasts did indeed result in a near record active September as Alpha predicted, although it was an extreme mix of high and low quality with extreme quantity — two high-ACE MDR majors (Larry and Sam) with a ton of short-lived slop forming between them. Elsa’s track and the forecasts for a southward-displaced ITCZ (at least compared to last year) also verified and served as good indicators for the type of activity we would see; Grace, Larry, and Sam all formed from low-latitude waves like Elsa and all became major hurricanes, although Grace only reached that intensity once it got into the BoC. The CFS’s activity predictions for late August through the end of September also verified quite well, and while its shear forecasts were excessive as usual, there was indeed some anomalously persistent shear around mid-month.
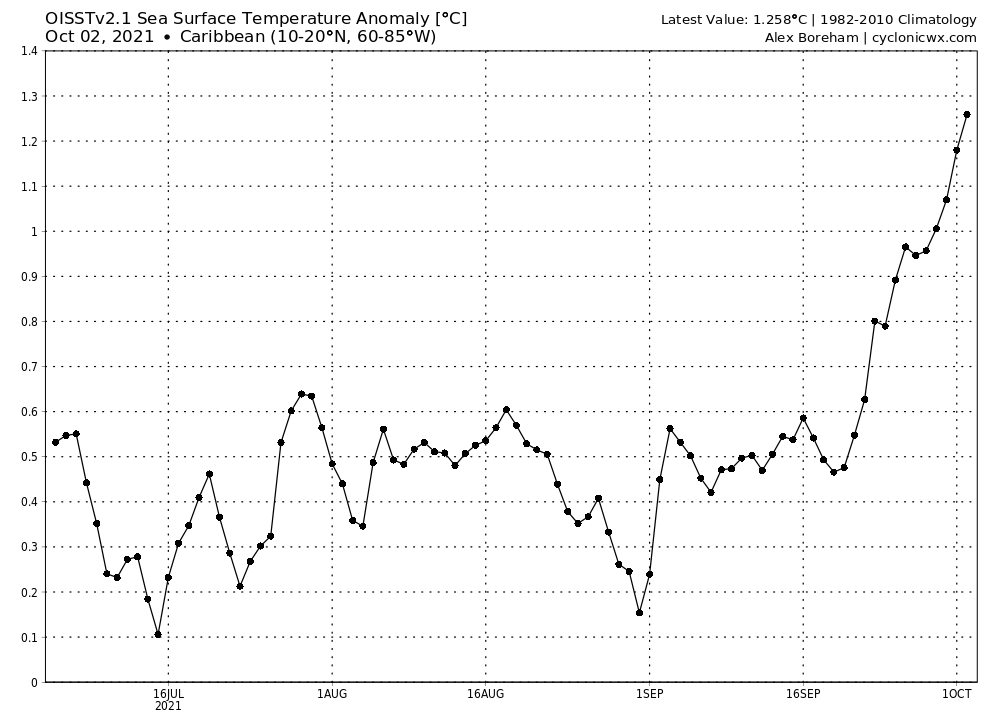
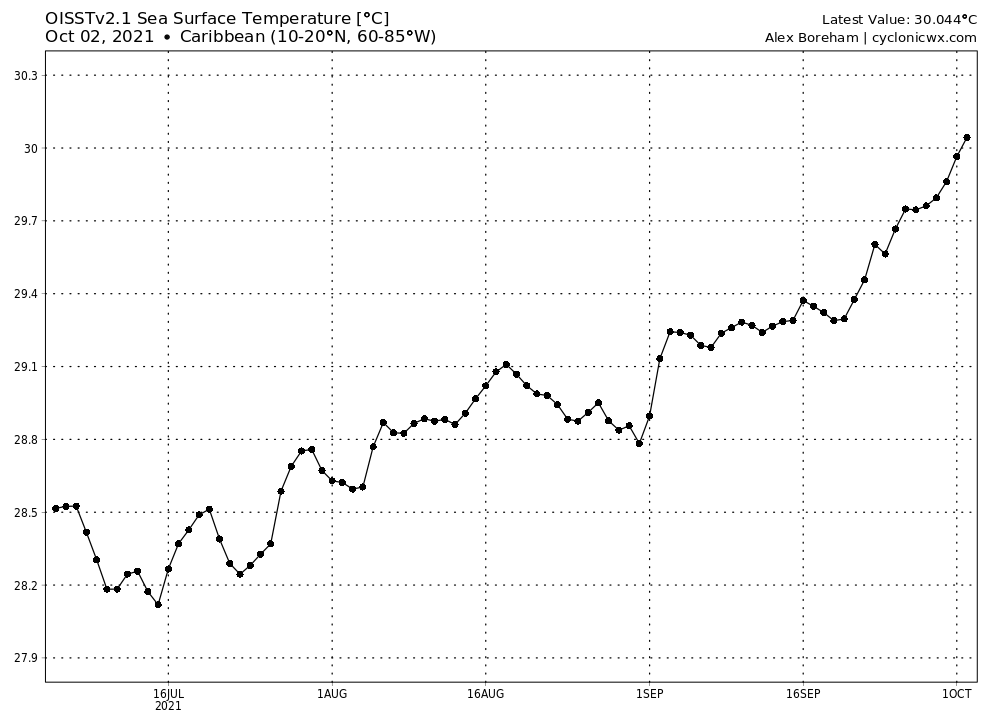
One thing that aged horribly was all the chatter about the MDR not being warm enough, and a -AMO pattern causing increased stability that would shut it down. I will admit I am guilty of contributing to some of that chatter. While several MDR storms did struggle (Kate, Peter, Rose, and Victor), the MDR in 2021 ended up being way more impressive than in 2020, with three hurricanes and two majors, including one that was likely a Cat 5. Only one system (Teddy) reached hurricane intensity in the MDR last year despite near record high SSTs, and that was due to the north displacement of the ITCZ and the massive size of AEWs that prevented rapid development, an issue that did not persist into 2021. Not only did the SST pattern-induced stability predictions age like milk, but the Atlantic did end up with a +AMO look later in the season, and now pretty much all of the tropics are running at least 0.3-0.5C above average.
Category5Kaiju wrote:aspen wrote:If activity were to magically shut down after Sam and we see nothing else develop, 2021 would still be quite a season: 20/7/4 and ~135 ACE with several notable statistics.
—Two 30+ ACE systems, including Sam, which will likely finish at about 50 ACE
—Ida becoming the second 130kt Louisiana landfall in two years, as well as one of the costliest Atlantic hurricanes
—The first occurrence of two or more major hurricane landfalls by September 1st since 2005
—The earliest 5th named storm (Elsa) as well as the second-earliest 18th (Sam), 19th (Teresa), and 20th (Victor) NS.
—A storm formation rate from late August all throughout September that rivaled 2020
—The first year since 2019 or 2017 where an Atlantic storm became the top ACE maker worldwide (Sam has passed both Chanthu and Surige)
As for how various indicators held up, a bunch were pretty close. The 2020-like VP anomaly forecasts did indeed result in a near record active September as Alpha predicted, although it was an extreme mix of high and low quality with extreme quantity — two high-ACE MDR majors (Larry and Sam) with a ton of short-lived slop forming between them. Elsa’s track and the forecasts for a southward-displaced ITCZ (at least compared to last year) also verified and served as good indicators for the type of activity we would see; Grace, Larry, and Sam all formed from low-latitude waves like Elsa and all became major hurricanes, although Grace only reached that intensity once it got into the BoC. The CFS’s activity predictions for late August through the end of September also verified quite well, and while its shear forecasts were excessive as usual, there was indeed some anomalously persistent shear around mid-month.
One thing that aged horribly was all the chatter about the MDR not being warm enough, and a -AMO pattern causing increased stability that would shut it down. I will admit I am guilty of contributing to some of that chatter. While several MDR storms did struggle (Kate, Peter, Rose, and Victor), the MDR in 2021 ended up being way more impressive than in 2020, with three hurricanes and two majors, including one that was likely a Cat 5. Only one system (Teddy) reached hurricane intensity in the MDR last year despite near record high SSTs, and that was due to the north displacement of the ITCZ and the massive size of AEWs that prevented rapid development, an issue that did not persist into 2021. Not only did the SST pattern-induced stability predictions age like milk, but the Atlantic did end up with a +AMO look later in the season, and now pretty much all of the tropics are running at least 0.3-0.5C above average.
We would end up beating 2018 and 2019 in ACE even if the season did suddenly end after Sam's dissipation. Now, to be realistic, it is very likely that we are still not done; in fact, as I have mentioned earlier, one or two more major hurricanes before season ends would not surprise me at all. I personally think there is a very real chance that if something like that occurs, 2021 will make it to the hyperactivity threshold.
AlphaToOmega wrote:Take this with a can of salt, but it is clear that is model is starting to adjust. The CFSv2 is starting to show a tropical cyclone developing north of the Bahamas around October 16, and on the same day, it shows another tropical cyclone developing east of the beforementioned one. On October 22, it shows a Cape Verde storm forming. On October 23, it shows another tropical cyclone developing in the Main Development Region. On October 25, it shows another tropical cyclone developing in the Caribbean. All of these are possible major hurricanes during October. There could be more activity than what is depicted here, for the CFSv2 is a very low-resolution model.
https://i.postimg.cc/bNbWq72w/21101600-0300.gif
https://i.postimg.cc/K82Vj0nr/21101712-0300.gif
https://i.postimg.cc/mDrL1LG4/21102212-0300.gif
https://i.postimg.cc/2S7tZnGp/21102312-0300.gif
https://i.postimg.cc/PqfRzNVC/21102612-0300.gif
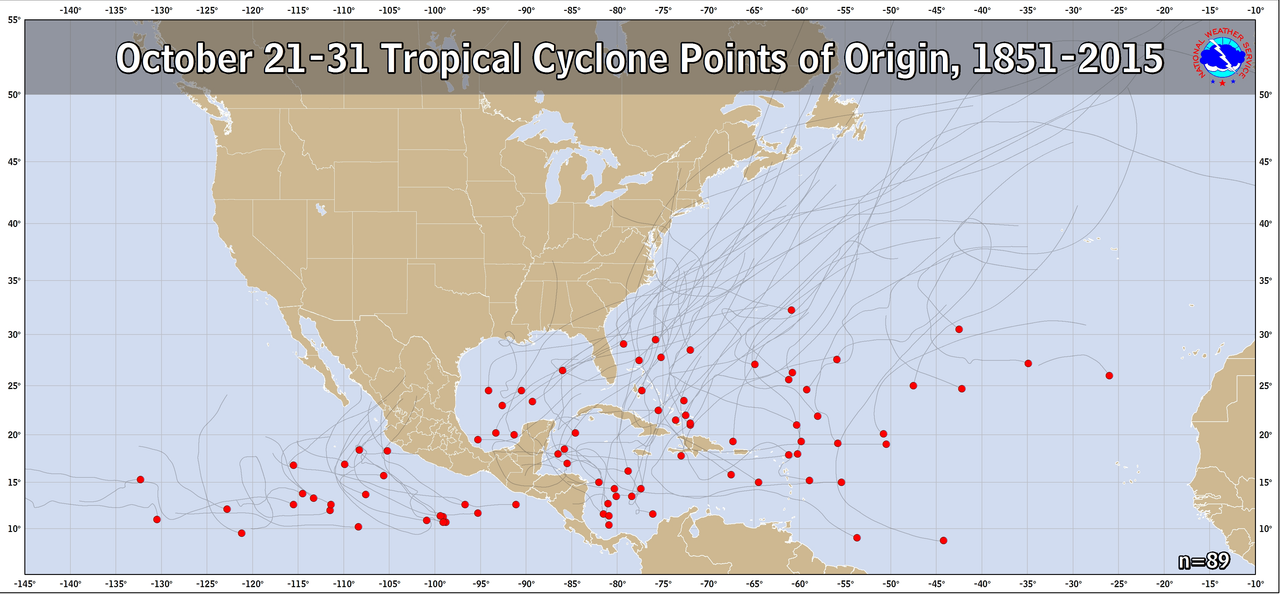
Most of this makes sense from a climatological perspective; for during the middle and later parts of October, the Caribbean, Gulf of Mexico, western Main Development Region, and subtropics should be the areas of focus. However, from 1851 to 2015, there has never been a Cape Verde storm in late October. The fact that the CFSv2 is showing Cape Verde activity in late October probably means that it needs more time to adjust.
https://i.postimg.cc/h4LstT0V/oct-21-31.png
WiscoWx02 wrote:AlphaToOmega wrote:Take this with a can of salt, but it is clear that is model is starting to adjust. The CFSv2 is starting to show a tropical cyclone developing north of the Bahamas around October 16, and on the same day, it shows another tropical cyclone developing east of the beforementioned one. On October 22, it shows a Cape Verde storm forming. On October 23, it shows another tropical cyclone developing in the Main Development Region. On October 25, it shows another tropical cyclone developing in the Caribbean. All of these are possible major hurricanes during October. There could be more activity than what is depicted here, for the CFSv2 is a very low-resolution model.
https://i.postimg.cc/bNbWq72w/21101600-0300.gif
https://i.postimg.cc/K82Vj0nr/21101712-0300.gif
https://i.postimg.cc/mDrL1LG4/21102212-0300.gif
https://i.postimg.cc/2S7tZnGp/21102312-0300.gif
https://i.postimg.cc/PqfRzNVC/21102612-0300.gif
Most of this makes sense from a climatological perspective; for during the middle and later parts of October, the Caribbean, Gulf of Mexico, western Main Development Region, and subtropics should be the areas of focus. However, from 1851 to 2015, there has never been a Cape Verde storm in late October. The fact that the CFSv2 is showing Cape Verde activity in late October probably means that it needs more time to adjust.
https://i.postimg.cc/h4LstT0V/oct-21-31.png
A Cape Verde TC is late October!? Okay to be fair though, TD 15L formed in the middle of October off the coast of Africa so it's not like it's totally outlandish. Nicholas was in the central Atlantic during the middle/end of October so definitely a MDR storm as well. The CFS adjusting gives me more faith in the idea something is going to happen though. Still taking this with 15 lbs of kosher salt as Alpha said though.
Category5Kaiju wrote:WiscoWx02 wrote:AlphaToOmega wrote:Take this with a can of salt, but it is clear that is model is starting to adjust. The CFSv2 is starting to show a tropical cyclone developing north of the Bahamas around October 16, and on the same day, it shows another tropical cyclone developing east of the beforementioned one. On October 22, it shows a Cape Verde storm forming. On October 23, it shows another tropical cyclone developing in the Main Development Region. On October 25, it shows another tropical cyclone developing in the Caribbean. All of these are possible major hurricanes during October. There could be more activity than what is depicted here, for the CFSv2 is a very low-resolution model.
https://i.postimg.cc/bNbWq72w/21101600-0300.gif
https://i.postimg.cc/K82Vj0nr/21101712-0300.gif
https://i.postimg.cc/mDrL1LG4/21102212-0300.gif
https://i.postimg.cc/2S7tZnGp/21102312-0300.gif
https://i.postimg.cc/PqfRzNVC/21102612-0300.gif
Most of this makes sense from a climatological perspective; for during the middle and later parts of October, the Caribbean, Gulf of Mexico, western Main Development Region, and subtropics should be the areas of focus. However, from 1851 to 2015, there has never been a Cape Verde storm in late October. The fact that the CFSv2 is showing Cape Verde activity in late October probably means that it needs more time to adjust.
https://i.postimg.cc/h4LstT0V/oct-21-31.png
A Cape Verde TC is late October!? Okay to be fair though, TD 15L formed in the middle of October off the coast of Africa so it's not like it's totally outlandish. Nicholas was in the central Atlantic during the middle/end of October so definitely a MDR storm as well. The CFS adjusting gives me more faith in the idea something is going to happen though. Still taking this with 15 lbs of kosher salt as Alpha said though.
Could you explain that, I am a bit confused by that part
AlphaToOmega wrote:Category5Kaiju wrote:WiscoWx02 wrote:
A Cape Verde TC is late October!? Okay to be fair though, TD 15L formed in the middle of October off the coast of Africa so it's not like it's totally outlandish. Nicholas was in the central Atlantic during the middle/end of October so definitely a MDR storm as well. The CFS adjusting gives me more faith in the idea something is going to happen though. Still taking this with 15 lbs of kosher salt as Alpha said though.
Could you explain that, I am a bit confused by that part
Probably Nicholas (2003)
Shell Mound wrote:AlphaToOmega wrote:Category5Kaiju wrote:
Could you explain that, I am a bit confused by that part
Probably Nicholas (2003)
https://twitter.com/philklotzbach/status/1049670529680953344
Users browsing this forum: Ulf and 165 guests


