South Florida decadal rainfall drops by 15 percent in 30 years
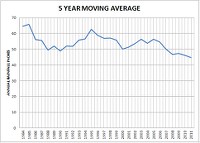
Using a 5 year moving average to smooth the rain pattern, it becomes evident that there is a decadal pattern with peaks at 1985, 1995, and 2005. The included graph clearly indicates a formation of lower highs and lower lows. At first I suspected that there was an issue with development around the rain gauge or that the site data had been corrupted by movement of the gauge, but I confirmed the trend with another gauge with a data record back to the 1980’s.
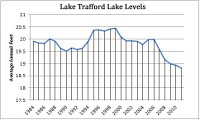
After months of tinkering with a spread sheet converting daily rainfall into monthly and yearly, I have developed my latest graph image. This graph goes back 30 years and seems to indicate that annual rainfall is dropping off at the rate of 5 percent per decade. This corresponds with my belief that the earth is entering a phase somewhat like Milankovich would expect, but on a smaller time scale. The earth is closer to the sun in the summer and further from the sun in the winter by small amounts every year. That could account for the migration of the rain pattern moving more into the winter months. It is a matter of the plasma sphere expanding in the summer creating more high pressure systems and less rainfall.
I am working on a Map that to demonstrate the local differences in the pattern. The bothersome thing is this data trend conflicts with the CPC rainfall totals that show only one decadal rainfall shortfall on the leeward side of the Rockies in Oregon. It may be the difference between radar rainfall summaries and ground truth.
Uploaded with ImageShack.us


