7 - 10 January 2006
Summary
Severe tropical cyclone Clare crossed the Pilbara coast west of Dampier at about midnight on Monday 9 January. Dampier experienced very destructive winds for a period Monday evening as the eye wall passed over the town. Karratha narrowly escaped the eye wall but still experienced destructive winds (category 2 intensity) for over seven hours and gale force winds for sixteen hours (see graph of wind speeds). Estimated maximum winds near the time of coastal impact were 140 km/h (75 knots) gusting to 195 km/h (105 knots). Highest recorded sustained winds speeds were 131 km/h (71 knots) at Legendre Island and wind gusts to 142 km/h at Karratha.
Preliminary reports indicate that communities in the path of the cyclone escaped major structural damage although many properties sustained minor damage. Downed power lines and flooding disrupted power and telecommunication to many parts of the Pilbara including Dampier and Karratha. There have been no reports of any injuries.
Many roads were cut by floodwaters including the Northwest Highway. The remains of Clare continued to move south producing heavy rain and some flooding through the Gascoyne and inland parts of the Southwest Land Division in the following days.
Fortunately the storm surge peaked as the tide was approaching low tide (at 1 am) and preliminary reports suggest the overall storm tide did not rise significantly above the highest astronomical tide. There have not been any known reports of storm surge damage.
Track and intensity
A tropical low formed north of Northern Territory and moved in a general westerly then southwesterly track roughly parallel to the coast at speeds of 20 to 25 km/h. The system was upgraded to tropical cyclone intensity at 8 pm on Saturday 7 January when it was located 250 km north of Cape Leveque or 430 km north of Broome. Clare steadily developed reaching category 3 intensity at 11 pm on the 8th while moving on a southwest track towards the Pilbara coast. Clare remained at category three intensity with a central pressure of 960 hPa and maximum wind gusts to 195 km/h when it crossed the coast. By this stage it had adopted a more south southwesterly track and had slowed to about 12 km/h. Clare weakened once making landfall passing over Pannawonica at about 8 am on the 10th. Clare was downgraded to a tropical low at 11pm on the 10th and then continued to move southwards.

Observations summary
Maximum Winds:
142 km/h (77 knots) at Karratha at 19:50 and 22:50 WST 9 January.
131 km/h (71 knots) at Roebourne at 20:40 WST 9 January
131 km/h (71 knots) Sustained winds (10 minute) at Legendre Island at 18:00 WST 9 January.
Daily Rainfall:
215 mm (8.46 in) at Wickham
212 mm (8.35 in) at Karratha
205 mm (8.07 in) at Roebourne
Note: The above information should be considered preliminary until all data is investigated and analysed.

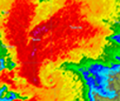
Satellite Image
The image below shows Clare as it was inland and beginning to weaken on the 10th January.

Visible image at 10:30am 10 January 2006 when centre was inland just south of Pannawonica.
Image from Terra satellite courtesy from NOAA (USA).
Flood photos
Heavy rainfall in excess of 200mm fell over near coastal parts of the central Pilbara coast. Rainffall over 100mm was widespread further inland and extended to southern parts of the State in the following days. Flooding was not as severe as during tropical cyclone Monty in 2004 but nevertheless resulted in road closures.

View of floodwaters at Yarraloola station. Image courtesy of WA FESA.

View of the the Northwest Highway cut by floodwaters. Image courtesy of WA FESA.

View of The Harding Dam Spillway. Image courtesy of WA FESA.
http://www.bom.gov.au/weather/wa/cyclon ... ndex.shtml