|
October
18, 2004
For many
areas across the country, last winter brought its fare share
of cold and snow to much of the same places that had seen it
previously in the winter of 2002-03.
New York
City
saw two back-to-back 40+ seasonal snowfall totals. One would
have to go all the way back to the winters of 1947-48 and
1948-49 to find two seasons with similar snowfall statistics.
There were exceptions to the general rule however. Places such
as
Washington DC not only saw far less snowfall last winter than
they did in 2002-03, they also recorded below average
snowfall. Baltimore received only 18.3 of snow in comparison
to their 2002-03 total of near 60; which is a one year
difference of 39 Inches!
So how
about this winter?
Early
indications are that 2004-05 may provide snowlovers with
another great delight; especially those in the eastern and
northeastern parts of the country. Our suite of global
predictors--which we look at in order to determine how the
season may evolve suggest that a cold and snowy winter may be
on tap for many areas across the nation in 2004-05. We
anticipate the onset of Weak El Nino conditions this fall,
which combined with frequent high latitude blocking, can
enhance the potential for cold and snow. Furthermore, there is
also the potential for significant snow events--even in places
which managed to evade them last year.
In this
article, we will explore the factors shaping the winter of
2004-05, and offer insight as to what they could mean for us
this winter. Unfortunately, as a result of extenuating
circumstances, and major time constraints, I will only be able
to issue one winter outlook for the 2004-05 season.
THE ANALOG
METHOD AND FORECAST RATIONALE:
Over the
past several years, the popularity of using the analog method
approach to seasonal forecasting has proven very effective.
Comparing past seasons showing significant hindcast skill with
respect to similarities in global atmospheric circulations and
patterns with those of the present allow us to better
understand how they will shape the future, assuming the
atmosphere continues behaves the same in the future as it has
in the past. Our selection of analog years will be based on
analysis of various global predictors (climate patterns and
oscillations)
The final
component of this forecast is the output from numerical
Climate Models.
A brief
description of each factor will be offered in order to give
everyone a general idea of what the feature is, and how its
current or expected behavior will influence the 2004-05
winter.
WINTER 2004-05 FORECAST:
Pattern
Overview:

Temperatures:

Snowfall:

2004-05
Winter forecast:
Above
normal temperatures are forecasted over the western Half of
the nation where persistent ridging should be favored through
much of the winter consistent with a mostly positive PNA
pattern and Below average temperatures are anticipated across
the southern plains ands and eastern United States. A mostly
negative NAO should ensure the mean trough position will be
located over this region.
El
Nino-west QBO winters are notorious for above average snowfall
across the eastern Portions of the United States especially in
years where those conditions coincide with a neutral to
negative NAO. I anticipate an active sub-tropical jet stream
which will result in above average precipitation over the
southern and eastern portions of the nation. Further to the
north, this should also translate to above normal snowfall.
The analog
years suggest the core of the above average snowfall will be
found over the interior portions of the northeastern half of
the nation. A Significant ice storm threat also exists over
the
Carolinas.
Below average snowfall is likely across the intermountain west
and western high plains which is normal for El Nino-west QBO
winters.
Below are
the expected snowfall totals for the Major Cities of the Mid
Atlantic and Northeast:
Washington, DC: 15-25
Baltimore, MD: 25-30
Philadelphia, PA: 30-35
New York City, NY: 30-40
Boston, MA: 55-65
Above
average snowfall is anticipated for the major Cities of the
Northeast in 2004-05.
Blockbuster east coast Snowstorms:
Research has shown that Major east coast snowstorms occur most
frequently with Weak El Nino conditions in place in the
equatorial pacific, and a tendency for a negative NAO. Such
conditions are likely to be achieved this year, and I do
anticipate at least one Major east coast snowstorm with
widespread 10 or greater snowfall totals.
The NESIS
scale (Northeast Snowstorm Impact Scale) developed by Paul
Kocin, and Louis Uccellini attempts to rank east coast
snowstorms according to various parameters. A presentation on
this was given at the
19th
Conference on weather Analysis and Forecasting/15th Conference
on Numerical Weather Prediction. A link to the
abstract can be found below:
http://ams.confex.com/ams/SLS_WAF_NWP/19WAF_15NWP/abstracts/47837.htm
A majority
of the Major east coast snowstorms which occurred in our
analog years have had NESIS categories of 2 to 4.
The link
below provides a listing of those storms, NESIS rankings and
their respective categories:
http://www.storm2k.org/phpbb2/viewtopic.php?t=49860
That said
I anticipate one to two high-impact major east coast snow
events during the coming winter.
Forecasts
of Teleconnection Indices (DEC-FEB average):
PNA: +0.1 to +0.5
NAO: -0.3 to -0.5
EPO: +0.1 to -0.2
TECHNICAL INFORMATION SECTION:
1.
2004
Hurricane Season-to-date
2.
El Nino
returns in time for winter
3.
East
Pacific Signal
4.
Northern
hemispheric Snow Cover
5.
Summer
2004
6.
QBO
7.
SOI / MEI
8.
Climate
Models
9.
Other
Issues
10.
Crucial
Assumptions
2004 Hurricane Season-to-date
The 2004
hurricane season has emerged as on of the most active seasons
on record since 1950. As of the present time, a total of 14
Named storms, 8 Hurricanes, and 6 intense hurricanes of
category three intensity or stronger have formed in the
Atlantic basin.
http://www.weather.unisys.com/hurricane/atlantic/2004/

Using the
link provided above (courtesy of UNISYS weather) we can see
that the majority of the intense and noteworthy tropical
cyclones which formed in the Atlantic basin have developed
east of the Windward islands and taken long westward tracks
before re-curving. These tropical cyclones include Charley,
Frances, Ivan and Jeanne.
http://www.weather.unisys.com/hurricane/atlantic/2004/CHARLEY/track.gif
http://www.weather.unisys.com/hurricane/atlantic/2004/FRANCES/track.gif
http://www.weather.unisys.com/hurricane/atlantic/2004/IVAN/track.gif
http://www.weather.unisys.com/hurricane/atlantic/2004/JEANNE/track.gif
Three of
These SystemsCharley,
Frances,
and Jeanne made landfall along the Florida coastline.
Hurricane Ivan (which was at maximum intensity a category Five
Hurricane) had the most Intense Hurricane days of any
hurricane sine 1900; a total of 10 Intense hurricanes Days.
Hurricane
Frances,
which Reached category four strength, had a total of 7.5
intense hurricane days. Frances however weakened near the
Bahamas and eventually made landfall as a category two
hurricane near Swells point, Florida on September 5 causing
Almost Eight Billion dollars in damage to the state. The storm
was also responsible for as many as 24 related fatalities.
2004 was
an active Cape
Verde
season with eight of the Fourteen Named storms this year
developing in this region of the tropical Atlantic between the
west coast of Africa and the Windward Islands. This is typical
for the Atlantic basin since a large number of the tropical
cyclones which form in the August-September period develop in
the Atlantic Inter-tropical Convergence Zone (ITCZ) where the
Flow around the Sub-tropical ridges present in the northern
and southern hemisphere provide a zone for enhanced
convergence and corresponding increased low-level relative
vorticity. What makes 2004 unique?
1.
The number of tropical cyclones taking long westward tracks
toward the US Mainland and only a few systems re-curving out
to sea east of 65 degrees west longitude.
2.
Excessive number of intense Hurricanes.
3.
Three total hurricanes (one category two, one category three,
and one category four Hurricane) making landfall along the
Florida
Coastline.
The reason
for the long westward tracking tropical cyclones and few
re-curvatures this year in comparison to the last eight
seasons (since 1995) centers around the positioning of the
western Atlantic ridge between 30 and 50 degrees north
Atlantic over the Northwest Atlantic and Enhanced Bermuda high
which forced tropical cyclones such as Frances, and Ivan to
take long westward tracks toward the united states mainland as
a result of the enhanced easterly flow equatorward of the
ridge.
An
excessive number of six intense hurricanes have formed in 2004
thus far. It is likely that the combined effect of well above
normal SSTA over the Atlantic basin, intense low-level
convergence and relative vorticity in the ITCZ, and Weak
environmental vertical shear. It is also possible that the
resultant effects of the west phase of the QBO (Quasi-Biennial
Oscillationa factor known for enhancing Atlantic basin
tropical cyclone activity) may have played a key role in the
above average activity. It should be noted that it is also
very unusual to have such conditions simultaneously in place
for an extended period of time during an El Nino season such
as this.
So how
does this effect the 2004-05 winter?
In
choosing hurricane analogs, it is important to choose seasons
which have similar upper air patterns, storm tracks, and
landfall statistics. This year, the predominant upper air
pattern across the western
Atlantic
and
North
America
has been one where a persistent trough was observed over the
western half of
North
America
during the most active portion of the hurricane season, and a
ridge over the northwest
Atlantic.
As far as storm tracks are concerned, they should conform to
the observed upper level pattern. The aforementioned synoptic
set-up would generally favor longwestward tracking tropical
cyclones which affect the United States, potentially lending
to an above average number of land falling hurricanes and
intense hurricanes, as well as fewer re-curving tropical
cyclones.
Usually in
El Nino seasons such as this, east pacific tropical cyclone
activity is above normal, and Atlantic activity is suppressed.
2004 however, saw fewer East pacific tropical cyclones than
the
Atlantic,
even in spite of the El Nino.
http://www.weather.unisys.com/hurricane/e_pacific/2004/
Other
Similar seasons Include: 1963, 1965, and 1969.
http://www.weather.unisys.com/hurricane/e_pacific/1963/
http://www.weather.unisys.com/hurricane/e_pacific/1965/
http://www.weather.unisys.com/hurricane/e_pacific/1969/
This leads
me to believe that the State of the large-scale circulations I
the Atlantic and Pacific basins are similar to what they were
during the decade of the 1960s, and the effects of the El Nino
conditions in the Equatorial Pacific have been overshadowed.
In all three of the aforementioned cases, the following
winters featured frequent and persistent high latitude
blocking over the Pole and North Atlantic in addition to
toughing over the eastern half of the United States.

The
abovementioned statistics pertaining to the current hurricane
season would indicate a propensity for a frequently negative
NAO in the December to February period, and persistent
toughing over the eastern half of the United States during the
same timeframewhich when combined with the Weak El Nino would
suggest below normal temperatures and above average Snowfall
along the eastern Seaboard.
El Nino Returns In Time for winter
Perhaps
the most important component in any seasonal forecast is the
predicted state of the ENSO. El Nino and La Nina events can be
the primary factors which shape the dominating upper level
pattern in all seasons. In winter, however, these climate
features are especially important.
El Nino
events are characterized by an anomalous warming of Sea
Surface temperatures over the Equatorial pacific lasting on
average 7 to 12 months. It should be noted though that some
events will last longer or shorter than others depending on
other large scale features such as the PDO cycle. Normally El
Nino events in the PDO long-term warm phase will persist
longer, and tend to be far stronger than their counterparts
which occur in the PDO long-term cold phase. Some
characteristics of El Nino events include:
·
A frequently positive PNA Pattern
·
The depth of the equatorial thermocline is closer to the ocean
surface
·
Weak or Absent walker Circulation.
·
Negative SOI and Positive MEI values
·
Negative Eastern Pacific Oscillation
·
Warmer than average SSTA over the Equatorial pacific
·
Enhanced Convection over the tropical Pacific.
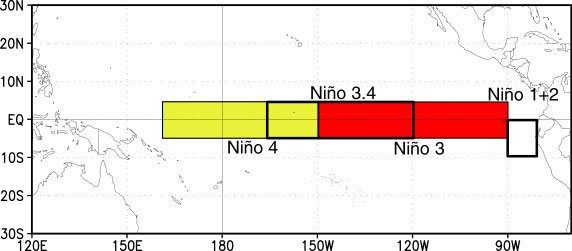
La Nina is
characterized by the opposite, where an anomalous cooling of
Sea Surface temperatures (SSTs) occurs over the equatorial
Pacific. In order to make the analysis and forecasting of Warm
and Cold ENSO episodes more efficient, the equatorial pacific
is split up into specific regions. These regions are the ENSO
1+2 region closest to the South American coast (10S EQ /
90W), NINO region 3.0 (5S 5N / 90-150W), NINO region 4.0
(150W - ~160E), and NINO region 3.4 which combines the western
portions of the 4.0 region and eastern portions of the 3.0
region. Click the link before for a graphical representation
of these regions:
http://www.cpc.ncep.noaa.gov/products/analysis_monitoring/ensostuff/ninoareas_c.jpg
It is the NINO 3.4 region which is most important region to
look at when anticipating El Nino formation. For La Nina
episodes, the 1+2 region is most important.
During the
course of September 2004, ENSO region 3.4 and 4.0 SST
anomalies continued to warm with region 4.0 anomalies reaching
+1.12 degrees Celsius. This is the highest Monthly NINO 4.0
anomaly value observed since December 2002, and most certainly
indicative of an intensifying Equatorial Pacific warm episode.
|
September |
NINO 1+2
|
NINO 3.0 |
NINO 3.4 |
NINO 3.4 |
|
2004 |
-0.43
|
+0.32 |
+1.12 |
+0.83 |
In the
table above, we Notice a distinct split in the SSTA over the
equatorial pacific, with an anomalously cool east, and warm
west.
http://www.cdc.noaa.gov/map/images/sst/sst.anom.month.gif
Other
years with similar statistics include 1977, 1986, 1990, 1994,
2002, and 2003.
|
September |
NINO 1+2 |
NINO 3.0 |
NINO 4.0 |
NINO 3.4 |
|
1977 |
-0.61 |
-0.13 |
+0.47 |
+0.32 |
|
1986 |
0.00
|
+0.42 |
+0.70
|
+0.69 |
|
1990 |
-0.31
|
+0.02 |
+0.55
|
+0.11 |
|
1994 |
-0.28
|
-0.02 |
+0.75
|
+0.36 |
|
2002 |
-0.60
|
+0.70
|
+0.96
|
+1.19 |
|
2003 |
-0.48
|
+0.14 |
+0.54
|
+0.32 |
A majority
of the winters above had the core of the warm SST anomaly
associated with the El Nino centered across the central and
western pacific in the NINO 3.4 and 4.0 regions. The figure
below shows (December-February) 500mb Height in winters with a
warm west and cold east.

In the majority of winters where a warmer than normal west and
colder than normal eastern Equatorial pacific is observed,
strong high latitude blocking over the northwest Atlantic (a
negative NAO) and below normal heights are observed over the
eastern US.
The next
thing we like to look for is how SSTs have trended over the
past three eleven months. There have been a total of 12
seasons which saw similar conditions to the past eleven months
with respect to the ENSO signal. For our purposes here, we
will be using the three-month running mean ONI (oceanic NINO
index) values since the November-December-January period of
2003-04 up to the present.
The ONI
uses three-month running mean of NOAA
ERSST.v2 SSTA in the NINO 3.4
region based on 1971-2000 normals.
El Nino conditions per ONI values are achieved when the
threshold of SSTA greater than +0.5 Degrees Celsius is met for
at least five consecutive three-month periods.
The links below provide more information on the ONI
http://www.cpc.ncep.noaa.gov/products/analysis_monitoring/ensostuff/ensoyears.html
http://www.cdc.noaa.gov/Correlation/oni.data
Other
similar eleven moth periods have occurred in the winter,
spring and summer of
1951-52,
1952-53, 1962-63, 1969-70, 1976-77, 1978-79, 1979-80, 1981-82,
1989-90, 1990-91, 1993-94, 2001-02
1951-52 is
excluded since no El Nino developed following the spring and
summer. the same can be said for 1952-53, which remained
neutral then trended toward La Nina. 1962-63 can be considered
a match. 1969-70 cannot be used since the following winter was
a la Nina winter. 1979-80 is out since 1980-81 saw Weak cool
conditions. 1981-82 would be a good match however the El Nino
that developed was one of the two strongest events of the past
50 years. THIS EL NINO
WILL NOT BE AS STRONG AS THE 1982-83 El NINO.
This
leaves us winter winters of:
1962-63 ------> 1963-64
1976-77 ------> 1977-78
1978-79 ------> 1979-80
1989-90 ------> 1990-91
1990-91 ------> 1991-92
1993-94 ------> 1994-95
2001-02 ------> 2002-03
Many of
the seasons above saw El Nino conditions peak during the early
winter or very late fall and decline rapidly thereafter. This
could imply that the 2004-05 El Nino may decline rapidly as
well after reaching its peak.

Above are
500mb heights in the aforesaid winters. Note blocking over
western Canada and a strong Aleutian low.
The
forecast will reflect a weak to borderline moderate warm
episode which peaks during the early winter and steadily
declines during the later half of the season.
East Pacific Signal
El Nino
events normally point toward a negative Eastern Pacific
Oscillation in winter. The EPO reflects a tripole of height
anomalies, with those of similar sign located over the east
central Pacific and Eastern Canada (centered near Hudson Bay),
and an area of dissimilar height anomalies centered over
Northwestern Canada, Alaska, and the extreme northeast
pacific.
http://www.cdc.noaa.gov/people/gary.bates/tele/epo.cmp.gif
The
positive phase of the EPO reflects a dipole of higher than
average heights over the East central pacific and Eastern
Canada, with an area of below normal heights covering the
Northeast pacific, Alaska and Northwestern Canada.
Equally
important to determining the favored phase of the eastern
pacific oscillation in winter is the evolution of SST
anomalies over the north pacific, and the short-term
variations in the PDO (pacific Decadal oscillation) index. In
winters with a positive EPO, cool SSTA are located in the Gulf
of Alaska with above average SSTA northwest of Hawaii. This
leads to the development of a negative height anomaly near the
west coast of North America and an intensification of the
Pacific Jet. We will use October-December 2001 as an example:
SSTA
http://www.osdpd.noaa.gov/PSB/EPS/SST/data/anomnight.10.29.2001.gif
http://www.osdpd.noaa.gov/PSB/EPS/SST/data/anomnight.11.13.2001.gif
http://www.osdpd.noaa.gov/PSB/EPS/SST/data/anomnight.12.11.2001.gif

A negative
EPO represents the opposite. Above average heights are found
over Northwest North America with below average heights over
Eastern Canada, and the east central Pacific. The flowing is
associated with a negative EPO:
·
Suppressed pacific Jet
·
Split flow and rex-blocking set-up across the eastern pacific.
·
Strong Polar vortex near
Hudson Bay
·
Below average heights and temperatures over eastern North
America
The SSTA
configuration associated with a positive EPO is reversed,
where warmer than average SSTA are found in the
Gulf of
Alaska,
and cold SSTA are found Northwest of Hawaii. This is most
frequently achieved in El Nino winters during the PDO warm
phase. An example of this would be 1986, 1993, and 2002.
http://www.longpaddock.qld.gov.au/SeasonalClimateOutlook/SeaSurfaceTemperature/1986/Oct.gif
http://www.longpaddock.qld.gov.au/SeasonalClimateOutlook/SeaSurfaceTemperature/1993/Oct.gif
http://www.longpaddock.qld.gov.au/SeasonalClimateOutlook/SeaSurfaceTemperature/2002/Oct.gif

Other factors such as above average geomagnetic activity
during and immediately following the solar maximum may result
in a positive EPO even in spite of otherwise favorable SSTA
and ENSO conditions due to the propensity for a weaker than
average Aleutian low during the cold season.
As for
this year, the ongoing El Nino conditions would imply a
negative EPO, but the current SSTA configuration and trend
since the summer is not as clearly defined as it was in the
aforementioned years to sell me on the idea of a mostly
negative EPO this winter. The years with similar
September-October SSTA configurations across the North pacific
were 1961, 1962, 1963, 1964, 1968, 1977, and 1990.
|
Winter |
ENSO |
EPO-DEC |
PDO-DEC |
EPO-JAN |
PDO-JAN |
EPO-FEB |
PDO-FEB |
|
1961-62 |
Neutral |
0.6 |
-2.69
|
0.3 |
-1.29 |
-1.5 |
-1.15 |
|
1962-63 |
Neutral |
-1.1 |
-0.96 |
-0.2 |
-0.33 |
0.0 |
-0.16 |
|
1964-65 |
La Nina |
0.6
|
-1.52
|
0.2 |
-1.24 |
0.1 |
-1.16 |
|
1968-69 |
El Nino |
-0.6
|
-1.27 |
-1.9 |
-1.26 |
0.8 |
-0.95 |
|
1977-78 |
El Nino |
-1.7
|
-0.69
|
-0.9 |
0.34 |
-0.5 |
1.45 |
|
1990-91 |
El Nino |
-0.8
|
-2.23 |
-0.7 |
-2.02 |
-0.2 |
-1.19 |
Given the
information gathered, I expect the EPO to display quite a bit
of variability, with strong positive and negative periods
throughout the winter, however once all the numbers are in, I
expect the EPO to in the end average neutral to slightly
negativein touch with El Nino conditions, and the SSTA
analog years.
Northern hemispheric Snowcover
The
spatial extent of northern hemispheric snowcover during the
autumn is critical in the production of arctic air masses, and
can also give us clues as to the state of the NAO and AO
during the following winter.
Above
average snowcover during this period would be a positive when
looking for a predisposition toward colder than average
conditions over a given portion of North America, whereas
below average snowcover can signal that the development and
sustainability of arctic air masses will be in question.
Furthermore, above average snowcover may signal a tendency for
a negative Arctic oscillation (AO) during the winter, since
the snowcover favors the intensification of the Siberian high,
and may also correspondingly signal a negative NAO during the
following winter.
There have
been exceptions thoughi.e. years where snowcover averaged
well above normal during the fall and early winter, only to
see warmer than normal conditions over the lower 48 states.
Similarly, there have been several seasons with below average
snowcover during this critical time period, however the
following winters ended up seeing much below normal
temperatures over portions of the United States. This is risky
correlation, and more research needs to be conducted before
additional forecast weight can be given to this factor as a
viable predictor.
In any
event, August 2004 snowcover averaged below normalabout 2.1
million square kilometers. The average is 3.3 Million Square
Kilometers. The text value for September is not out yet,
however judging by the graphics, In my opinion, the September
value is most likely four or five million square
Kilometersalso slightly below the average.
ftp://ftp.ncep.noaa.gov/pub/cpc/wd52dg/snow/snw_cvr_area/NH_AREA
Based on
this information, if October and November 2004 northern
hemisphere snowcover extent is also below average, we might
expect the following:
·
The buildup of arctic air masses will be slower and less cold
air will be available.
·
Arctic Intrusions will be transient and less sustainable.
·
Positive AO
·
Positive NAO
In the
event things turn around during the next two months, then it
is possible this factor will also favor cold and snow as
several others we have already looked at do. I urge everyone
to monitor daily changes in snowcover extent and be aware of
trends in the data over the next two months.
Summer 2004
Recent
research has shown that the summer and fall patters leading up
to a given winter can provide as a window into what that
winter may be like.

The summer
of 2004 was cooler than average in the central and eastern US
and wetter than normal over the southern and eastern half of
the nation which is pretty typical of an El Nino summer.

The wetter
than average conditions along the east coast are indicative of
a propensity for increased extratropical cyclogenesis along
the east coast during the following winter if the pattern
holds.
Through
the month of September we saw several landfalling hurricanes
which brought significant precipitation to the eastern half of
the nation.
http://www.cpc.ncep.noaa.gov/CWI_images/mtd-precip.gif
This is a
powerful signal for above average precipitation during the
following winter along the east coast.
The past
week has seen the development of the first major extratropical
cyclone of the coming winter, with a major phasing event over
the eastern part of the nation. Below is the 48hr ECMWF
forecast from 12z October 13. Note the Split flow over the
eastern pacific which is common during El Nino-west QBO
winters, and the deep-high amplitude trough over the eastern
US.

This may
also serve as an indicator of things to come. Years where
major deepening extra-tropical cyclones are seen during the
fall, typically are analogous to similar events later on in
the season.
The summer
and early fall patterns clearly favor above normal
precipitation and colder than normal temperatures over the
eastern part of the nation during the 2004-05 winter, in
addition to an above average potential for major
extra-tropical cyclogenesis along the eastern seaboard.
QBO (Quasi-Biennial Oscillation)
The QBO is
a very well known periodic oscillation in the upper levels of
the atmosphere over the equatorial regions. The QBO represents
a band of zonally symmetric easterly and westerly winds which
alternate regularly in periods of one to two years (20-30
months on average) with an amplitude of generally 40 to 50 m/s
maximized near 20hPa (Note: hecto Pascals (hPa) and
Millibars (mb) are equivalent units). Easterly QBO phases
tend to be stronger and persist longer than westerly phases.
Plumb 1984
developed a theory explaining the QBO in which Kelvin waves
provide westerly momentum and increase the westerly shear zone
resulting in the weakening of the Kelvin wave and allowing the
mixed rossby gravity wave to propagate vertically upward more
efficiently (associated with the onset of the westerly QBO
phase). The mixed rossby wave then provides the easterly
momentum upward increasing the easterly shear zonewhich when
strongthe mixed rossby gravity wave weakens and allows the
Kelvin wave to propagate upward (inducing the onset of the
easterly phase). The cycle starts over again.
This year,
the QBO is currently in the westerly phase. The peak of this
particular cycle occurred in May 2004, three months after
reversing from east to west.
|
2004 |
-4.84 |
2.61 |
5.45 |
10.46 |
12.97 |
11.75 |
9.96 |
8.82 |
7.22 |
It is
fairly likely that the QBO will remain positive though the
remainder of 2004 and into January 2005 at a weak value. Below
are years in which met this criteria for the October-December
period: 1955 1963 1964 1969 1973 1977 1978 1994 1997 2001
Data for those years can be found by clicking the link below:
http://www.cdc.noaa.gov/correlation/qbo.data
Note that the data from the early and mid 1950s win which the
QBO appeared to be engaged in a long-term weak easterly cycle
should be viewed as unreliable due to the lack of dependable data.
Research
has also shown that years where the QBO is weak westerly or
easterly through the majority of a given winter, that winter
tends to be a significant one across the central and eastern
US. Such years include:
1957-58,
1961-62, 1963-64, 1977-78, 1988-89, 1993-94, 1995-96, 1999-00,
2001-02, 2002-03.
There are
a few exceptions such as 1988-89, 1999-00 (although that
winter did have the Carolina Crusher noreaster), and
2001-02. The others, especially 1977-78 and 1993-94 and
1995-96 tended to be among the most severe in the list.
The
aforementioned years would serve as viable QBO analogs,
however because I anticipate the QBO to transition to the
easterly phase in January or February, and as the forecast is
geared to reflect, we must look for seasons in which the QBO
switches phases at some point during the DJF period.
Now, when
we combine the effects of El Nino and the westerly phase of
the QBO, the results are astounding. The years which qualify
are 1957-58, 1963-64, 1977-78, and 1994-95. Below are
composite 500mb heights in those years:

Strong high latitude blocking is seen over the North Atlantic
which extended all the way back to the west into Canada with
well below normal heights over the eastern half of the United
States.
If the QBO once again increases westerly (i.e. a secondary
peak) a majority of the aforementioned winters would once
again come back onto the table with respect to being analogs
for this particular feature. It may also signal a much
increased chance for a severe winter in the I-95 corridor of
the Mid Atlantic and Northeast.
El
Nino-West QBO conditions also tend to favor rapidly-deepening
extratropical cyclones, loaded with moisturewhich given
sustainable cold air can lead to significant snow events along
the eastern seaboard.
Southern Oscillation Index (SOI) and MEI
The SOI
represents a measure of large scale fluctuations in air
pressure over the equatorial pacific based from the
differences in air pressure between Tahiti and Darwin,
Australia. The SOI operates in two primary modes which can be
used by forecasters to determine the state of the ENSO and
corresponding to observed SST anomalies over the region (for
example is there an El Nino or La Nina event present).
The first
primary mode of activity is the SOI negative phase. During
periods where the SOI is negative, Sea Level Pressure (SLP) is
below normal at Tahiti and above normal At Darwin, Australia.
Long term negative periods correspond to above average SSTs
over the Equatorial pacific and El Nino conditions. The
positive phase represents the opposite of the aforesaid, and
coincides with below average SSTs and La Nina conditions.
Below is a Link to more background information on the SOI for
those who wish to dig deeper:
http://www.bom.gov.au/climate/glossary/soi.shtml
Our goal
here is to take a look at the SOI values over the past eleven
monthsfrom November 2003 through September 2004. This will
allow us to isolate trends in the data and hopefully serve as
a means to determine the intensity of the upcoming El Nino.
The 2003-04 values are illustrated in the table below:
|
2003 |
-3.4 |
9.8 |
2004 |
-11.6 |
8.6 |
0.2 |
-15.4 |
13.1 |
-14.4 |
-6.9 |
-7.6 |
-2.8 |
Going
through the table, (http://www.bom.gov.au/climate/current/soihtm1.shtml)
we can determine that the following years were at least a
close match: 1951-52, 1958-59 1962-63, 1964-65, 1968-69,
1971-72, 1975-76, 1976-77, 1978-79, 1981-82, 1986-87, 1990-91,
1992-93, 1993-94, 1996-97.
Remember that the potential
analog winter is the winter following the years above.
Some years
will have to be eliminated since the following season does not
match the current SSTA profiles. Those years include 1951-52,
1958-59, 1971-72, 1981-82, 1992-93, and 1996-97. This leaves
us with:
1962-63 leading to 1963-64
1964-65 leading to 1965-66
1968-69 leading to 1969-70
1975-76 leading to 1976-77
1976-77 leading to 1977-78
1978-79 leading to 1979-80
1986-87 leading to 1987-88
1990-91 leading to 1991-92
1993-94 leading to 1994-95
The MEI:
The
multi-relative ENSO index was developed By Dr. Klaus Wolter of
NOAAs Climate Diagnostics Center for the purpose of better
monitoring the progress of the ENSO. The MEI combines six
observed variables pertinent to warm and cold Episodes in the
Equatorial Pacific, these include:
·
Sea Level pressure (SLP)
·
Zonal and Meridional (U, V) components of the surface wind
·
Sea Surface temperature (SST)
·
Surface temperature
·
Total cloudiness fraction of the sky.
See the
link below for more information on the MEI:
http://www.cdc.noaa.gov/people/klaus.wolter/MEI/mei.html#ref_wt1
As with
the SOI, we are looking for trends in the MEI and comparing
the past 11 months with other similar 11 month periods in the
MEI in order to gather potential analogs.
|
2003 |
0.54 |
0.34 |
2004 |
0.31 |
0.36 |
-0.07 |
0.28 |
0.42 |
0.28 |
0.45 |
0.60 |
0.57 |
Other
similar years were 1951-52, 1976-77, 1978-79, 1985-86,
1989-90, 1990-91, 1993-94, and 2001-02. To view the data
from these years, consult the link below:
http://www.cdc.noaa.gov/correlation/mei.data
1952-53 is
out since no El Nino developed during the following winter,
leaving us with:
1976-77
----> 1977-78
1978-79
----> 1979-80
1985-86
----> 1986-87
1989-90
----> 1990-91
1990-91
----> 1991-92
1993-94
----> 1994-95
2001-02
----> 2002-03
Climate Models
Since
August 2004, the old AGCM climate model from NCEP has been
replaced by the New NCEP CFS (Coupled Forecast System) model.
The new page for the CFS can be found at
http://www.cpc.ncep.noaa.gov/products/people/wwang/cfs_fcst/
It is important for everyone to understand that while the
incorporation of such model output can be a valuable tool in
seasonal forecastingcreating a seasonal forecast based
completely on long-range climate model data is a VERY RISKY
PROPOSITION and ill-advised.
The old
AGCM had quite a bit of success prior to the winters of
2000-01 and 2002-03, however the model predicted widespread
below average temperatures across eastern North America, with
the core of which centered near the great lakes. That of
course did not pan out due to the unexpected surge in solar
activity and other less prevalent factors.
The latest
run of the new CFS from October 2004 strongly supports both
our analog years, and similar winters with EL Nino-west QBO
conditions. Below are CFS 200mb heights in overlapping three
monthly increments for the period NDJ 2004-05 through AMJ
2005.
http://www.cpc.ncep.noaa.gov/products/people/wwang/cfs_fcst/images/glbz200Sea.gif
There is a
signal for a frequently positive PNA pattern as evidenced by
the positive height anomaly over western
North
America,
and stronger than average Aleutian low. The aforementioned
teleconnection supports the formation of another downstream
negative anomaly over the
Eastern
United States.
As far as
SSTs are concerned, the model is forecasting the formation of
a weak to moderate El Nino centered over the central
Equatorial pacific, which supports our analogs.
http://www.cpc.ncep.noaa.gov/products/people/wwang/cfs_fcst/images/nino34SSTSea.gif
http://www.cpc.ncep.noaa.gov/products/people/wwang/cfs_fcst/images/glbSSTSea.gif
The only
discrepancy lies in exactly when the event peaks. The forecast
will reflect an El Nino event which peaks in the
December-January period. If the CFS is to be correct the event
would peak somewhat later, perhaps in the January-March
Period, then decline. Overall however, the upper level pattern
and SSTA forecasts from the CFS seem reasonable and are in
support of our analog seasons.
CFS
temperature and precipitation:
http://www.cpc.ncep.noaa.gov/products/people/wwang/cfs_fcst/images/usT2mMon.gif
http://www.cpc.ncep.noaa.gov/products/people/wwang/cfs_fcst/images/usPrecMon.gif
The ECPCs
GSM (Global Spectral Model) has outperformed the AGCM in
previous years. Below is a Link to the ECPC website and GSM
model
http://ecpc.ucsd.edu/
http://ecpc.ucsd.edu/projects/GSM_seasons.html
The
October run of the GSM supports the CFS ideas and the analog
years with the development of a strongly Positive PNA pattern
and Negative NAO as evidenced by the blocking (positive Height
anomaly) along the west coast of North America and over the
far North Atlantic. The resultant effect produces a strong
negative height anomaly over eastern North America.
http://ecpc.ucsd.edu/projects/GSM_home_data/200410/GZ5.200410.ano_PNA.gif
http://ecpc.ucsd.edu/projects/GSM_home_data/200410/GZ5.200410.ano_global.gif
This sort
of set-up with a Positive PNA pattern and negative NAO
suggests a persistent eastern us trough and western US ridge,
which at times may reach extreme amplitude during the cold
season, which is common for El Nino west QBO winters with a
Negative NAO in the means.
Temperature and precipitation:
http://ecpc.ucsd.edu/projects/GSM_home_data/200410/TMP2.200410.ano_PNA.gif
http://ecpc.ucsd.edu/projects/GSM_home_data/200410/PRATE.200410.ano_PNA.gif
Another
interesting factor to note is that the model is forecasting
above average Latent Heat Flux along the east coast during the
heat of the winter. Latent heat
flux refers to the global movement of latent heat energy
through oceanic and atmospheric circulations. An example of
this would be tropical cyclones, which transport latent heat
from the tropics poleward. It can also play a critical
role in explosive extratropical cyclogenesis (bombogenesis)
along the eastern seaboard during the winter season.
http://ecpc.ucsd.edu/projects/GSM_home_data/200410/LTNT.200410.ano_PNA.gif
This would
support an increased probably for such extreme cyclogenesis
during the coming winter.
For more
information on the GSM click here:
http://ecpc.ucsd.edu/projects/gsm_model/index.html
Other Issues
There are
a few other minor factors which were not covered in the
sections about, but are still noteworthy.
·
Solar
Activity:
10.7cm radio flux values during the months of May and June
dropped below 1000, however since then, an upsurge in solar
flux was noted in July. Since then radio flux values continue
to steadily decline as we trend toward the solar minimum.
Other years with similar ups and downs in 10.7cm flux values
include 1994, 1993, 1984, 1983, 1973, 1962, 1961, 1950. These
swings appear to be most common two to three years following
the solar maximum. As many are aware, high 10.7cm solar flux
can lead to stronger than average ridging over the mid
latitudes, whereas the corresponding geomagnetic activity can
lead to a weakening of the Aleutian low, and intensification
of the Icelandic low during the cold season resulting in a
Positive AO/NAO and negative PNA pattern. Values are low
enough this year that solar flux should not be a major issue.
·
ATC cycle:
Since 1995, the Atlantic thermohaline circulation has reverses
phases back to its strong cycle which favors above average
hurricane activity in the Atlantic basin, more La Nina events,
warm SSTA globally and a frequently Negative NAO in winter.
Although short term shifts in the ATC cycle from the long-term
phase do occurbased on 2004 hurricane activity, and Global
SSTA, I have no reason to believe a short term shift has
occurred. Thus, its likely that this signal will favor a
Negative NAO during the 2004-05 winter.
Crucial
Assumptions
·
The
2004-05 El Nino will peak at a weak to borderline Moderate
Intensity during the early winter, with a steady decline
thereafter.
·
The EPO
will average Neutral to negative
·
SOI
averages solidly negative consistent with El Nino
·
The PNA
pattern will average at least weak Positive.
·
Solar
Activity will not be an issue.
·
The QBO
will reverse in the January-February period to easterly,
however remain at near neutral values (no greater than
+/-5.00).
·
The AO and
NAO will average neutral to negative given the long term ATC
strong cycle, and Atlantic hurricane activity. Perhaps solidly
negative if Northern hemispheric Snowcover increases rapidly
over the next month and a half.
·
Major
December Noreaster
·
Major
Midwest and/or Severe eastern
US winter
storm/blizzard in January.
·
Severe
march Noreaster
·
1-2
High-impact Major east coast snow events.


Storm2k.org ©
2004
|


