
2022 Indicators (SSTs/SAL/MSLP/Shear/Steering/Instability) and >Day 16 Models
Moderator: S2k Moderators
Forum rules

The posts in this forum are NOT official forecasts and should not be used as such. They are just the opinion of the poster and may or may not be backed by sound meteorological data. They are NOT endorsed by any professional institution or STORM2K. For official information, please refer to products from the National Hurricane Center and National Weather Service.
-
skyline385

- Category 5

- Posts: 2728
- Age: 35
- Joined: Wed Aug 26, 2020 11:15 pm
- Location: Houston TX
Re: 2022 Indicators (SSTs/SAL/MSLP/Shear/Steering/Instability) and >Day 16 Models
Weekly cyclones, most members show a strong ridge but some do get pretty high up north
0 likes

Re: 2022 Indicators (SSTs/SAL/MSLP/Shear/Steering/Instability) and >Day 16 Models
A few notes for August based on model runs...
In spite of near average MDR shear and SSTs, positive precipitation anomalies in the region suggest an active wave train. The subtropics are poised to be drier with near or below average SSTs. Caribbean favorability is indeterminate across models and varies throughout the month. Gulf SSTs are expected to remain well above average with model agreement on somewhat below average shear.
For the first half of August, the ECMWF forecasts near-average activity. It depicts a gradual flip to above average corresponding with a reduction in subsidence and wind shear.
The CFS has been consistent on several MDR systems for August. Most do not threaten land, but for those which do, the NE Caribbean and SW Atlantic regions come up most frequently. Recent CFS runs also have ~2-3 western basin/homebrew systems scattered throughout the month.
Current VP forecasts suggest an IO standing wave is likely for much of August. Tropical waves will get a boost, but any additional MJO forcing over the Atlantic is uncertain. I think we'll see cyclical activity weighted towards late August with CCKWs making or breaking systems in marginal conditions.
2 likes
Kendall -> SLO -> PBC
Memorable Storms: Katrina (for its Florida landfall...) Wilma Matthew Irma
Memorable Storms: Katrina (for its Florida landfall...) Wilma Matthew Irma
-
cycloneye

- Admin

- Posts: 149715
- Age: 69
- Joined: Thu Oct 10, 2002 10:54 am
- Location: San Juan, Puerto Rico
Re: 2022 Indicators (SSTs/SAL/MSLP/Shear/Steering/Instability) and >Day 16 Models
Great post LarryWx. This thread benefits greatly with your imput that is always with an historic perspective.
3 likes
Visit the Caribbean-Central America Weather Thread where you can find at first post web cams,radars
and observations from Caribbean basin members Click Here
and observations from Caribbean basin members Click Here
-
skyline385
- Category 5
- Posts: 2728
- Age: 35
- Joined: Wed Aug 26, 2020 11:15 pm
- Location: Houston TX
Re: 2022 Indicators (SSTs/SAL/MSLP/Shear/Steering/Instability) and >Day 16 Models
LarryWx wrote:aspen wrote: I’m starting to get suspect about this season. It feels like there’s a key factor we’ve missed — Triple-dip Nina seasons are so rare that it wouldn’t be surprising if we did miss some factor associated with one — and it could end up resulting in far lower activity/ACE than most forecasts called for. Maybe activity closer to 2018 than 2017/20/21. Maybe the Atlantic ends up being suppressed for a good portion of ASO and we get a near-average season. Or maybe I end up eating my words in 4-6 weeks.
I think you MAY be onto something. Although there isn't a large sample, there are just enough third year La Nina seasons (seven) to make me feel it's worth it to analyze them. So, I just did so. What I found is the suggestion that third year La Nina seasons tend to be a good bit quieter than the respective prior (second year La Nina) seasons. Not a guarantee by any means but just a significant tendency. To find third year La Nina seasons, I used Eric Webb's ONI table for prior to 1950 and the CPC ONI table for 1950+. Here they are: 1874, 1894, 1910, 1917, 1956, 1975, and 2000.
1874: not as impactful nor as potent as 1873 though one H hit the FL panhandle
1894: not nearly as impactful nor as potent as the big impacting 1893 though it was still impactful and potent with one H hitting the FL Panhandle and another H hitting SW FL
1910: not nearly as impactful nor nearly as potent as the big impacting 1909 though a MH hit SW FL
1917: not as impactful nor nearly as potent as 1916 though a MH hit the FL panhandle
1956: not nearly as impactful nor nearly as potent as the big impacting 1955 though H Flossy hit the FL panhandle
1975: not nearly as impactful as though slightly more potent than 1974 with 1 MH hitting the FL Panhandle (Eloise)
2000: not nearly as impactful nor nearly as potent as 1999 but it still was pretty impactful and potent, including 2 TS hits in FL Panhandle (Gordon and Helene)
So, this suggests to me for third year La Nina seasons:
- a tendency to be both less impactful and potent than the prior season
- a tendency for W FL to be hit by at least one strong TS to MH, especially the FL panhandle
Some more comparisons of the seven third year Nina seasons to the prior (second year Nina) seasons:
- # of MH ~50% lower on average (2.0 v 3.9)
- # of MH landfalls ~60% lower on average (1.3 vs 3.3)
- # of deaths ~95% lower on average (~150 vs ~2,800 with deaths far lower than prior year all seven years)
- $ of damage range 72% to 99.7% lower
- ACE 40% lower on average (79 vs 133)
So, let's see whether or not 2022 ends up less impactful and less potent than 2021. With 2021 having had quite an impact ($81 billion damage) as well as having been potent (146 ace), 2022 could still be very impactful and rather potent even if a good bit weaker.
Something to add to this, some of our most potent seasons recently (2005,2017,2020) were all transitions from ENSO nuetral/+ve to La Nina. So while a lot of folks believe that third year Nina automatically means a more active season, it is actually the reverse which is true. This is also the reason why I keep saying that ENSO is dynamic, it is the change in the base state which seems to have a greater effect on TC activity compared to just entrenchment of the state. Years which are transitioning away from Nina (1985,1989,2000,2008,2011) can get active but historically tend to remain capped on activity.
3 likes
-
Yellow Evan

- Professional-Met

- Posts: 16257
- Age: 27
- Joined: Fri Jul 15, 2011 12:48 pm
- Location: Henderson, Nevada/Honolulu, HI
- Contact:
Re: 2022 Indicators (SSTs/SAL/MSLP/Shear/Steering/Instability) and >Day 16 Models
This near not 2000 or 2011 for that matter transitioned away from Niña.
2 likes
-
skyline385
- Category 5
- Posts: 2728
- Age: 35
- Joined: Wed Aug 26, 2020 11:15 pm
- Location: Houston TX
2022 Indicators (SSTs/SAL/MSLP/Shear/Steering/Instability) and >Day 16 Models
Yellow Evan wrote:This near not 2000 or 2011 for that matter transitioned away from Niña.
Which is why they were relatively more active than 1985 or 1989 which were transitioning through peak season. The point always was that Nina years in their final year do get capped on the activity and expecting a historic hyperactive season from them might be unrealistic. I have not once implied that 2022 will be a bust but that it may capped, i am still in the active (maybe even hyperactive upto 160 ACE) category.
0 likes
-
SFLcane

- S2K Supporter

- Posts: 10281
- Age: 48
- Joined: Sat Jun 05, 2010 1:44 pm
- Location: Lake Worth Florida
Re: 2022 Indicators (SSTs/SAL/MSLP/Shear/Steering/Instability) and >Day 16 Models
skyline385 wrote:Weekly cyclones, most members show a strong ridge but some do get pretty high up north
https://uploads.tapatalk-cdn.com/20220715/906fe68b76a8199a6abc6492f2d2be74.jpg
Not particularly impressive given that goes all the way to August 28. EPAC and WPAC look much busier for some reason.

0 likes
-
tolakram
- Admin
- Posts: 20186
- Age: 62
- Joined: Sun Aug 27, 2006 8:23 pm
- Location: Florence, KY (name is Mark)
Re: 2022 Indicators (SSTs/SAL/MSLP/Shear/Steering/Instability) and >Day 16 Models
I just want to go on record as thinking all of this talk is interesting but I have yet to see any skill in successfully predicting fast or slow seasons when there's no 'strong' indicator like el nino. I don't buy the third year la nina is a predictor of anything, especially since we're working with so little data.
Is there anything that tells us this season will be below normal? - Not seeing anything
Normal? - Sure, see above
Above normal - seems very likely
Hyperactive - I have yet to see any real skill in predicting hyperactive seasons so my answer is always probably not, turning to no the further we get into the season with no activity. There have been hyper seasons with no activity until mid August but those seasons requires more chance than normal to reach the hyperactive threshold. The storm has to start in a location where it can strengthen and stay away from land long enough to rack up ACE. Seems more chance than anything else. Just an amateur opinion though.
10 likes
M a r k
- - - - -
Join us in chat: Storm2K Chatroom Invite. Android and IOS apps also available.
The posts in this forum are NOT official forecasts and should not be used as such. Posts are NOT endorsed by any professional institution or STORM2K.org. For official information and forecasts, please refer to NHC and NWS products.
-
skyline385
- Category 5
- Posts: 2728
- Age: 35
- Joined: Wed Aug 26, 2020 11:15 pm
- Location: Houston TX
Re: 2022 Indicators (SSTs/SAL/MSLP/Shear/Steering/Instability) and >Day 16 Models
SFLcane wrote:skyline385 wrote:Weekly cyclones, most members show a strong ridge but some do get pretty high up north
https://uploads.tapatalk-cdn.com/20220715/906fe68b76a8199a6abc6492f2d2be74.jpg
Not particularly impressive given that goes all the way to August 28. EPAC and WPAC look much busier for some reason.
Didn’t even check the EPAC plot yesterday, yea it looks insanely busy.

0 likes


Re: 2022 Indicators (SSTs/SAL/MSLP/Shear/Steering/Instability) and >Day 16 Models
tolakram wrote:I just want to go on record as thinking all of this talk is interesting but I have yet to see any skill in successfully predicting fast or slow seasons when there's no 'strong' indicator like el nino. I don't buy the third year la nina is a predictor of anything, especially since we're working with so little data.
Is there anything that tells us this season will be below normal? - Not seeing anything
Normal? - Sure, see above
Above normal - seems very likely
Hyperactive - I have yet to see any real skill in predicting hyperactive seasons so my answer is always probably not, turning to no the further we get into the season with no activity. There have been hyper seasons with no activity until mid August but those seasons requires more chance than normal to reach the hyperactive threshold. The storm has to start in a location where it can strengthen and stay away from land long enough to rack up ACE. Seems more chance than anything else. Just an amateur opinion though.
Agreed we have so little information on third year Ninas to go by.
Going by what's happening right now is probably a good place to start. Named storm numbers will probably cool down compared to the past few seasons due to the less favorable subtropics (this is usually where activity comes from prior to August anyway), the named days are below normal. The deep tropics (MDR) we won't know until much later into August and September.
4 likes
The above post and any post by Ntxw is NOT an official forecast and should not be used as such. It is just the opinion of the poster and may or may not be backed by sound meteorological data. It is NOT endorsed by any professional institution including Storm2k. For official information, please refer to NWS products.
Help support Storm2K!
-
SFLcane
- S2K Supporter
- Posts: 10281
- Age: 48
- Joined: Sat Jun 05, 2010 1:44 pm
- Location: Lake Worth Florida
Re: 2022 Indicators (SSTs/SAL/MSLP/Shear/Steering/Instability) and >Day 16 Models
Ntxw wrote:tolakram wrote:I just want to go on record as thinking all of this talk is interesting but I have yet to see any skill in successfully predicting fast or slow seasons when there's no 'strong' indicator like el nino. I don't buy the third year la nina is a predictor of anything, especially since we're working with so little data.
Is there anything that tells us this season will be below normal? - Not seeing anything
Normal? - Sure, see above
Above normal - seems very likely
Hyperactive - I have yet to see any real skill in predicting hyperactive seasons so my answer is always probably not, turning to no the further we get into the season with no activity. There have been hyper seasons with no activity until mid August but those seasons requires more chance than normal to reach the hyperactive threshold. The storm has to start in a location where it can strengthen and stay away from land long enough to rack up ACE. Seems more chance than anything else. Just an amateur opinion though.
Agreed we have so little information on third year Ninas to go by.
Going by what's happening right now is probably a good place to start. Named storm numbers will probably cool down compared to the past few seasons due to the less favorable subtropics (this is usually where activity comes from prior to August anyway), the named days are below normal. The deep tropics (MDR) we won't know until much later into August and September.
This is true. The only ones we have are 1956, 1975, 2000.
Atlantic ACE of 56, 76, and 119
1 likes
Re: 2022 Indicators (SSTs/SAL/MSLP/Shear/Steering/Instability) and >Day 16 Models
One simple concept worth remembering is the more we stray from normal in our expectations the more likely they are to find a way to not happen. Hyperactive is a high bar to jump.
3 likes
-
skyline385
- Category 5
- Posts: 2728
- Age: 35
- Joined: Wed Aug 26, 2020 11:15 pm
- Location: Houston TX
Re: 2022 Indicators (SSTs/SAL/MSLP/Shear/Steering/Instability) and >Day 16 Models
Not sure how this will affect the WAM but the strong -IOD is absolutely wreaking havoc in India. Half of the state where i used to live in has received constant torrential rainfall for the past 2-3 days (8”+ in 24 hours) and because the rains are everywhere, everything is flooded as the water is unable to get out. Saw some aerial photos (from emergency crew evacuating through helicopters) of the city where my folks live and everything is flooded for miles, looked like a hurricane just went through it.
1 likes
-
weeniepatrol

- Category 5
- Posts: 1345
- Joined: Sat Aug 22, 2020 5:30 pm
- Location: WA State
Re: 2022 Indicators (SSTs/SAL/MSLP/Shear/Steering/Instability) and >Day 16 Models
skyline385 wrote:Not sure how this will affect the WAM but the strong -IOD is absolutely wreaking havoc in India. Half of the state where i used to live in has received constant torrential rainfall for the past 2-3 days (8”+ in 24 hours) and because the rains are everywhere, everything is flooded as the water is unable to get out. Saw some aerial photos (from emergency crew evacuating through helicopters) of the city where my folks live and everything is flooded for miles, looked like a hurricane just went through it.

3 likes
-
skyline385
- Category 5
- Posts: 2728
- Age: 35
- Joined: Wed Aug 26, 2020 11:15 pm
- Location: Houston TX
2022 Indicators (SSTs/SAL/MSLP/Shear/Steering/Instability) and >Day 16 Models
weeniepatrol wrote:skyline385 wrote:Not sure how this will affect the WAM but the strong -IOD is absolutely wreaking havoc in India. Half of the state where i used to live in has received constant torrential rainfall for the past 2-3 days (8”+ in 24 hours) and because the rains are everywhere, everything is flooded as the water is unable to get out. Saw some aerial photos (from emergency crew evacuating through helicopters) of the city where my folks live and everything is flooded for miles, looked like a hurricane just went through it.
holy crap.. pulled up a weekly from IMD and yeah, this can't be good..
Yea, this GFS run from just before the rains started is absolutely ridiculous.

0 likes
-
Emmett_Brown

- Category 5
- Posts: 1433
- Joined: Wed Aug 24, 2005 9:10 pm
- Location: Sarasota FL
Re: 2022 Indicators (SSTs/SAL/MSLP/Shear/Steering/Instability) and >Day 16 Models
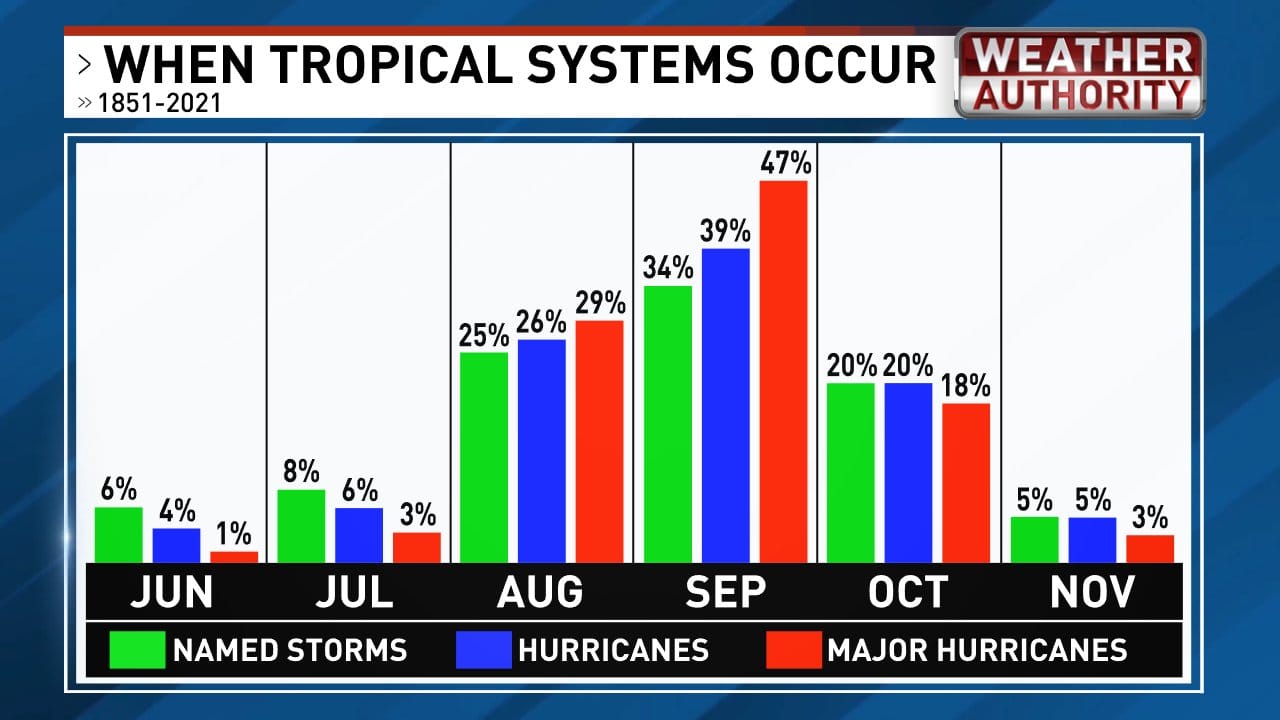
SFLcane wrote:https://i.postimg.cc/xTRRMj7x/hurricane.jpg
This is a great chart. It shows how quiet July really is on average. Jun, Jul and Nov are the quiet part of the "season". Per this chart, 85% of hurricanes happen in Aug - Oct, which is the real hurricane season. (Every season varies, and there are great examples of powerful storms outside of those months, they are the exception, not the rule).
5 likes
-
SFLcane
- S2K Supporter
- Posts: 10281
- Age: 48
- Joined: Sat Jun 05, 2010 1:44 pm
- Location: Lake Worth Florida
Re: 2022 Indicators (SSTs/SAL/MSLP/Shear/Steering/Instability) and >Day 16 Models
My treat for S2K for today! Enjoy your weekend guys 

Last edited by SFLcane on Fri Jul 15, 2022 2:25 pm, edited 1 time in total.
1 likes
-
cycloneye
- Admin
- Posts: 149715
- Age: 69
- Joined: Thu Oct 10, 2002 10:54 am
- Location: San Juan, Puerto Rico
Re: 2022 Indicators (SSTs/SAL/MSLP/Shear/Steering/Instability) and >Day 16 Models
SFLcane wrote:My treat for S2K for today! Enjoy your weekend guys
https://i.postimg.cc/Hs0xGH6g/CFS.gif
A slower loop to see it better.
0 likes
Visit the Caribbean-Central America Weather Thread where you can find at first post web cams,radars
and observations from Caribbean basin members Click Here
and observations from Caribbean basin members Click Here