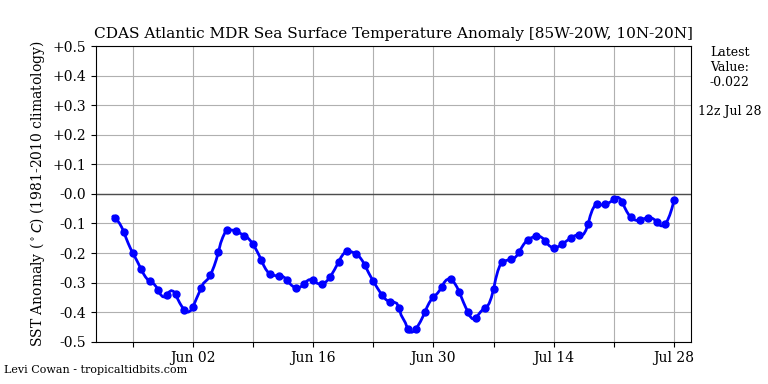
Kingarabian wrote:Pretty steep drop:

What’s causing this?
Moderator: S2k Moderators


Kingarabian wrote:Pretty steep drop:
storminabox wrote:
What’s causing this?


storminabox wrote:Kingarabian wrote:Pretty steep drop:
What’s causing this?

Ntxw wrote:storminabox wrote:
What’s causing this?
The persistent +NAO of the past 3-4 months. There have been dips negative but they have been brief and not sustaining. Also the cold waters below the surface are deep. When the MJO is favorable there also tends to be periods of warming but that is shorter periods than seasonal scale.
Eric Webb wrote:Ntxw wrote:storminabox wrote:
What’s causing this?
The persistent +NAO of the past 3-4 months. There have been dips negative but they have been brief and not sustaining. Also the cold waters below the surface are deep. When the MJO is favorable there also tends to be periods of warming but that is shorter periods than seasonal scale.
The +NAO's correlation to MDR SSTAs degrades significantly during the summer because the wavelengths change dramatically, you can easily have a +NAO in the summer that still favors warming. The nearly 1C cooling in just the past few days seems strange considering that the trade winds only increased slightly (~0.5 m/s) and SAL isn't that extensive. Evaporative cooling from dry air is only real effective when you have preexisting convective downdrafts to mix that cooler air to the surface and there's hardly any convection to do that in the MDR and even then convection comprises a very small fraction of the total area of the MDR.
Ntxw wrote:Eric Webb wrote:Ntxw wrote:
The persistent +NAO of the past 3-4 months. There have been dips negative but they have been brief and not sustaining. Also the cold waters below the surface are deep. When the MJO is favorable there also tends to be periods of warming but that is shorter periods than seasonal scale.
The +NAO's correlation to MDR SSTAs degrades significantly during the summer because the wavelengths change dramatically, you can easily have a +NAO in the summer that still favors warming. The nearly 1C cooling in just the past few days seems strange considering that the trade winds only increased slightly (~0.5 m/s) and SAL isn't that extensive. Evaporative cooling from dry air is only real effective when you have preexisting convective downdrafts to mix that cooler air to the surface and there's hardly any convection to do that in the MDR and even then convection comprises a very small fraction of the total area of the MDR.
Right. But it (NAO) is one part of a much larger picture. The Arctic-Far North Atlantic region has been under the influence of a persistent reverse dipole all summer, the strongest since 2013-2014. I would be surprised if that had no long term effects of spatial SSTs in the North Atlantic basin. When not getting help from the MJO, my assumption would be things revert back to the seasonal signal.

Ntxw wrote::uarrow: We are not discussing the winter pattern, my reference was to the past 3-4 months as a possible reason to the previous poster's question. If that is not correct in your views then by all means present them as to their question.
Eric Webb wrote:Ntxw wrote::uarrow: We are not discussing the winter pattern, my reference was to the past 3-4 months as a possible reason to the previous poster's question. If that is not correct in your views then by all means present them as to their question.
It's blatantly obvious we're not discussing the winter pattern but you gave the +NAO as a reason to the recent MDR cooling because you made the invalid assumption that the +NAO in both summer and winter cools the MDR and that's simply not true.
Ntxw wrote:Eric Webb wrote:Ntxw wrote::uarrow: We are not discussing the winter pattern, my reference was to the past 3-4 months as a possible reason to the previous poster's question. If that is not correct in your views then by all means present them as to their question.
It's blatantly obvious we're not discussing the winter pattern but you gave the +NAO as a reason to the recent MDR cooling because you made the invalid assumption that the +NAO in both summer and winter cools the MDR and that's simply not true.
Like I said, if that is not correct, then present your thoughts to the poster and we can discuss it. No need to get worked up here.


Ntxw wrote:That'll bring me to the same question as the prior poster. What is causing then of the recent drop? Perhaps erroneous satellite data?
Eric Webb wrote:Ntxw wrote:That'll bring me to the same question as the prior poster. What is causing then of the recent drop? Perhaps erroneous satellite data?
It's possible there's some error in data assimilation or noisy satellite data (data assimilation is in the CDAS acronym after all), I just have a hard time believing the MDR could have cooled almost 1C with near average trades and relatively more modest SAL in just a matter of a few days, the cumulative effect of stronger trades in July, a cold subsurface, and some SAL when the MDR is already cold certainly doesn't help and could explain some of this drop but it's so extreme in such a short period of time I'm personally skeptical it's actually real.
[img]https://www.tropicaltidbits.com/analysis/ocean/mdrssta.png[img]
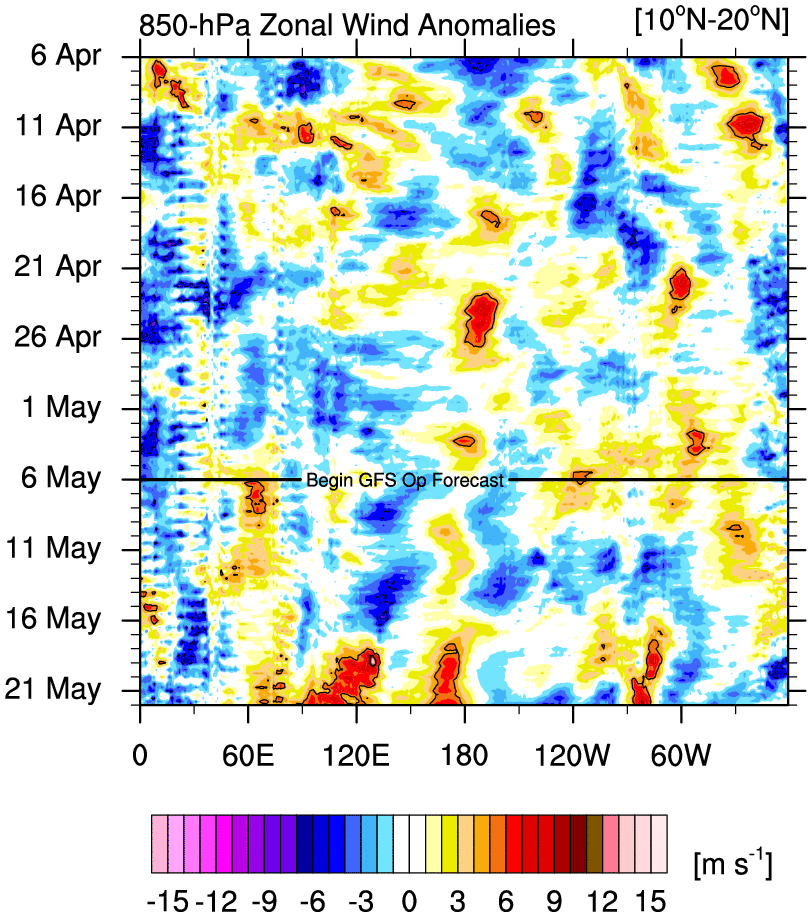
[img]http://www.atmos.albany.edu/student/ventrice/real_time/timeLon/u.anom.30.10N-20N.gif[img]


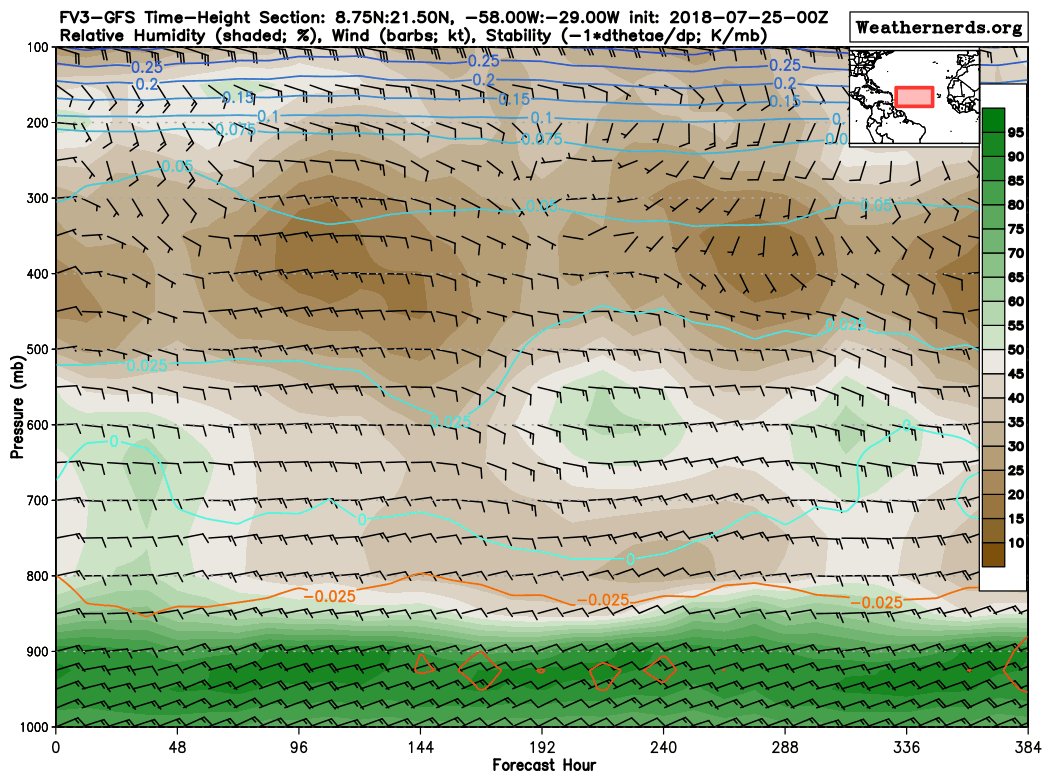


Eric Webb wrote:You can get the hint that the 3 sigma CCKW passing over the Atlantic has reached west Africa.
Users browsing this forum: Google [Bot] and 174 guests

