Even the invests have been few to develop.
https://twitter.com/TylerJStanfield/status/1569357670997708801
2022 Indicators (SSTs/SAL/MSLP/Shear/Steering/Instability) and >Day 16 Models
Moderator: S2k Moderators
Forum rules

The posts in this forum are NOT official forecasts and should not be used as such. They are just the opinion of the poster and may or may not be backed by sound meteorological data. They are NOT endorsed by any professional institution or STORM2K. For official information, please refer to products from the National Hurricane Center and National Weather Service.
-
cycloneye

- Admin

- Posts: 139027
- Age: 67
- Joined: Thu Oct 10, 2002 10:54 am
- Location: San Juan, Puerto Rico
Re: 2022 Indicators (SSTs/SAL/MSLP/Shear/Steering/Instability) and >Day 16 Models
2 likes
Visit the Caribbean-Central America Weather Thread where you can find at first post web cams,radars
and observations from Caribbean basin members Click Here
and observations from Caribbean basin members Click Here
-
skyline385
- Category 5

- Posts: 2444
- Age: 33
- Joined: Wed Aug 26, 2020 11:15 pm
- Location: Palm Beach County FL
2022 Indicators (SSTs/SAL/MSLP/Shear/Steering/Instability) and >Day 16 Models
Hammy wrote:Visioen wrote:So I take from this thread the cause is volcano induced wavebreaking by mid-level dry air.
As in, I have no clue what it means but it sounds good.
Wave breaking isn't even entirely the issue, the entire span of the tropics have warmed in the upper atmosphere, resulting in significant stability
Pretty sure vertical instability has been on a decline for the past decade, 2017 has more stability than 2013 but it didn’t stop it. There’s just a lot of factors at play this season and we will probably know more in post season analysis.
Sent from my iPhone using Tapatalk
3 likes
-
ScottNAtlanta

- Category 5
- Posts: 1998
- Joined: Sat May 25, 2013 3:11 pm
- Location: Atlanta, GA
Re: 2022 Indicators (SSTs/SAL/MSLP/Shear/Steering/Instability) and >Day 16 Models
Just to expand on a point about the Tonga Eruption...
Most if not all major volcanic eruptions send ash and SO2 high into the atmosphere. These aerosols reflect sunlight back out which has a cooling effect. This was not the case with Tonga. Tonga was a very water vapor rich eruption, and was very low in SO2 for an eruption this size. Water Vapor does not reflect sunlight like SO2. Instead it insulates. It keeps heat in the atmosphere which warms the upper layers. This would in turn reduce the temperature gradient as you go up. I could certainly see this disrupting weather patters in ways no one would be anticipating in the northern hemisphere.
Most if not all major volcanic eruptions send ash and SO2 high into the atmosphere. These aerosols reflect sunlight back out which has a cooling effect. This was not the case with Tonga. Tonga was a very water vapor rich eruption, and was very low in SO2 for an eruption this size. Water Vapor does not reflect sunlight like SO2. Instead it insulates. It keeps heat in the atmosphere which warms the upper layers. This would in turn reduce the temperature gradient as you go up. I could certainly see this disrupting weather patters in ways no one would be anticipating in the northern hemisphere.
10 likes
The posts in this forum are NOT official forecast and should not be used as such. They are just the opinion of the poster and may or may not be backed by sound meteorological data. They are NOT endorsed by any professional institution or storm2k.org. For official information, please refer to the NHC and NWS products.
-
skyline385
- Category 5
- Posts: 2444
- Age: 33
- Joined: Wed Aug 26, 2020 11:15 pm
- Location: Palm Beach County FL
Re: 2022 Indicators (SSTs/SAL/MSLP/Shear/Steering/Instability) and >Day 16 Models
Here is another indicator of how incredibly hostile the tropics are this season
https://twitter.com/bmcnoldy/status/1569407237575307265
Sent from my iPhone using Tapatalk
https://twitter.com/bmcnoldy/status/1569407237575307265
Sent from my iPhone using Tapatalk
0 likes

Re: 2022 Indicators (SSTs/SAL/MSLP/Shear/Steering/Instability) and >Day 16 Models
ScottNAtlanta wrote:Just to expand on a point about the Tonga Eruption...
Most if not all major volcanic eruptions send ash and SO2 high into the atmosphere. These aerosols reflect sunlight back out which has a cooling effect. This was not the case with Tonga. Tonga was a very water vapor rich eruption, and was very low in SO2 for an eruption this size. Water Vapor does not reflect sunlight like SO2. Instead it insulates. It keeps heat in the atmosphere which warms the upper layers. This would in turn reduce the temperature gradient as you go up. I could certainly see this disrupting weather patters in ways no one would be anticipating in the northern hemisphere.
This could be a major forecasting issue for many future seasons too. The study we’ve all be referring to also concluded that the water vapor plume could take 5-10 years to fully dissipate, meaning we could see disrupted weather patterns potentially for the rest of the decade. It’ll almost certainly impact at least the 2023 season, although whether only the Atlantic is suppressed or the entire NHem is even less active than 2022 remains to be seen. However, while there is good evidence in favor of the hypothesis that the eruption plume did suppress the NAtl season, there hasn’t been a smoking gun piece of evidence to confidently link the eruption and the marine heatwave/increased stability/displaced high. The setup is similar to what one article concluded would happen, but the paper saying the plume could last for up to a decade also said NHem impacts might not begin until next year. It’s still possible this is all a freak coincidence.
If the predictions about the H2O plume’s impacts are correct, then we’ll know during the winter, when we should see a weaker polar vortex and blasts of arctic air making it down into the CONUS.
1 likes
Irene '11 Sandy '12 Hermine '16 5/15/2018 Derecho Fay '20 Isaias '20 Elsa '21 Henri '21 Ida '21
I am only a meteorology enthusiast who knows a decent amount about tropical cyclones. Look to the professional mets, the NHC, or your local weather office for the best information.
I am only a meteorology enthusiast who knows a decent amount about tropical cyclones. Look to the professional mets, the NHC, or your local weather office for the best information.

Re: 2022 Indicators (SSTs/SAL/MSLP/Shear/Steering/Instability) and >Day 16 Models
skyline385 wrote:Hammy wrote:Visioen wrote:So I take from this thread the cause is volcano induced wavebreaking by mid-level dry air.
As in, I have no clue what it means but it sounds good.
Wave breaking isn't even entirely the issue, the entire span of the tropics have warmed in the upper atmosphere, resulting in significant stability
Pretty sure vertical instability has been on a decline for the past decade, 2017 has more stability than 2013 but it didn’t stop it. There’s just a lot of factors at play this season and we will probably know more in post season analysis.
Sent from my iPhone using Tapatalk
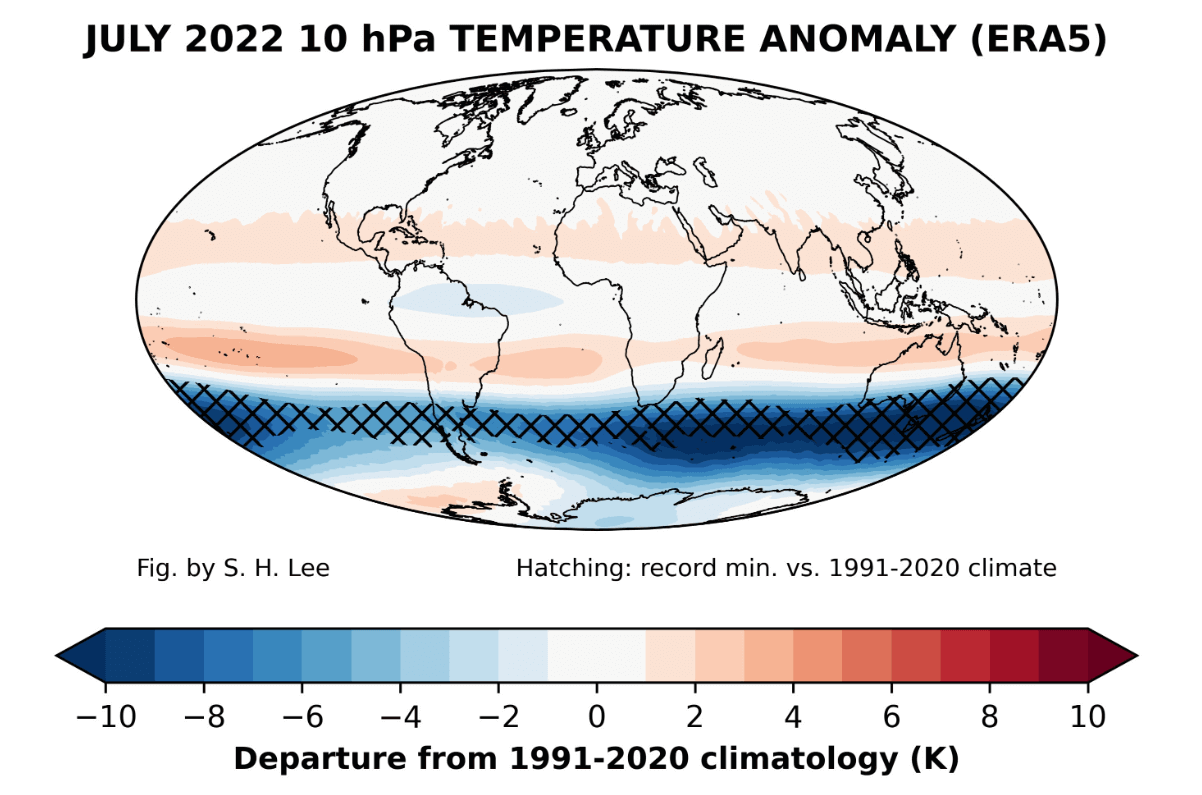
The instability graph has been broken since 2010 and best disregarded. I was referring to this. Less temperature gradient as you go up means more larger scale stability which is likely contributing to these broad waves we're seeing.
https://www.severe-weather.eu/global-weather/cold-anomaly-stratosphere-polar-vortex-volcanic-cooling-winter-influence-fa/
2 likes
The above post is not official and should not be used as such. It is the opinion of the poster and may or may not be backed by sound meteorological data. It is not endorsed by any professional institution or storm2k.org. For official information, please refer to the NHC and NWS products.
-
skyline385
- Category 5
- Posts: 2444
- Age: 33
- Joined: Wed Aug 26, 2020 11:15 pm
- Location: Palm Beach County FL
2022 Indicators (SSTs/SAL/MSLP/Shear/Steering/Instability) and >Day 16 Models
Hammy wrote:skyline385 wrote:Hammy wrote:
Wave breaking isn't even entirely the issue, the entire span of the tropics have warmed in the upper atmosphere, resulting in significant stability
Pretty sure vertical instability has been on a decline for the past decade, 2017 has more stability than 2013 but it didn’t stop it. There’s just a lot of factors at play this season and we will probably know more in post season analysis.
Sent from my iPhone using Tapatalk
The instability graph has been broken since 2010 and best disregarded. I was referring to this. Less temperature gradient as you go up means more larger scale stability which is likely contributing to these broad waves we're seeing.
https://www.severe-weather.eu/global-weather/cold-anomaly-stratosphere-polar-vortex-volcanic-cooling-winter-influence-fa/
The old instability graph is broken but they are working on a new one. RAMMB has also archived all years since 2005 on it up to mid August 2022, I shared it a few days ago in this thread along with the Twitter discussion about it. Here is the link to the graphs
https://rammb-data.cira.colostate.edu/~ ... _tat_THDV/
Sent from my iPhone using Tapatalk
1 likes
-
cycloneye
- Admin
- Posts: 139027
- Age: 67
- Joined: Thu Oct 10, 2002 10:54 am
- Location: San Juan, Puerto Rico
Re: 2022 Indicators (SSTs/SAL/MSLP/Shear/Steering/Instability) and >Day 16 Models
0 likes
Visit the Caribbean-Central America Weather Thread where you can find at first post web cams,radars
and observations from Caribbean basin members Click Here
and observations from Caribbean basin members Click Here
-
NotSparta

- Professional-Met

- Posts: 1645
- Age: 22
- Joined: Fri Aug 18, 2017 8:24 am
- Location: Naples, FL
- Contact:
Re: 2022 Indicators (SSTs/SAL/MSLP/Shear/Steering/Instability) and >Day 16 Models
Hammy wrote:skyline385 wrote:Hammy wrote:
Wave breaking isn't even entirely the issue, the entire span of the tropics have warmed in the upper atmosphere, resulting in significant stability
Pretty sure vertical instability has been on a decline for the past decade, 2017 has more stability than 2013 but it didn’t stop it. There’s just a lot of factors at play this season and we will probably know more in post season analysis.
Sent from my iPhone using Tapatalk
The instability graph has been broken since 2010 and best disregarded. I was referring to this. Less temperature gradient as you go up means more larger scale stability which is likely contributing to these broad waves we're seeing.
https://www.severe-weather.eu/wp-content/gallery/andrej-news/stratosphere-polar-vortex-cold-air-anomaly-record-low-values.PNG
https://www.severe-weather.eu/global-weather/cold-anomaly-stratosphere-polar-vortex-volcanic-cooling-winter-influence-fa/
10mb is probably too high a level to gauge lapse rates in the troposphere. A plot like that but at 100-200mb would probably be a lot more informative
1 likes
This post was probably an opinion of mine, and in no way is official. Please refer to http://www.hurricanes.gov for official tropical analysis and advisories.
My website, with lots of tropical wx graphics, including satellite and recon: http://cyclonicwx.com
My website, with lots of tropical wx graphics, including satellite and recon: http://cyclonicwx.com
-
skyline385
- Category 5
- Posts: 2444
- Age: 33
- Joined: Wed Aug 26, 2020 11:15 pm
- Location: Palm Beach County FL
Re: 2022 Indicators (SSTs/SAL/MSLP/Shear/Steering/Instability) and >Day 16 Models
NotSparta wrote:Hammy wrote:skyline385 wrote:Pretty sure vertical instability has been on a decline for the past decade, 2017 has more stability than 2013 but it didn’t stop it. There’s just a lot of factors at play this season and we will probably know more in post season analysis.
Sent from my iPhone using Tapatalk
The instability graph has been broken since 2010 and best disregarded. I was referring to this. Less temperature gradient as you go up means more larger scale stability which is likely contributing to these broad waves we're seeing.
https://www.severe-weather.eu/wp-content/gallery/andrej-news/stratosphere-polar-vortex-cold-air-anomaly-record-low-values.PNG
https://www.severe-weather.eu/global-weather/cold-anomaly-stratosphere-polar-vortex-volcanic-cooling-winter-influence-fa/
10mb is probably too high a level to gauge lapse rates in the troposphere. A plot like that but at 100-200mb would probably be a lot more informative
Been trying to find an updated plot from a verifiable source, CPC however has this graph which shows temperatures at 100mb (and 10mb too) to be in the 30% range for 25N - 25S.
https://www.cpc.ncep.noaa.gov/products/ ... mperature/


Sent from my iPhone using Tapatalk
1 likes
-
weeniepatrol

- Category 3

- Posts: 857
- Joined: Sat Aug 22, 2020 5:30 pm
- Location: WA State
Re: 2022 Indicators (SSTs/SAL/MSLP/Shear/Steering/Instability) and >Day 16 Models
Hammy wrote:skyline385 wrote:Hammy wrote:
Wave breaking isn't even entirely the issue, the entire span of the tropics have warmed in the upper atmosphere, resulting in significant stability
Pretty sure vertical instability has been on a decline for the past decade, 2017 has more stability than 2013 but it didn’t stop it. There’s just a lot of factors at play this season and we will probably know more in post season analysis.
Sent from my iPhone using Tapatalk
The instability graph has been broken since 2010 and best disregarded. I was referring to this. Less temperature gradient as you go up means more larger scale stability which is likely contributing to these broad waves we're seeing.
https://www.severe-weather.eu/wp-content/gallery/andrej-news/stratosphere-polar-vortex-cold-air-anomaly-record-low-values.PNG
https://www.severe-weather.eu/global-weather/cold-anomaly-stratosphere-polar-vortex-volcanic-cooling-winter-influence-fa/
While that graph is broken, skyline is right in that vertical instability IS on the decline especially in the Atlantic due to expanding Hadley cells
3 likes
-
cycloneye
- Admin
- Posts: 139027
- Age: 67
- Joined: Thu Oct 10, 2002 10:54 am
- Location: San Juan, Puerto Rico
Re: 2022 Indicators (SSTs/SAL/MSLP/Shear/Steering/Instability) and >Day 16 Models
0 likes
Visit the Caribbean-Central America Weather Thread where you can find at first post web cams,radars
and observations from Caribbean basin members Click Here
and observations from Caribbean basin members Click Here

Re: 2022 Indicators (SSTs/SAL/MSLP/Shear/Steering/Instability) and >Day 16 Models
Inb4 this gives us a hyperactive October
4 likes
Re: 2022 Indicators (SSTs/SAL/MSLP/Shear/Steering/Instability) and >Day 16 Models
Teban54 wrote:
Inb4 this gives us a hyperactive October
I still feel there's a point being missed with the discussions around the warming. Warm SSTs at higher latitudes are not causing the reduced activity, but rather, both seem like they're resulting from a northward-displaced high pressure which is also why the waves are so broad and unable to organize
The cooling, rather than being what allows activity if things do increase, may be a sign in itself that the background state is changing.
0 likes
The above post is not official and should not be used as such. It is the opinion of the poster and may or may not be backed by sound meteorological data. It is not endorsed by any professional institution or storm2k.org. For official information, please refer to the NHC and NWS products.
-
Category5Kaiju

- Category 5
- Posts: 3351
- Age: 22
- Joined: Thu Dec 24, 2020 12:45 pm
- Location: Seattle
Re: 2022 Indicators (SSTs/SAL/MSLP/Shear/Steering/Instability) and >Day 16 Models
Teban54 wrote:
Inb4 this gives us a hyperactive October
If this season somehow just attacks us in October with multiple major hurricanes, then I think this season will go down as one of the most legendary, trollish seasons to ever exist
0 likes
Unless explicitly stated, all information covered in my posts is based on my opinions and observations. Please refer to a professional meteorologist or an accredited weather research agency otherwise, especially if serious decisions must be made in the event of a potentially life-threatening tropical storm or hurricane.
-
DorkyMcDorkface

- Category 2

- Posts: 692
- Age: 26
- Joined: Mon Sep 30, 2019 1:32 pm
- Location: Mid-Atlantic
Re: 2022 Indicators (SSTs/SAL/MSLP/Shear/Steering/Instability) and >Day 16 Models
Hammy wrote:Teban54 wrote:
Inb4 this gives us a hyperactive October
I still feel there's a point being missed with the discussions around the warming. Warm SSTs at higher latitudes are not causing the reduced activity, but rather, both seem like they're resulting from a northward-displaced high pressure which is also why the waves are so broad and unable to organize
The cooling, rather than being what allows activity if things do increase, may be a sign in itself that the background state is changing.
The anomalously warm midlatitudes are a culprit though, it's how you get strong ridging up there as you mentioned which causes upper level troughing to undercut it. Said warmth is also a result from the extended La Niña state as instability gets sapped from the tropics the longer we go without +ENSO (certainly not helped out by the fact that said Niña background state is near record levels).
4 likes
Floyd 1999 | Isabel 2003 | Hanna 2008 | Irene 2011 | Sandy 2012 | Isaias 2020
-
tolakram
- Admin
- Posts: 19165
- Age: 60
- Joined: Sun Aug 27, 2006 8:23 pm
- Location: Florence, KY (name is Mark)
Re: 2022 Indicators (SSTs/SAL/MSLP/Shear/Steering/Instability) and >Day 16 Models
DorkyMcDorkface wrote:Hammy wrote:Teban54 wrote:Inb4 this gives us a hyperactive October
I still feel there's a point being missed with the discussions around the warming. Warm SSTs at higher latitudes are not causing the reduced activity, but rather, both seem like they're resulting from a northward-displaced high pressure which is also why the waves are so broad and unable to organize
The cooling, rather than being what allows activity if things do increase, may be a sign in itself that the background state is changing.
The anomalously warm midlatitudes are a culprit though, it's how you get strong ridging up there as you mentioned which causes upper level troughing to undercut it. Said warmth is also a result from the extended La Niña state as instability gets sapped from the tropics the longer we go without +ENSO (certainly not helped out by the fact that said Niña background state is near record levels).
If this is the case why couldn't any of the hurricane forecasters see this? Why didn't any of them react to it?
3 likes
M a r k
- - - - -
Join us in chat: Storm2K Chatroom Invite. Android and IOS apps also available.
The posts in this forum are NOT official forecasts and should not be used as such. Posts are NOT endorsed by any professional institution or STORM2K.org. For official information and forecasts, please refer to NHC and NWS products.
-
skyline385
- Category 5
- Posts: 2444
- Age: 33
- Joined: Wed Aug 26, 2020 11:15 pm
- Location: Palm Beach County FL
2022 Indicators (SSTs/SAL/MSLP/Shear/Steering/Instability) and >Day 16 Models
tolakram wrote:DorkyMcDorkface wrote:Hammy wrote:
I still feel there's a point being missed with the discussions around the warming. Warm SSTs at higher latitudes are not causing the reduced activity, but rather, both seem like they're resulting from a northward-displaced high pressure which is also why the waves are so broad and unable to organize
The cooling, rather than being what allows activity if things do increase, may be a sign in itself that the background state is changing.
The anomalously warm midlatitudes are a culprit though, it's how you get strong ridging up there as you mentioned which causes upper level troughing to undercut it. Said warmth is also a result from the extended La Niña state as instability gets sapped from the tropics the longer we go without +ENSO (certainly not helped out by the fact that said Niña background state is near record levels).
If this is the case why couldn't any of the hurricane forecasters see this? Why didn't any of them react to it?
Webb mentioned a few weeks ago that instability is not a factor in seasonal forecasts and that this season serves as a lesson to why it should be.
Additionally, until June-July, the anomalous warmth was not that bad. I remember Andy joking that we were approaching 2013 levels near Newfoundland and that it was something to watch out for but in the last couple of months the warmth has gone way beyond 2013 or any other year in the recent active era with anomalies as high as 5C in the warm pool. I don’t think any seasonal model predicted this. And if models are not showing it, then it’s hard for the forecasters to predict such an extreme scenario.
See below for how much the anomalies increased in the last two months.


Last edited by skyline385 on Tue Sep 13, 2022 11:30 am, edited 2 times in total.
2 likes


Re: 2022 Indicators (SSTs/SAL/MSLP/Shear/Steering/Instability) and >Day 16 Models
First cold front is through. Let’s see if we get a response in the next couple of weeks close to the USA.
0 likes
-
tolakram
- Admin
- Posts: 19165
- Age: 60
- Joined: Sun Aug 27, 2006 8:23 pm
- Location: Florence, KY (name is Mark)
Re: 2022 Indicators (SSTs/SAL/MSLP/Shear/Steering/Instability) and >Day 16 Models
skyline385 wrote:tolakram wrote:DorkyMcDorkface wrote:The anomalously warm midlatitudes are a culprit though, it's how you get strong ridging up there as you mentioned which causes upper level troughing to undercut it. Said warmth is also a result from the extended La Niña state as instability gets sapped from the tropics the longer we go without +ENSO (certainly not helped out by the fact that said Niña background state is near record levels).
If this is the case why couldn't any of the hurricane forecasters see this? Why didn't any of them react to it?
Webb mentioned a few weeks ago that instability is not a factor in seasonal forecasts and this season serves as a lesson to why it should be.
Seems like a pretty big statement to make about ALL hurricane forecasts. Was he talking hurricane forecasts or model predictions? I never consider what a model says to be a forecast, forecasters make forecasts, models are tools used in forecasting. CSU uses hindcasting, so they would not use a model prediction.
1 likes
M a r k
- - - - -
Join us in chat: Storm2K Chatroom Invite. Android and IOS apps also available.
The posts in this forum are NOT official forecasts and should not be used as such. Posts are NOT endorsed by any professional institution or STORM2K.org. For official information and forecasts, please refer to NHC and NWS products.
- - - - -
Join us in chat: Storm2K Chatroom Invite. Android and IOS apps also available.
The posts in this forum are NOT official forecasts and should not be used as such. Posts are NOT endorsed by any professional institution or STORM2K.org. For official information and forecasts, please refer to NHC and NWS products.