chaser1 wrote:Your thoughts on general implications?
Two other questions......
1) Have you noticed any correlation (or inverse correlation) between high global water vapor growth and those months/years during strong El Nino events?
2) Other (and rather random) question is, do you believe an anomalous level of global water vapor would potentially increase/decrease the global impact if occurring during a concurrent period of very strong volcanic activity and associated increase of atmospheric particulates? Obviously some level of planetary cooling occurs as a result of extremely significant volcanic events but I was curious if very high global water vapor acted to further exacerbate or mitigate the level of cooling.
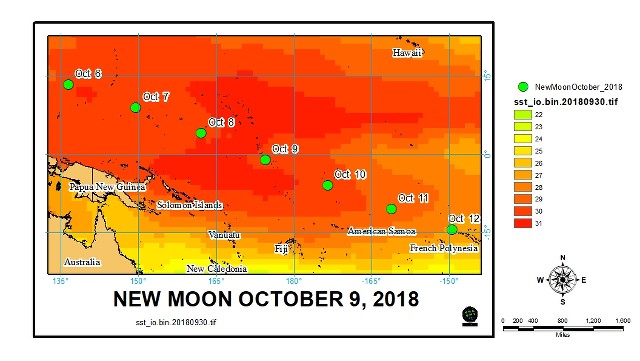
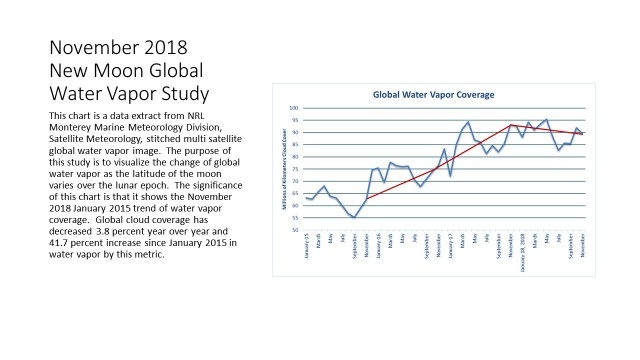
1) The relationship I hypothesize is one where the latitude of the midsummer new moon is the strongest evaporation that is influenced by gravity. The latitude of midsummer new moon ranges from 17 degrees north to around 30 degrees north. The super el nino occurs at the bottom of the run. There is no correlation to any other nino event.
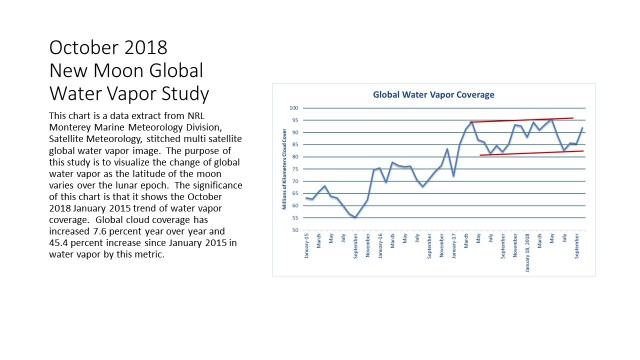
2) The rate of sea level rise and the growth of the area of surface water are related, as is the distance from the sun and the average atmospheric pressure. When there is more water surface and and less atmospheric pressure it seem that it should rain more.
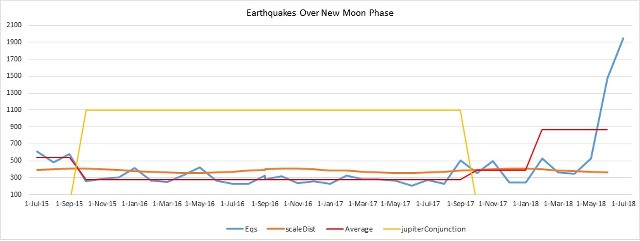
...volcanism is a result of crustal movement which is measurably more when there is less gravity. Less gravity less pressure more rain.
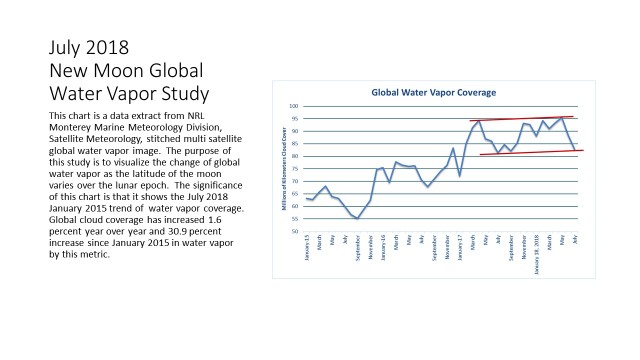
The lunar cycle is 19 years from node to node, this particular study started May 2014. The cresting of the rise of global water vapor is the inflection point I am looking forward to.