ATL: LAURA - Models
Moderator: S2k Moderators
-
catskillfire51
- S2K Supporter

- Posts: 480
- Age: 39
- Joined: Sun Aug 26, 2012 5:40 pm
- Location: Lake Jackson, TX
Re: ATL: LAURA - Models
Ukmet west shift/ CMC West shift i'll be it slight but this is the time when models should be going back east.
1 likes
Re: ATL: LAURA - Models
12z SHIPS - forecast intensity about the same as 06z and 00z with 86 knots or around 100 MPH at landfall but RI probabilities decreased at 06z compared to 00z and have decreased even more on this 12z run.
* GFS version *
* ATLANTIC 2020 SHIPS INTENSITY FORECAST *
* IR SAT DATA AVAILABLE, OHC AVAILABLE *
* LAURA AL132020 08/25/20 12 UTC *
TIME (HR) 0 6 12 18 24 36 48 60 72 84 96 108 120 132 144 156 168
V (KT) NO LAND 65 69 73 77 81 86 87 83 75 69 67 63 70 63 52 38 28
V (KT) LAND 65 69 73 77 81 86 62 38 30 28 28 28 38 31 21 N/A N/A
V (KT) LGEM 65 70 74 79 83 88 66 38 30 28 28 28 37 41 35 36 34
Storm Type TROP TROP TROP TROP TROP TROP TROP TROP TROP TROP TROP TROP EXTP EXTP EXTP EXTP EXTP
SHEAR (KT) 12 10 4 8 12 12 22 20 13 20 21 30 45 71 62 78 78
SHEAR ADJ (KT) 6 7 4 1 2 0 2 1 8 7 1 2 3 -11 -4 -11 -11
SHEAR DIR 3 30 33 328 321 260 261 256 278 258 245 238 240 216 221 236 242
SST (C) 29.9 30.4 30.3 30.3 30.2 29.8 31.5 31.1 29.8 29.8 29.0 28.3 23.7 19.7 16.4 12.2 13.0
POT. INT. (KT) 169 173 173 173 172 167 173 172 167 168 156 147 103 85 76 69 69
ADJ. POT. INT. 161 170 167 165 159 150 173 168 141 146 142 137 96 80 72 67 66
200 MB T (C) -51.1 -50.8 -50.4 -50.6 -50.5 -49.5 -49.2 -49.4 -50.3 -51.0 -52.1 -52.0 -52.0 -51.3 -51.3 -51.2 -50.9
200 MB VXT (C) 0.5 0.4 0.4 0.5 0.6 1.0 1.7 1.5 1.2 0.7 0.5 0.5 0.4 0.9 2.1 1.8 2.4
TH_E DEV (C) 11 12 11 11 10 12 9 13 4 11 5 7 3 1 0 0 0
700-500 MB RH 53 55 56 57 61 60 59 54 58 63 62 53 50 50 55 49 51
MODEL VTX (KT) 22 23 23 24 25 26 26 22 17 13 13 12 21 22 23 20 21
850 MB ENV VOR 20 44 38 16 11 -19 -65 -51 -44 -9 48 116 204 192 194 137 154
200 MB DIV 20 42 40 36 31 13 26 21 11 58 27 62 60 71 79 53 40
700-850 TADV -5 0 -5 -3 0 11 7 25 20 46 17 33 32 12 -37 -35 -45
LAND (KM) 213 257 341 429 357 189 -116 -401 -603 -687 -579 -115 188 184 -36 348 706
LAT (DEG N) 23.3 23.9 24.5 25.3 26.0 28.0 30.8 33.4 35.6 36.9 37.3 38.3 40.2 xx.x xx.x xx.x xx.x
LONG(DEG W) 86.3 87.7 89.1 90.4 91.6 93.2 93.6 93.3 92.0 88.7 83.5 76.7 68.9 xxx.x xxx.x xxx.x xxx.x
STM SPEED (KT) 14 14 14 14 12 13 13 13 13 17 24 30 32 32 28 20 16
HEAT CONTENT 49 62 59 72 61 36 7 6 5 5 4 3 0 0 0 0 0
FORECAST TRACK FROM OFCI INITIAL HEADING/SPEED (DEG/KT):290/ 15 CX,CY: -13/ 5
T-12 MAX WIND: 55 PRESSURE OF STEERING LEVEL (MB): 574 (MEAN=620)
GOES IR BRIGHTNESS TEMP. STD DEV. 50-200 KM RAD: 24.0 (MEAN=14.5)
% GOES IR PIXELS WITH T < -20 C 50-200 KM RAD: 63.0 (MEAN=65.0)
PRELIM RI PROB (DV .GE. 35 KT IN 36 HR): 28.5
INDIVIDUAL CONTRIBUTIONS TO INTENSITY CHANGE
6 12 18 24 36 48 60 72 84 96 108 120 132 144 156 168
------------------------------------------------------------------------------
SAMPLE MEAN CHANGE 1. 2. 3. 4. 6. 8. 9. 10. 11. 12. 12. 13. 14. 14. 15. 16.
SST POTENTIAL 1. 3. 4. 5. 6. 7. 9. 10. 11. 11. 12. 11. 8. 4. 1. -3.
VERTICAL SHEAR MAG -0. 1. 1. 1. 2. 2. 1. 1. 1. 0. -2. -6. -14. -21. -30. -39.
VERTICAL SHEAR ADJ -0. -1. -1. -1. -1. -2. -2. -2. -2. -2. -2. -2. -1. -1. -0. 0.
VERTICAL SHEAR DIR 0. 0. 0. 0. 0. 1. 2. 3. 3. 4. 6. 7. 8. 9. 9. 10.
PERSISTENCE 2. 2. 2. 2. 1. 1. 1. 1. 0. -0. -0. -0. 0. 1. 1. 1.
200/250 MB TEMP. -1. -1. -2. -2. -4. -5. -5. -6. -6. -6. -7. -8. -9. -10. -11. -12.
THETA_E EXCESS 0. 1. 1. 1. 1. 1. 1. 1. 1. 0. 0. 0. -0. -0. -0. 0.
700-500 MB RH 0. 0. -0. -0. -0. -1. -1. -1. -2. -2. -2. -2. -1. -2. -1. -1.
MODEL VTX TENDENCY 0. 0. 0. 2. 2. 2. -3. -11. -17. -18. -21. -9. -7. -7. -10. -8.
850 MB ENV VORTICITY 0. 0. 0. -0. -0. -1. -2. -2. -2. -2. -2. -1. 0. 1. 2. 3.
200 MB DIVERGENCE -0. -0. 0. 0. -0. -0. -0. -0. -0. -0. -0. -0. -0. -1. -1. -1.
850-700 T ADVEC 0. -0. -0. -0. -0. 0. 0. 1. 1. 1. 1. 1. 1. 0. 0. 0.
ZONAL STORM MOTION -0. -0. 0. 0. 1. 1. 1. 1. 2. 3. 3. 3. 3. 3. 3. 3.
STEERING LEVEL PRES 0. 0. 0. 0. 0. 0. 0. 0. 0. 0. 1. 1. 0. 0. 0. 0.
DAYS FROM CLIM. PEAK 0. -0. -0. -0. -0. 0. 0. -0. -0. -0. -0. -0. -0. -0. -0. -0.
GOES PREDICTORS -0. -1. -1. -1. -0. 1. 1. 1. 2. 2. 2. 1. 0. -1. -1. -1.
OCEAN HEAT CONTENT 0. 0. 0. 0. 0. 0. -0. -0. -0. -0. -0. -0. -0. -0. -0. -0.
RI POTENTIAL 1. 2. 4. 5. 7. 7. 5. 3. 1. -1. -3. -4. -4. -4. -5. -5.
------------------------------------------------------------------------------
TOTAL CHANGE 4. 8. 12. 16. 21. 22. 18. 10. 4. 2. -2. 5. -2. -13. -27. -37.
CURRENT MAX WIND (KT): 65. LAT, LON: 23.3 86.3
** 2020 ATLANTIC RI INDEX AL132020 LAURA 08/25/20 12 UTC **
(SHIPS-RII PREDICTOR TABLE for 30 KT OR MOREMAXIMUM WIND INCREASE IN NEXT 24-h)
Predictor Value RI Predictor Range Scaled Value(0-1) % Contribution
12 HR PERSISTENCE (KT) : 10.0 -49.5 to 33.0 0.72 6.8
850-200 MB SHEAR (KT) : 9.0 30.1 to 2.3 0.76 2.7
HEAT CONTENT (KJ/CM2) : 60.6 0.0 to 151.8 0.40 1.4
STD DEV OF IR BR TEMP : 24.0 36.6 to 2.8 0.37 1.5
MAXIMUM WIND (KT) : 65.0 22.5 to 137.5 0.94 2.0
2nd PC OF IR BR TEMP : 0.5 2.9 to -2.9 0.41 1.0
BL DRY-AIR FLUX (W/M2) : 394.2 895.4 to -55.0 0.53 1.3
POT = MPI-VMAX (KT) : 99.2 27.5 to 139.6 0.64 0.6
D200 (10**7s-1) : 33.8 -29.7 to 185.9 0.29 0.2
%area of TPW <45 mm upshear : 0.0 100.0 to 0.0 1.00 0.2
SHIPS Prob RI for 20kt/ 12hr RI threshold= 9% is 1.8 times climatological mean ( 5.0%)
SHIPS Prob RI for 25kt/ 24hr RI threshold= 31% is 2.8 times climatological mean (10.9%)
SHIPS Prob RI for 30kt/ 24hr RI threshold= 18% is 2.6 times climatological mean ( 6.9%)
SHIPS Prob RI for 35kt/ 24hr RI threshold= 13% is 3.4 times climatological mean ( 3.9%)
SHIPS Prob RI for 40kt/ 24hr RI threshold= 13% is 5.0 times climatological mean ( 2.5%)
SHIPS Prob RI for 45kt/ 36hr RI threshold= 15% is 3.4 times climatological mean ( 4.6%)
SHIPS Prob RI for 55kt/ 48hr RI threshold= 13% is 2.9 times climatological mean ( 4.6%)
SHIPS Prob RI for 65kt/ 72hr RI threshold= 17% is 3.2 times climatological mean ( 5.2%)
Matrix of RI probabilities
------------------------------------------------------------------------------
RI (kt / h) | 20/12 | 25/24 | 30/24 | 35/24 | 40/24 | 45/36 | 55/48 |65/72
------------------------------------------------------------------------------
SHIPS-RII: 8.8% 30.6% 17.6% 13.3% 12.5% 15.4% 13.4% 16.7%
Logistic: 7.3% 26.6% 15.4% 11.9% 8.5% 23.0% 21.9% 4.3%
Bayesian: 6.3% 21.2% 7.1% 0.8% 0.3% 5.0% 3.4% 0.0%
Consensus: 7.5% 26.1% 13.4% 8.7% 7.1% 14.5% 12.9% 7.0%
DTOPS: 26.0% 77.0% 49.0% 26.0% 5.0% 9.0% 0.0% 0.0%
## ANNULAR HURRICANE INDEX (AHI) AL132020 LAURA 08/25/20 12 UTC ##
## STORM NOT ANNULAR, SCREENING STEP FAILED, NPASS=3 NFAIL=4 ##
## AHI= 0 (AHI OF 100 IS BEST FIT TO ANN. STRUC., 1 IS MARGINAL, 0 IS NOT ANNULAR) ##
** PROBLTY OF AT LEAST 1 SCNDRY EYEWL FORMTN EVENT AL132020 LAURA 08/25/2020 12 UTC **
TIME(HR) 0-12 12-24(0-24) 24-36(0-36) 36-48(0-48)
CLIMO(%) 2 4( 6) 8( 13) 10( 22) <-- PROB BASED ON INTENSITY ONLY
PROB(%) 0 0( 0) 0( 0) 0( 0) <-- FULL MODEL PROB (RAN NORMALLY)
** DSHIPS INTENSITY FORECAST ADJUSTED RELATIVE TO ONSET OF ERC WEAKENING PHASE **
TIME (HR) 0 6 12 18 24 36 48 60 72 84 96 108 120 132 144 156 168
>24HR AGO (DSHIPS) 65 69 73 77 81 86 62 38 30 28 28 28 38 31 21 DIS DIS
18HR AGO 65 64 68 72 76 81 57 33 25 23 23 23 33 26 16 DIS DIS
12HR AGO 65 62 61 65 69 74 50 26 18 16 16 16 26 19 DIS DIS DIS
6HR AGO 65 59 56 55 59 64 40 16 DIS DIS DIS DIS DIS DIS DIS DIS DIS
NOW CURRENT INTENSITY < 83 KT
IN 6HR INTENSITY IN 6HR < 83 KT
IN 12HR INTENSITY IN 12HR < 83 KT
0 likes
The posts in this forum are NOT official forecast and should not be used as such. They are just the opinion of the poster and may or may not be backed by sound meteorological data. They are NOT endorsed by any professional institution or STORM2K. For official information, refer to products from the National Hurricane Center and National Weather Service.

Re: ATL: LAURA - Models
WxEp wrote:12z SHIPS - forecast intensity about the same as 06z and 00z with 86 knots or around 100 MPH at landfall but RI probabilities decreased at 06z compared to 00z and have decreased even more on this 12z run.* GFS version *
* ATLANTIC 2020 SHIPS INTENSITY FORECAST *
* IR SAT DATA AVAILABLE, OHC AVAILABLE *
* LAURA AL132020 08/25/20 12 UTC *
TIME (HR) 0 6 12 18 24 36 48 60 72 84 96 108 120 132 144 156 168
V (KT) NO LAND 65 69 73 77 81 86 87 83 75 69 67 63 70 63 52 38 28
V (KT) LAND 65 69 73 77 81 86 62 38 30 28 28 28 38 31 21 N/A N/A
V (KT) LGEM 65 70 74 79 83 88 66 38 30 28 28 28 37 41 35 36 34
Storm Type TROP TROP TROP TROP TROP TROP TROP TROP TROP TROP TROP TROP EXTP EXTP EXTP EXTP EXTP
SHEAR (KT) 12 10 4 8 12 12 22 20 13 20 21 30 45 71 62 78 78
SHEAR ADJ (KT) 6 7 4 1 2 0 2 1 8 7 1 2 3 -11 -4 -11 -11
SHEAR DIR 3 30 33 328 321 260 261 256 278 258 245 238 240 216 221 236 242
SST (C) 29.9 30.4 30.3 30.3 30.2 29.8 31.5 31.1 29.8 29.8 29.0 28.3 23.7 19.7 16.4 12.2 13.0
POT. INT. (KT) 169 173 173 173 172 167 173 172 167 168 156 147 103 85 76 69 69
ADJ. POT. INT. 161 170 167 165 159 150 173 168 141 146 142 137 96 80 72 67 66
200 MB T (C) -51.1 -50.8 -50.4 -50.6 -50.5 -49.5 -49.2 -49.4 -50.3 -51.0 -52.1 -52.0 -52.0 -51.3 -51.3 -51.2 -50.9
200 MB VXT (C) 0.5 0.4 0.4 0.5 0.6 1.0 1.7 1.5 1.2 0.7 0.5 0.5 0.4 0.9 2.1 1.8 2.4
TH_E DEV (C) 11 12 11 11 10 12 9 13 4 11 5 7 3 1 0 0 0
700-500 MB RH 53 55 56 57 61 60 59 54 58 63 62 53 50 50 55 49 51
MODEL VTX (KT) 22 23 23 24 25 26 26 22 17 13 13 12 21 22 23 20 21
850 MB ENV VOR 20 44 38 16 11 -19 -65 -51 -44 -9 48 116 204 192 194 137 154
200 MB DIV 20 42 40 36 31 13 26 21 11 58 27 62 60 71 79 53 40
700-850 TADV -5 0 -5 -3 0 11 7 25 20 46 17 33 32 12 -37 -35 -45
LAND (KM) 213 257 341 429 357 189 -116 -401 -603 -687 -579 -115 188 184 -36 348 706
LAT (DEG N) 23.3 23.9 24.5 25.3 26.0 28.0 30.8 33.4 35.6 36.9 37.3 38.3 40.2 xx.x xx.x xx.x xx.x
LONG(DEG W) 86.3 87.7 89.1 90.4 91.6 93.2 93.6 93.3 92.0 88.7 83.5 76.7 68.9 xxx.x xxx.x xxx.x xxx.x
STM SPEED (KT) 14 14 14 14 12 13 13 13 13 17 24 30 32 32 28 20 16
HEAT CONTENT 49 62 59 72 61 36 7 6 5 5 4 3 0 0 0 0 0
FORECAST TRACK FROM OFCI INITIAL HEADING/SPEED (DEG/KT):290/ 15 CX,CY: -13/ 5
T-12 MAX WIND: 55 PRESSURE OF STEERING LEVEL (MB): 574 (MEAN=620)
GOES IR BRIGHTNESS TEMP. STD DEV. 50-200 KM RAD: 24.0 (MEAN=14.5)
% GOES IR PIXELS WITH T < -20 C 50-200 KM RAD: 63.0 (MEAN=65.0)
PRELIM RI PROB (DV .GE. 35 KT IN 36 HR): 28.5
INDIVIDUAL CONTRIBUTIONS TO INTENSITY CHANGE
6 12 18 24 36 48 60 72 84 96 108 120 132 144 156 168
------------------------------------------------------------------------------
SAMPLE MEAN CHANGE 1. 2. 3. 4. 6. 8. 9. 10. 11. 12. 12. 13. 14. 14. 15. 16.
SST POTENTIAL 1. 3. 4. 5. 6. 7. 9. 10. 11. 11. 12. 11. 8. 4. 1. -3.
VERTICAL SHEAR MAG -0. 1. 1. 1. 2. 2. 1. 1. 1. 0. -2. -6. -14. -21. -30. -39.
VERTICAL SHEAR ADJ -0. -1. -1. -1. -1. -2. -2. -2. -2. -2. -2. -2. -1. -1. -0. 0.
VERTICAL SHEAR DIR 0. 0. 0. 0. 0. 1. 2. 3. 3. 4. 6. 7. 8. 9. 9. 10.
PERSISTENCE 2. 2. 2. 2. 1. 1. 1. 1. 0. -0. -0. -0. 0. 1. 1. 1.
200/250 MB TEMP. -1. -1. -2. -2. -4. -5. -5. -6. -6. -6. -7. -8. -9. -10. -11. -12.
THETA_E EXCESS 0. 1. 1. 1. 1. 1. 1. 1. 1. 0. 0. 0. -0. -0. -0. 0.
700-500 MB RH 0. 0. -0. -0. -0. -1. -1. -1. -2. -2. -2. -2. -1. -2. -1. -1.
MODEL VTX TENDENCY 0. 0. 0. 2. 2. 2. -3. -11. -17. -18. -21. -9. -7. -7. -10. -8.
850 MB ENV VORTICITY 0. 0. 0. -0. -0. -1. -2. -2. -2. -2. -2. -1. 0. 1. 2. 3.
200 MB DIVERGENCE -0. -0. 0. 0. -0. -0. -0. -0. -0. -0. -0. -0. -0. -1. -1. -1.
850-700 T ADVEC 0. -0. -0. -0. -0. 0. 0. 1. 1. 1. 1. 1. 1. 0. 0. 0.
ZONAL STORM MOTION -0. -0. 0. 0. 1. 1. 1. 1. 2. 3. 3. 3. 3. 3. 3. 3.
STEERING LEVEL PRES 0. 0. 0. 0. 0. 0. 0. 0. 0. 0. 1. 1. 0. 0. 0. 0.
DAYS FROM CLIM. PEAK 0. -0. -0. -0. -0. 0. 0. -0. -0. -0. -0. -0. -0. -0. -0. -0.
GOES PREDICTORS -0. -1. -1. -1. -0. 1. 1. 1. 2. 2. 2. 1. 0. -1. -1. -1.
OCEAN HEAT CONTENT 0. 0. 0. 0. 0. 0. -0. -0. -0. -0. -0. -0. -0. -0. -0. -0.
RI POTENTIAL 1. 2. 4. 5. 7. 7. 5. 3. 1. -1. -3. -4. -4. -4. -5. -5.
------------------------------------------------------------------------------
TOTAL CHANGE 4. 8. 12. 16. 21. 22. 18. 10. 4. 2. -2. 5. -2. -13. -27. -37.
CURRENT MAX WIND (KT): 65. LAT, LON: 23.3 86.3
** 2020 ATLANTIC RI INDEX AL132020 LAURA 08/25/20 12 UTC **
(SHIPS-RII PREDICTOR TABLE for 30 KT OR MOREMAXIMUM WIND INCREASE IN NEXT 24-h)
Predictor Value RI Predictor Range Scaled Value(0-1) % Contribution
12 HR PERSISTENCE (KT) : 10.0 -49.5 to 33.0 0.72 6.8
850-200 MB SHEAR (KT) : 9.0 30.1 to 2.3 0.76 2.7
HEAT CONTENT (KJ/CM2) : 60.6 0.0 to 151.8 0.40 1.4
STD DEV OF IR BR TEMP : 24.0 36.6 to 2.8 0.37 1.5
MAXIMUM WIND (KT) : 65.0 22.5 to 137.5 0.94 2.0
2nd PC OF IR BR TEMP : 0.5 2.9 to -2.9 0.41 1.0
BL DRY-AIR FLUX (W/M2) : 394.2 895.4 to -55.0 0.53 1.3
POT = MPI-VMAX (KT) : 99.2 27.5 to 139.6 0.64 0.6
D200 (10**7s-1) : 33.8 -29.7 to 185.9 0.29 0.2
%area of TPW <45 mm upshear : 0.0 100.0 to 0.0 1.00 0.2
SHIPS Prob RI for 20kt/ 12hr RI threshold= 9% is 1.8 times climatological mean ( 5.0%)
SHIPS Prob RI for 25kt/ 24hr RI threshold= 31% is 2.8 times climatological mean (10.9%)
SHIPS Prob RI for 30kt/ 24hr RI threshold= 18% is 2.6 times climatological mean ( 6.9%)
SHIPS Prob RI for 35kt/ 24hr RI threshold= 13% is 3.4 times climatological mean ( 3.9%)
SHIPS Prob RI for 40kt/ 24hr RI threshold= 13% is 5.0 times climatological mean ( 2.5%)
SHIPS Prob RI for 45kt/ 36hr RI threshold= 15% is 3.4 times climatological mean ( 4.6%)
SHIPS Prob RI for 55kt/ 48hr RI threshold= 13% is 2.9 times climatological mean ( 4.6%)
SHIPS Prob RI for 65kt/ 72hr RI threshold= 17% is 3.2 times climatological mean ( 5.2%)
Matrix of RI probabilities
------------------------------------------------------------------------------
RI (kt / h) | 20/12 | 25/24 | 30/24 | 35/24 | 40/24 | 45/36 | 55/48 |65/72
------------------------------------------------------------------------------
SHIPS-RII: 8.8% 30.6% 17.6% 13.3% 12.5% 15.4% 13.4% 16.7%
Logistic: 7.3% 26.6% 15.4% 11.9% 8.5% 23.0% 21.9% 4.3%
Bayesian: 6.3% 21.2% 7.1% 0.8% 0.3% 5.0% 3.4% 0.0%
Consensus: 7.5% 26.1% 13.4% 8.7% 7.1% 14.5% 12.9% 7.0%
DTOPS: 26.0% 77.0% 49.0% 26.0% 5.0% 9.0% 0.0% 0.0%
## ANNULAR HURRICANE INDEX (AHI) AL132020 LAURA 08/25/20 12 UTC ##
## STORM NOT ANNULAR, SCREENING STEP FAILED, NPASS=3 NFAIL=4 ##
## AHI= 0 (AHI OF 100 IS BEST FIT TO ANN. STRUC., 1 IS MARGINAL, 0 IS NOT ANNULAR) ##
** PROBLTY OF AT LEAST 1 SCNDRY EYEWL FORMTN EVENT AL132020 LAURA 08/25/2020 12 UTC **
TIME(HR) 0-12 12-24(0-24) 24-36(0-36) 36-48(0-48)
CLIMO(%) 2 4( 6) 8( 13) 10( 22) <-- PROB BASED ON INTENSITY ONLY
PROB(%) 0 0( 0) 0( 0) 0( 0) <-- FULL MODEL PROB (RAN NORMALLY)
** DSHIPS INTENSITY FORECAST ADJUSTED RELATIVE TO ONSET OF ERC WEAKENING PHASE **
TIME (HR) 0 6 12 18 24 36 48 60 72 84 96 108 120 132 144 156 168
>24HR AGO (DSHIPS) 65 69 73 77 81 86 62 38 30 28 28 28 38 31 21 DIS DIS
18HR AGO 65 64 68 72 76 81 57 33 25 23 23 23 33 26 16 DIS DIS
12HR AGO 65 62 61 65 69 74 50 26 18 16 16 16 26 19 DIS DIS DIS
6HR AGO 65 59 56 55 59 64 40 16 DIS DIS DIS DIS DIS DIS DIS DIS DIS
NOW CURRENT INTENSITY < 83 KT
IN 6HR INTENSITY IN 6HR < 83 KT
IN 12HR INTENSITY IN 12HR < 83 KT
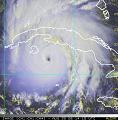
Can't say im shocked by this. the storm is running of time to bomb out to the degree it looked like it could last night. it's a disheveled mess right now
2 likes
Very useful information on the Dvorak Technique --
https://severe.worldweather.wmo.int/TCF ... kBeven.pdf
https://severe.worldweather.wmo.int/TCF ... kBeven.pdf
-
Hurricane Mike
- Category 2

- Posts: 675
- Joined: Tue Apr 10, 2018 7:44 am
Re: ATL: LAURA - Models
Highteeld wrote:
Can't say im shocked by this. the storm is running of time to bomb out to the degree it looked like it could last night. it's a disheveled mess right now
I hope so. It still has quite a while over the Gulf. We don't wanna see it start to ramp up too close to landfall.
1 likes
Re: ATL: LAURA - Models
Hurricane Mike wrote:Highteeld wrote:
Can't say im shocked by this. the storm is running of time to bomb out to the degree it looked like it could last night. it's a disheveled mess right now
I hope so. It still has quite a while over the Gulf. We don't wanna see it start to ramp up too close to landfall.
Personally, I would count on it ramping up into landfall. The only difference now vs last night is the starting intensity (right now) isn't quite as high as it could have been. It has some impacts on downstream intensity, but will still be quite strong. 115 knot landfall wouldn't surprise me.
0 likes
Very useful information on the Dvorak Technique --
https://severe.worldweather.wmo.int/TCF ... kBeven.pdf
https://severe.worldweather.wmo.int/TCF ... kBeven.pdf
-
cheezyWXguy
- Category 5

- Posts: 6282
- Joined: Mon Feb 13, 2006 12:29 am
- Location: Dallas, TX
Re: ATL: LAURA - Models
Hurricane Mike wrote:Highteeld wrote:
Can't say im shocked by this. the storm is running of time to bomb out to the degree it looked like it could last night. it's a disheveled mess right now
I hope so. It still has quite a while over the Gulf. We don't wanna see it start to ramp up too close to landfall.
Not sure this throws a wrench in much. This leveling in intensity was pretty well forecast by the hurricane models last night, and still brought this up to a 4 before landfall. Bet you 12 hours from now people will be saying the opposite of what they're saying now.
2 likes
Re: ATL: LAURA - Models
cheezyWXguy wrote:Hurricane Mike wrote:Highteeld wrote:
Can't say im shocked by this. the storm is running of time to bomb out to the degree it looked like it could last night. it's a disheveled mess right now
I hope so. It still has quite a while over the Gulf. We don't wanna see it start to ramp up too close to landfall.
Not sure this throws a wrench in much. This leveling in intensity was pretty well forecast by the hurricane models last night, and still brought this up to a 4 before landfall. Bet you 12 hours from now people will be saying the opposite of what they're saying now.
To me it changes the realistic ceiling from 135 knot landfall to around 115-120 knots. Catastrophic either way.
3 likes
Very useful information on the Dvorak Technique --
https://severe.worldweather.wmo.int/TCF ... kBeven.pdf
https://severe.worldweather.wmo.int/TCF ... kBeven.pdf
-
shiny-pebble
- Category 1

- Posts: 299
- Joined: Thu Jul 05, 2018 1:38 pm
Re: ATL: LAURA - Models
3 likes
Not an meteorologist! Just someone who is interested in weather. Please refer to the NHC and local weather officials to make decisions.
-Jack
-Jack
-
catskillfire51
- S2K Supporter
- Posts: 480
- Age: 39
- Joined: Sun Aug 26, 2012 5:40 pm
- Location: Lake Jackson, TX
Re: ATL: LAURA - Models
HWRF slight slight shift west but nothing measurable at tx/la border and hmon with a shift east back to SW Louisiana
2 likes
Re: ATL: LAURA - Models
UKmet very close to Galveston

2 likes
Very useful information on the Dvorak Technique --
https://severe.worldweather.wmo.int/TCF ... kBeven.pdf
https://severe.worldweather.wmo.int/TCF ... kBeven.pdf
-
HoustonFrog
- Tropical Depression

- Posts: 98
- Joined: Thu Jun 04, 2020 1:49 pm

Re: ATL: LAURA - Models
HoustonFrog wrote:What time (central) will Euro run?
Should be going soon.
0 likes
Re: ATL: LAURA - Models
Started
0 likes
Very useful information on the Dvorak Technique --
https://severe.worldweather.wmo.int/TCF ... kBeven.pdf
https://severe.worldweather.wmo.int/TCF ... kBeven.pdf


Re: ATL: LAURA - Models
Galveston Bay pretty much on 12Z Euro. The 12Z Euro and Ukmet are pretty close together at landfall.
EDIT...Euro is a bit east of Galveston Bay.
EDIT...Euro is a bit east of Galveston Bay.
Last edited by ATCcane on Tue Aug 25, 2020 1:03 pm, edited 1 time in total.
1 likes
Re: ATL: LAURA - Models
ATCcane wrote:Galveston Bay pretty much on 12Z Euro. They 12Z Euro and Ukmet are pretty close together at landfall.
Two major global models finally stay west for the 12z suite. houston is under the gun even if they aren't in the cone
0 likes
Very useful information on the Dvorak Technique --
https://severe.worldweather.wmo.int/TCF ... kBeven.pdf
https://severe.worldweather.wmo.int/TCF ... kBeven.pdf
Re: ATL: LAURA - Models
Euro bombs to 952 mb by 12z tomorrow
0 likes
Very useful information on the Dvorak Technique --
https://severe.worldweather.wmo.int/TCF ... kBeven.pdf
https://severe.worldweather.wmo.int/TCF ... kBeven.pdf
Re: ATL: LAURA - Models
This would be pushing an ERI phase

0 likes
Very useful information on the Dvorak Technique --
https://severe.worldweather.wmo.int/TCF ... kBeven.pdf
https://severe.worldweather.wmo.int/TCF ... kBeven.pdf
Re: ATL: LAURA - Models
ATCcane wrote:Galveston Bay pretty much on 12Z Euro. The 12Z Euro and Ukmet are pretty close together at landfall.
Where can you see the Euro run? I have been using Tropical Tidbits but not sure the correct acronym
0 likes
Who is online
Users browsing this forum: No registered users and 54 guests