2021 Indicators: SST's / SAL / MSLP / Shear / Steering / Instability / Sat Images

This is the general tropical discussion area. Anyone can take their shot at predicting a storms path.

Moderator: S2k Moderators

Forum rules

The posts in this forum are NOT official forecasts and should not be used as such. They are just the opinion of the poster and may or may not be backed by sound meteorological data. They are NOT endorsed by any professional institution or STORM2K. For official information, please refer to products from the National Hurricane Center and National Weather Service.

Help Support Storm2K
Message
Author
User avatar
CyclonicFury
Category 5
Category 5
Posts: 2025
Age: 26
Joined: Sun Jul 02, 2017 12:32 pm
Location: NC
Contact:

Re: 2021 Indicators: SST's / SAL / MSLP / Shear / Steering / Instability / Sat Images

#2221 Postby CyclonicFury » Wed Aug 04, 2021 1:37 pm

Shell Mound wrote:
CyclonicFury wrote:
Shell Mound wrote:Operative words: “likely” and “maybe.” Recently I have never made a definitive statement without adding qualifiers such as these two.

What about deep-layer shear in the Caribbean during July 2021? I believe it was above average. Do you have access to charts from that period?

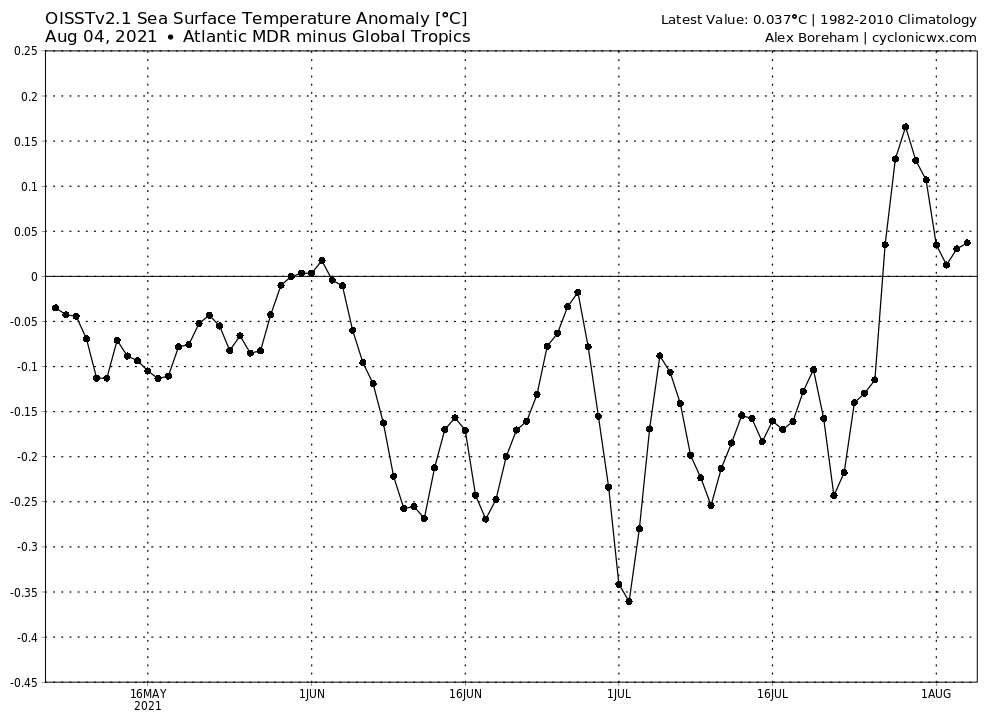
Looks pretty close to average according to this chart:
https://i.imgur.com/mYaABdl_d.webp?maxwidth=640&shape=thumb&fidelity=medium

Do you mind posting the link to the original source? In the near future I would very much like to refer to it as a resource. Thank you.

https://www.cpc.ncep.noaa.gov/products/hurricane/
2 likes   
NCSU B.S. in Meteorology Class of 2021. Tropical weather blogger at http://www.cyclonicfury.com. My forecasts and thoughts are NOT official, for official forecasts please consult the National Hurricane Center.

storminabox
Category 1
Category 1
Posts: 263
Joined: Sun Jul 09, 2017 10:50 pm

Re: 2021 Indicators: SST's / SAL / MSLP / Shear / Steering / Instability / Sat Images

#2222 Postby storminabox » Wed Aug 04, 2021 1:47 pm

Shell Mound wrote:
Iceresistance wrote:Global SST anomalies in the North Atlantic.

The GoM is Boiling at between 29-31°C

https://s6.gifyu.com/images/crw_ssta_natl.png

The subtropics and equatorial regions are still relatively warmer than the MDR and Caribbean, however, so the -AMO “horseshoe” is still in place, despite warming.


It is, but it is FAR less defined than it was say 3-4 weeks ago. It’ll be very interesting to see how this season behaves.
10 likes   

User avatar
SFLcane
S2K Supporter
S2K Supporter
Posts: 10163
Age: 47
Joined: Sat Jun 05, 2010 1:44 pm
Location: Lake Worth Florida

Re: 2021 Indicators: SST's / SAL / MSLP / Shear / Steering / Instability / Sat Images

#2223 Postby SFLcane » Wed Aug 04, 2021 2:14 pm

Hate to say it but we’re still going to have to get past next 2-3 weeks as the epac is slowly loosing its crip very slow transition. There is still a huge TUTT on the long range GEFS anchored in the western Atl. Not expecting anything from current 2 ways high lighted by nhc it’s way to dry and stable.

Image
0 likes   

AlphaToOmega
Category 5
Category 5
Posts: 1448
Joined: Sat Jun 26, 2021 10:51 am
Location: Somewhere in Massachusetts

Re: 2021 Indicators: SST's / SAL / MSLP / Shear / Steering / Instability / Sat Images

#2224 Postby AlphaToOmega » Wed Aug 04, 2021 2:23 pm

Image
Image
Both ensembles show very low wind shear for the subtropical Atlantic. The GEFS shows moderate wind shear for the Caribbean Sea and Gulf of Mexico, and the GEPS shows low wind shear for the Caribbean Sea and the Western Atlantic. The GEFS shows very low wind shear for the MDR, but the GEPS shows very high wind shear for the MDR.
3 likes   

User avatar
captainbarbossa19
Professional-Met
Professional-Met
Posts: 1092
Age: 27
Joined: Wed Aug 21, 2019 11:09 pm
Location: Beaumont, TX

Re: 2021 Indicators: SST's / SAL / MSLP / Shear / Steering / Instability / Sat Images

#2225 Postby captainbarbossa19 » Wed Aug 04, 2021 2:50 pm

SFLcane wrote:Hate to say it but we’re still going to have to get past next 2-3 weeks as the epac is slowly loosing its crip very slow transition. There is still a huge TUTT on the long range GEFS anchored in the western Atl. Not expecting anything from current 2 ways high lighted by nhc it’s way to dry and stable.

https://i.postimg.cc/bNphP5yx/8974-ED6-D-43-CA-49-A7-B673-774891696838.png


That's the thing about August. It's unfavorable one day, and then it's suddenly not. Models are not going to handle the transition well once again I believe. Oddly enough, the GFS is showing less EPAC activity in the next 10 days than the Euro now.
5 likes   

Shell Mound
Category 5
Category 5
Posts: 2434
Age: 32
Joined: Thu Sep 07, 2017 3:39 pm
Location: St. Petersburg, FL → Scandinavia

Re: 2021 Indicators: SST's / SAL / MSLP / Shear / Steering / Instability / Sat Images

#2226 Postby Shell Mound » Thu Aug 05, 2021 6:53 am

Image
It definitely appears that the strong African monsoon will play a role in causing lots of prospective systems to eject northward and head OTS, like the latest wave.
1 likes   
CVW / MiamiensisWx / Shell Mound
The posts in this forum are NOT official forecasts and should not be used as such. They are just the opinion of the poster and may or may not be backed by sound meteorological data. They are NOT endorsed by any professional institution or STORM2K. For official information, please refer to products from the NHC and NWS.

User avatar
SFLcane
S2K Supporter
S2K Supporter
Posts: 10163
Age: 47
Joined: Sat Jun 05, 2010 1:44 pm
Location: Lake Worth Florida

Re: 2021 Indicators: SST's / SAL / MSLP / Shear / Steering / Instability / Sat Images

#2227 Postby SFLcane » Thu Aug 05, 2021 8:08 am

2 likes   

User avatar
SFLcane
S2K Supporter
S2K Supporter
Posts: 10163
Age: 47
Joined: Sat Jun 05, 2010 1:44 pm
Location: Lake Worth Florida

Re: 2021 Indicators: SST's / SAL / MSLP / Shear / Steering / Instability / Sat Images

#2228 Postby SFLcane » Thu Aug 05, 2021 11:19 am

0 likes   

User avatar
SFLcane
S2K Supporter
S2K Supporter
Posts: 10163
Age: 47
Joined: Sat Jun 05, 2010 1:44 pm
Location: Lake Worth Florida

Re: 2021 Indicators: SST's / SAL / MSLP / Shear / Steering / Instability / Sat Images

#2229 Postby SFLcane » Thu Aug 05, 2021 11:30 am

Last edited by SFLcane on Thu Aug 05, 2021 11:40 am, edited 1 time in total.
1 likes   

AlphaToOmega
Category 5
Category 5
Posts: 1448
Joined: Sat Jun 26, 2021 10:51 am
Location: Somewhere in Massachusetts

Re: 2021 Indicators: SST's / SAL / MSLP / Shear / Steering / Instability / Sat Images

#2230 Postby AlphaToOmega » Thu Aug 05, 2021 11:32 am

A warmer than average Caribbean as well as +TNA imply an above-average hurricane season. Interestingly, SSTs near the East Coast are negatively correlated with activity. A global view shows what SST patterns are favorable for active hurricane seasons: -ENSO, -PDO, +TNA, +AMO, and -IOD. A global view of VP patterns shows at -VP over Africa and the Indian Ocean and +VP over the Americas and the East Pacific correlate with active hurricane seasons. There are no surprises here except for positive SSTAs near the East Coast negative impacting hurricane season activity.
Image
Image
Image
3 likes   

Shell Mound
Category 5
Category 5
Posts: 2434
Age: 32
Joined: Thu Sep 07, 2017 3:39 pm
Location: St. Petersburg, FL → Scandinavia

Re: 2021 Indicators: SST's / SAL / MSLP / Shear / Steering / Instability / Sat Images

#2231 Postby Shell Mound » Thu Aug 05, 2021 12:03 pm

0 likes   
CVW / MiamiensisWx / Shell Mound
The posts in this forum are NOT official forecasts and should not be used as such. They are just the opinion of the poster and may or may not be backed by sound meteorological data. They are NOT endorsed by any professional institution or STORM2K. For official information, please refer to products from the NHC and NWS.

User avatar
Category5Kaiju
Category 5
Category 5
Posts: 4097
Joined: Thu Dec 24, 2020 12:45 pm
Location: Seattle

Re: 2021 Indicators: SST's / SAL / MSLP / Shear / Steering / Instability / Sat Images

#2232 Postby Category5Kaiju » Thu Aug 05, 2021 12:09 pm

Using the global measn sst graphic I feel is somewhat misleading, as if you look at the worldwide view of it, you'll notice that it's not just the Atlantic that is below average; it's literally all of the Pacific and Indian Oceans, minus the waters off of Korea, East Russia, Japan, and Alaska.

Image
1 likes   
Unless explicitly stated, all info in my posts is based on my own opinions and observations. Tropical storms and hurricanes can be extremely dangerous. Do not think you can beat Mother Nature. Refer to an accredited weather research agency or meteorologist if you need to make serious decisions regarding an approaching storm.

AlphaToOmega
Category 5
Category 5
Posts: 1448
Joined: Sat Jun 26, 2021 10:51 am
Location: Somewhere in Massachusetts

Re: 2021 Indicators: SST's / SAL / MSLP / Shear / Steering / Instability / Sat Images

#2233 Postby AlphaToOmega » Thu Aug 05, 2021 12:11 pm

Image
3 likes   

User avatar
Category5Kaiju
Category 5
Category 5
Posts: 4097
Joined: Thu Dec 24, 2020 12:45 pm
Location: Seattle

Re: 2021 Indicators: SST's / SAL / MSLP / Shear / Steering / Instability / Sat Images

#2234 Postby Category5Kaiju » Thu Aug 05, 2021 12:16 pm

Image

Image

Unless my eyes are lying to me and I need more than just glasses, it seems to me that there's a pretty clear trend of the MDR and tropical Atlantic warming? I'm not exactly sure where the idea that the Atlantic will be hindered due to cooler than average sst anomalies is coming from (unless it's CDAS?)
4 likes   
Unless explicitly stated, all info in my posts is based on my own opinions and observations. Tropical storms and hurricanes can be extremely dangerous. Do not think you can beat Mother Nature. Refer to an accredited weather research agency or meteorologist if you need to make serious decisions regarding an approaching storm.

User avatar
Woofde
Category 1
Category 1
Posts: 480
Joined: Tue Jul 06, 2021 11:33 am

Re: 2021 Indicators: SST's / SAL / MSLP / Shear / Steering / Instability / Sat Images

#2235 Postby Woofde » Thu Aug 05, 2021 12:18 pm

If we are going to use the Global Mean SSTs maps for judging the Atlantic on it's warmth, then we should use the same metric for the Pacific. Adjusted against the Global Average the Pacific looks like it's in a full blown La Nina.

Sent from my SM-G988U1 using Tapatalk
3 likes   

AlphaToOmega
Category 5
Category 5
Posts: 1448
Joined: Sat Jun 26, 2021 10:51 am
Location: Somewhere in Massachusetts

Re: 2021 Indicators: SST's / SAL / MSLP / Shear / Steering / Instability / Sat Images

#2236 Postby AlphaToOmega » Thu Aug 05, 2021 12:18 pm

The MDR is warmer than the global tropics. Moreover, how many times do I have to say that we have been in a consistent +AMO since February 2019?
6 likes   

User avatar
Category5Kaiju
Category 5
Category 5
Posts: 4097
Joined: Thu Dec 24, 2020 12:45 pm
Location: Seattle

Re: 2021 Indicators: SST's / SAL / MSLP / Shear / Steering / Instability / Sat Images

#2237 Postby Category5Kaiju » Thu Aug 05, 2021 12:21 pm

Don't get me wrong; I sincerely respect Eric Webb and all he has done for the wx community (especially during hurricane season) and his Tweets, graphics, and all of that; but I am not sure if using the global sst mean map is the most efficient way of judging how "warm" or "cool" the Atlantic is and how that relates to activity potential.
3 likes   
Unless explicitly stated, all info in my posts is based on my own opinions and observations. Tropical storms and hurricanes can be extremely dangerous. Do not think you can beat Mother Nature. Refer to an accredited weather research agency or meteorologist if you need to make serious decisions regarding an approaching storm.

AlphaToOmega
Category 5
Category 5
Posts: 1448
Joined: Sat Jun 26, 2021 10:51 am
Location: Somewhere in Massachusetts

Re: 2021 Indicators: SST's / SAL / MSLP / Shear / Steering / Instability / Sat Images

#2238 Postby AlphaToOmega » Thu Aug 05, 2021 12:25 pm

Does anyone have the OISST Global Mean SSTA maps for 2020-08-04, 2019-08-04, 2018-08-04, 2017-08-04, etc...?
0 likes   

User avatar
CyclonicFury
Category 5
Category 5
Posts: 2025
Age: 26
Joined: Sun Jul 02, 2017 12:32 pm
Location: NC
Contact:

Re: 2021 Indicators: SST's / SAL / MSLP / Shear / Steering / Instability / Sat Images

#2239 Postby CyclonicFury » Thu Aug 05, 2021 12:25 pm

Category5Kaiju wrote:Don't get me wrong; I sincerely respect Eric Webb and all he has done for the wx community (especially during hurricane season) and his Tweets, graphics, and all of that; but I am not sure if using the global sst mean map is the most efficient way of judging how "warm" or "cool" the Atlantic is and how that relates to activity potential.

I agree with you. Raw SSTs do matter when it comes to TC genesis, especially in the MDR. Regardless of how it compares to the global mean anomaly, 27°C SSTs would have more thermodynamic potential than 26°C.
4 likes   
NCSU B.S. in Meteorology Class of 2021. Tropical weather blogger at http://www.cyclonicfury.com. My forecasts and thoughts are NOT official, for official forecasts please consult the National Hurricane Center.

User avatar
SFLcane
S2K Supporter
S2K Supporter
Posts: 10163
Age: 47
Joined: Sat Jun 05, 2010 1:44 pm
Location: Lake Worth Florida

Re: 2021 Indicators: SST's / SAL / MSLP / Shear / Steering / Instability / Sat Images

#2240 Postby SFLcane » Thu Aug 05, 2021 12:27 pm

TSR going with 122 ACE seems rather low also reduced there numbers a bit. But they mentioned landfall probability was quite high this season.
1 likes   


Return to “Talkin' Tropics”

Who is online

Users browsing this forum: Noots, RomP and 39 guests