
https://www.nhc.noaa.gov/archive/storm_ ... elim01.gif
Hurricane Allen July 11, 1980 <<<===Moon Path Analog Year (MPAY)
2020 Indicators: SST's / SAL / MSLP / Steering / Shear / Instability / Sat Images
Moderator: S2k Moderators
Forum rules

The posts in this forum are NOT official forecasts and should not be used as such. They are just the opinion of the poster and may or may not be backed by sound meteorological data. They are NOT endorsed by any professional institution or STORM2K. For official information, please refer to products from the National Hurricane Center and National Weather Service.
-
Shell Mound
- Category 5

- Posts: 2434
- Age: 32
- Joined: Thu Sep 07, 2017 3:39 pm
- Location: St. Petersburg, FL → Scandinavia
Re: 2020 Indicators: SST's / SAL / MSLP / Steering / Shear / Instability / Sat Images
TheStormExpert wrote:TCHP definitely continues to rise, heck it’s nearly off the charts near the Cayman Islands and to the south of western Cuba!
I’m assuming they fixed the glitch from earlier this month?
https://i.ibb.co/yhFvHHD/D48-A65-CC-5-E7-D-49-DB-A727-AE328-DD5-E5-FD.jpg
Based on the adjusted data, TCHP still seems greater in 2020 than in either 2005 or 2010. Bear in mind that TCHP is more important than SSTs.
2020:

2010:

2005:

TCHP is a better indicator of the potential for major hurricanes, since it accounts for depth as well as degree of energy available for strong storms.
4 likes
CVW / MiamiensisWx / Shell Mound
The posts in this forum are NOT official forecasts and should not be used as such. They are just the opinion of the poster and may or may not be backed by sound meteorological data. They are NOT endorsed by any professional institution or STORM2K. For official information, please refer to products from the NHC and NWS.
-
Shell Mound
- Category 5
- Posts: 2434
- Age: 32
- Joined: Thu Sep 07, 2017 3:39 pm
- Location: St. Petersburg, FL → Scandinavia
Re: 2020 Indicators: SST's / SAL / MSLP / Steering / Shear / Instability / Sat Images
SFLcane wrote:toad strangler wrote:FireRat wrote:Hopefully we are Molinuno!
Good thing you already got your preps, smart move. This is definitely a good year to have early preps just in case, not a good year to hold off until last minute. Covid could make preparations much more troublesome this year.
I talked about this a month ago. I'm 95% ready for a major hit right now. From gas to food to water to med supplies.... #BePrepared
How can we not be ready after how close SFL came to complete utter devastation with Dorian. I am 100% ready as I always am come June 1.
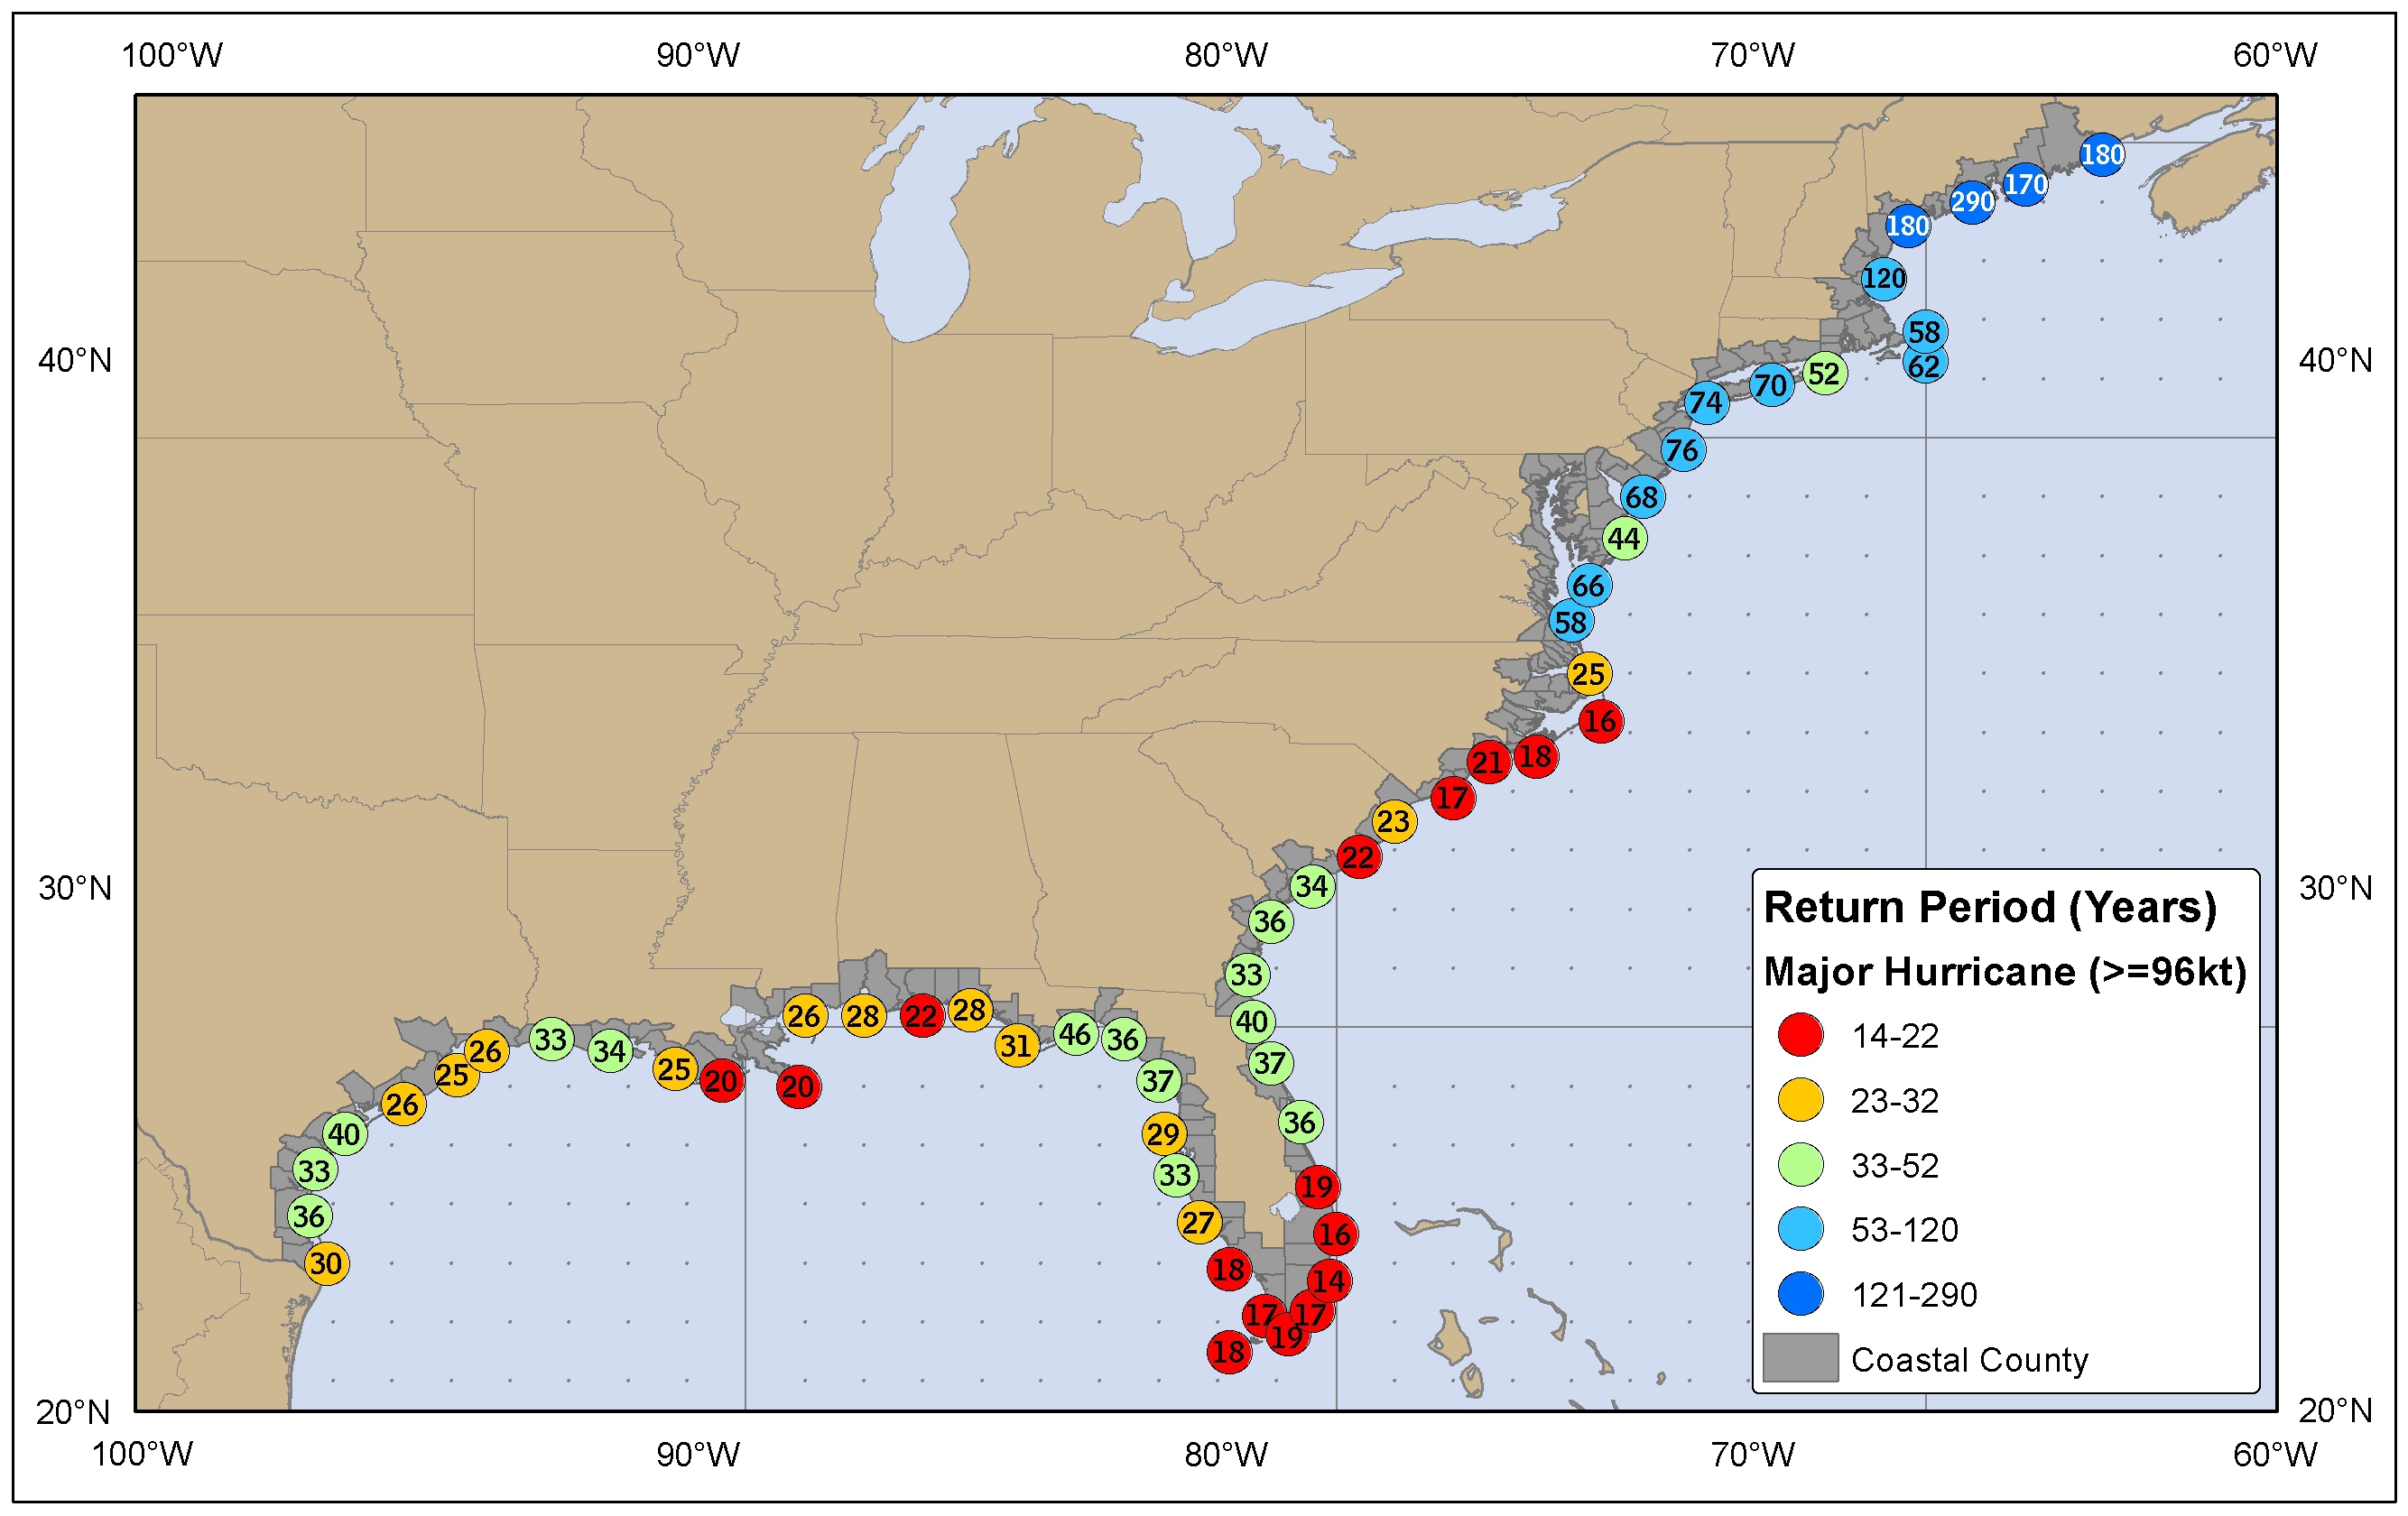
Based on climatology, (mainland) Southeast Florida—that is, the Miami metropolitan area—should have incurred a major-hurricane strike between 2006 and 2009, according to historical return periods. According to NOAA, for the purpose of calculating the rate of return, a MH strike would be defined as passing within 50 n mi (58 mi) of a particular location. (I shall use the City of Miami.) The last system to have done so was Wilma in 2005. If Wilma is not counted, the most recent case was Andrew. Since Andrew, the region (Miami-Dade, Broward, and Palm Beach counties) has been eleven to fourteen years overdue. If Wilma is counted, then the region is just about due, meaning we should expect a MH encounter between 2019 and 2022. So climatology suggests now is the time to be particularly wary, since Southeast Florida is either due or overdue.
0 likes
CVW / MiamiensisWx / Shell Mound
The posts in this forum are NOT official forecasts and should not be used as such. They are just the opinion of the poster and may or may not be backed by sound meteorological data. They are NOT endorsed by any professional institution or STORM2K. For official information, please refer to products from the NHC and NWS.
-
Shell Mound
- Category 5
- Posts: 2434
- Age: 32
- Joined: Thu Sep 07, 2017 3:39 pm
- Location: St. Petersburg, FL → Scandinavia
Re: 2020 Indicators: SST's / SAL / MSLP / Steering / Shear / Instability / Sat Images
Here is a rather astonishing fact: during the four-year period of 2016–19, four Category-4+ hurricanes passed within 100 mi of the State of Florida while at Category-4+ status—one each per year: Matthew (‘16), Irma (‘17), Michael (‘18), and Dorian (‘19). Going back to 1851, I could find no other four-year period with a similar rate of occurrence, aside from the period of 1947–50 (1947 #4, 1948 #8, 1949 #2, and 1950 King). Besides that streak in the late ‘40s, the only other comparable period was that of 1926–30 (1926 #7, 1928 #4, and 1929 #2). Storms in bold both passed within 100 mi of Florida while at Category-4+ status and made landfall in the state as Category-4+ hurricanes. Irma and Michael marked consecutive years with at least one Category-4+ landfall in Florida—something that has been matched or exceeded only once before, in the late ‘40s. Another intriguing pattern, 2016–19 (+‘20?):
Bookend [low-end] C4 (brush) — low-end C4 (LF), low-end C5 (LF) — bookend [high-end] C5 (brush) — high-end C5 LF?
NW Bahamas — Lower Keys (extreme S[E] FL), FL Panhandle (extreme N[W] FL) — NE Bahamas — SE mainland FL?
120 kt / 937 mb — 115 kt / 931 mb — 140 kt / 919 mb — 160 kt / 910 mb — 165 kt / 891 mb?
6-mb/2 difference between 937 and 931 mb — 3
9-mb/2 difference between 919 and 910 mb — 4.5
18-mb/2 difference between 937 and 919 mb — 9
21-mb/2 difference between 931 and 910 mb — 10.5
9(3) = 27/2 = 13.5
10.5(4.5) = 47.25/2 = 23.625
13.5 + 23.625 = 37.125/2 = 18.5625
5-kt/2 difference between 120 and 115 kt — 2.5
20-kt/2 difference between 140 and 160 kt — 10
20-kt/difference between 120 and 140 kt — 10
45-kt/2 difference between 115 and 160 kt — 22.5
10(2.5) = 25/2 = 12.5
22.5(10) = 225/2 = 112.5
12.5 + 112.5 = 125/2 = 62.5
Note that Irma, Michael, and Dorian each made their initial landfalls roughly ~4° longitude apart, forming a right triangle. Connect the dots from Irma’s point of landfall in the Lower Keys to Michael’s in the Panhandle and thence to Dorian’s on Great Abaco Island. The resulting right triangle also reveals a smaller right triangle formed by Matthew’s and Dorian’s respective tracks over the NW and NE Bahamas. Matthew and Dorian made their impacts on the Bahamas almost exactly ~2° longitude distant. Interestingly, Irma and Michael made their landfalls almost exactly ~5° latitude apart, while Matthew and Dorian made theirs on almost exactly the same latitude. Divide 4, 2, and 5 by half, then apply the results to the coordinates. Point of landfall: 25.5°N, 80.5°W. Point of curvature: 27.5°N, 84°W. So, based on this, we may see a very high-end Cat-5 make landfall near Cutler, FL, and then curve toward Pensacola.
Hypothetical outcome
Name: Gonzalo
Status: MH-C5
Wind (kt): 165
Pressure (mb): 891 mb
Landfall: 25.5°N, 80.5°W
Gonzalo 2020? FireRat might be interested. Some of those “worst-case” model runs from Irma’s days may come back to haunt South(-east) Florida in 2020.
4 likes
CVW / MiamiensisWx / Shell Mound
The posts in this forum are NOT official forecasts and should not be used as such. They are just the opinion of the poster and may or may not be backed by sound meteorological data. They are NOT endorsed by any professional institution or STORM2K. For official information, please refer to products from the NHC and NWS.
-
cycloneye

- Admin

- Posts: 145367
- Age: 68
- Joined: Thu Oct 10, 2002 10:54 am
- Location: San Juan, Puerto Rico
Re: 2020 Indicators: SST's / SAL / MSLP / Steering / Shear / Instability / Sat Images
6 likes
Visit the Caribbean-Central America Weather Thread where you can find at first post web cams,radars
and observations from Caribbean basin members Click Here
and observations from Caribbean basin members Click Here
-
Shell Mound
- Category 5
- Posts: 2434
- Age: 32
- Joined: Thu Sep 07, 2017 3:39 pm
- Location: St. Petersburg, FL → Scandinavia
Re: 2020 Indicators: SST's / SAL / MSLP / Steering / Shear / Instability / Sat Images
cycloneye wrote:https://twitter.com/webberweather/status/1277577692108460033
https://twitter.com/supercane7/status/1277577308736499713
https://twitter.com/webberweather/status/1277571715086913537
https://twitter.com/webberweather/status/1277574582606745600
https://twitter.com/webberweather/status/1277591184731488257
https://twitter.com/webberweather/status/1277581417992663042
2 likes
CVW / MiamiensisWx / Shell Mound
The posts in this forum are NOT official forecasts and should not be used as such. They are just the opinion of the poster and may or may not be backed by sound meteorological data. They are NOT endorsed by any professional institution or STORM2K. For official information, please refer to products from the NHC and NWS.
-
'CaneFreak
- Category 5
- Posts: 1486
- Joined: Mon Jun 05, 2006 10:50 am
- Location: New Bern, NC
Re: 2020 Indicators: SST's / SAL / MSLP / Steering / Shear / Instability / Sat Images
Just an observation. The subtropical Western Atlantic Basin has warmed significantly over the past week.
4 likes

Re: 2020 Indicators: SST's / SAL / MSLP / Steering / Shear / Instability / Sat Images
0 likes
Irene '11 Sandy '12 Hermine '16 5/15/2018 Derecho Fay '20 Isaias '20 Elsa '21 Henri '21 Ida '21
I am only a meteorology enthusiast who knows a decent amount about tropical cyclones. Look to the professional mets, the NHC, or your local weather office for the best information.
I am only a meteorology enthusiast who knows a decent amount about tropical cyclones. Look to the professional mets, the NHC, or your local weather office for the best information.
-
toad strangler

- S2K Supporter

- Posts: 4543
- Joined: Sun Jul 28, 2013 3:09 pm
- Location: Earth
- Contact:
Re: 2020 Indicators: SST's / SAL / MSLP / Steering / Shear / Instability / Sat Images
'CaneFreak wrote:Just an observation. The subtropical Western Atlantic Basin has warmed significantly over the past week.
https://coralreefwatch.noaa.gov/data/5km/v3.1/current/daily/gif/cur_coraltemp5km_ssttrend_007d_west.gif
So have the most eastern ENSO regions. I've read that this is likely short lived though. We shall see.
0 likes
My Weather Station
https://www.wunderground.com/dashboard/pws/KFLPORTS603
https://www.wunderground.com/dashboard/pws/KFLPORTS603

Re: 2020 Indicators: SST's / SAL / MSLP / Steering / Shear / Instability / Sat Images
A lot of people still saying that we should see an uptick in July but I am not holding my breath.
The forecast a couple of weeks ago of an uptick in late June and early July because of the passage of a Kelvin wave has been a bust.
https://twitter.com/gtabwx/status/1277517963957059585
The forecast a couple of weeks ago of an uptick in late June and early July because of the passage of a Kelvin wave has been a bust.
https://twitter.com/gtabwx/status/1277517963957059585
0 likes
-
toad strangler
- S2K Supporter
- Posts: 4543
- Joined: Sun Jul 28, 2013 3:09 pm
- Location: Earth
- Contact:
Re: 2020 Indicators: SST's / SAL / MSLP / Steering / Shear / Instability / Sat Images
toad strangler wrote:'CaneFreak wrote:Just an observation. The subtropical Western Atlantic Basin has warmed significantly over the past week.
https://coralreefwatch.noaa.gov/data/5km/v3.1/current/daily/gif/cur_coraltemp5km_ssttrend_007d_west.gif
So have the most eastern ENSO regions. I've read that this is likely short lived though. We shall see.
As soon as I say this.....
http://twitter.com/bennollweather/status/1277610273721815041
0 likes
My Weather Station
https://www.wunderground.com/dashboard/pws/KFLPORTS603
https://www.wunderground.com/dashboard/pws/KFLPORTS603
-
AutoPenalti
- Category 5
- Posts: 4030
- Age: 29
- Joined: Mon Aug 17, 2015 4:16 pm
- Location: Ft. Lauderdale, Florida
Re: 2020 Indicators: SST's / SAL / MSLP / Steering / Shear / Instability / Sat Images
An “uptick in activity” doesn’t necessarily mean uptick in tropical cyclones but rather more robust waves. We’ve seen that already even with an unusually abundant SAL.
8 likes
The posts in this forum are NOT official forecasts and should not be used as such. They are just the opinion of the poster and may or may not be backed by sound meteorological data. They are NOT endorsed by any professional institution or STORM2K. For official information, please refer to products from the NHC and NWS.
Model Runs Cheat Sheet:
GFS (5:30 AM/PM, 11:30 AM/PM)
HWRF, GFDL, UKMET, NAVGEM (6:30-8:00 AM/PM, 12:30-2:00 AM/PM)
ECMWF (1:45 AM/PM)
TCVN is a weighted averaged
-
TheStormExpert
Re: 2020 Indicators: SST's / SAL / MSLP / Steering / Shear / Instability / Sat Images
NDG wrote:A lot of people still saying that we should see an uptick in July but I am not holding my breath.
The forecast a couple of weeks ago of an uptick in late June and early July because of the passage of a Kelvin wave has been a bust.
https://twitter.com/gtabwx/status/1277517963957059585
You can thank Uncle SAL!
1 likes
Re: 2020 Indicators: SST's / SAL / MSLP / Steering / Shear / Instability / Sat Images
AutoPenalti wrote:An “uptick in activity” doesn’t necessarily mean uptick in tropical cyclones but rather more robust waves. We’ve seen that already even with an unusually abundant SAL.
I disagree, TWs have not been impressive at all once the SAL has over the whole MDR.
0 likes
-
Shell Mound
- Category 5
- Posts: 2434
- Age: 32
- Joined: Thu Sep 07, 2017 3:39 pm
- Location: St. Petersburg, FL → Scandinavia
Re: 2020 Indicators: SST's / SAL / MSLP / Steering / Shear / Instability / Sat Images
NDG wrote:AutoPenalti wrote:An “uptick in activity” doesn’t necessarily mean uptick in tropical cyclones but rather more robust waves. We’ve seen that already even with an unusually abundant SAL.
I disagree, TWs have not been impressive at all once the SAL has over the whole MDR.
The waves have been structurally extremely impressive since late May, even though SAL and the TUTT have hindered development. We are still in late June (29 June). Given the near-record TCHP/OHC beneath the surface, I would expect a significant, rapid warming of the SSTs once low-level westerlies return to the MDR by mid-July. If I recall correctly, SSTs actually tend to rebound faster after major SAL outbreaks, especially when the trades slacken. Don’t be surprised if SSTs reach near-record levels by mid- to late July.
1 likes
CVW / MiamiensisWx / Shell Mound
The posts in this forum are NOT official forecasts and should not be used as such. They are just the opinion of the poster and may or may not be backed by sound meteorological data. They are NOT endorsed by any professional institution or STORM2K. For official information, please refer to products from the NHC and NWS.

Re: 2020 Indicators: SST's / SAL / MSLP / Steering / Shear / Instability / Sat Images
Shell Mound wrote:Here is a rather astonishing fact: during the four-year period of 2016–19, four Category-4+ hurricanes passed within 100 mi of the State of Florida while at Category-4+ status—one each per year: Matthew (‘16), Irma (‘17), Michael (‘18), and Dorian (‘19). Going back to 1851, I could find no other four-year period with a similar rate of occurrence, aside from the period of 1947–50 (1947 #4, 1948 #8, 1949 #2, and 1950 King). Besides that streak in the late ‘40s, the only other comparable period was that of 1926–30 (1926 #7, 1928 #4, and 1929 #2). Storms in bold both passed within 100 mi of Florida while at Category-4+ status and made landfall in the state as Category-4+ hurricanes. Irma and Michael marked consecutive years with at least one Category-4+ landfall in Florida—something that has been matched or exceeded only once before, in the late ‘40s. Another intriguing pattern, 2016–19 (+‘20?):
Bookend [low-end] C4 (brush) — low-end C4 (LF), low-end C5 (LF) — bookend [high-end] C5 (brush) — high-end C5 LF?
NW Bahamas — Lower Keys (extreme S[E] FL), FL Panhandle (extreme N[W] FL) — NE Bahamas — SE mainland FL?
120 kt / 937 mb — 115 kt / 931 mb — 140 kt / 919 mb — 160 kt / 910 mb — 165 kt / 891 mb?
6-mb/2 difference between 937 and 931 mb — 3
9-mb/2 difference between 919 and 910 mb — 4.5
18-mb/2 difference between 937 and 919 mb — 9
21-mb/2 difference between 931 and 910 mb — 10.5
9(3) = 27/2 = 13.5
10.5(4.5) = 47.25/2 = 23.625
13.5 + 23.625 = 37.125/2 = 18.5625
5-kt/2 difference between 120 and 115 kt — 2.5
20-kt/2 difference between 140 and 160 kt — 10
20-kt/difference between 120 and 140 kt — 10
45-kt/2 difference between 115 and 160 kt — 22.5
10(2.5) = 25/2 = 12.5
22.5(10) = 225/2 = 112.5
12.5 + 112.5 = 125/2 = 62.5
Note that Irma, Michael, and Dorian each made their initial landfalls roughly ~4° longitude apart, forming a right triangle. Connect the dots from Irma’s point of landfall in the Lower Keys to Michael’s in the Panhandle and thence to Dorian’s on Great Abaco Island. The resulting right triangle also reveals a smaller right triangle formed by Matthew’s and Dorian’s respective tracks over the NW and NE Bahamas. Matthew and Dorian made their impacts on the Bahamas almost exactly ~2° longitude distant. Interestingly, Irma and Michael made their landfalls almost exactly ~5° latitude apart, while Matthew and Dorian made theirs on almost exactly the same latitude. Divide 4, 2, and 5 by half, then apply the results to the coordinates. Point of landfall: 25.5°N, 80.5°W. Point of curvature: 27.5°N, 84°W. So, based on this, we may see a very high-end Cat-5 make landfall near Cutler, FL, and then curve toward Pensacola.
Hypothetical outcome
Name: Gonzalo
Status: MH-C5
Wind (kt): 165
Pressure (mb): 891 mb
Landfall: 25.5°N, 80.5°W
Gonzalo 2020? FireRat might be interested. Some of those “worst-case” model runs from Irma’s days may come back to haunt South(-east) Florida in 2020.
Wow Shell, it will be interesting if there is a pattern that gives FL that horrific scenario. You would think the odds would be against it, but with South FL lucking out in such a way with Dorian and Irma missing Miami/Ft Lauderdale, the luck will probably be tested this season. Lets hope that Irma's 2017 worst case scenario doesn't come back to haunt FL. All of the above numbers and stats you posted above echo my feeling that the major hurricanes that missed Southeast FL during 2016-2019 could be 'warning shots'. More realistically, I could see a Cat 4 strike coming from the south or southeast this year in Sept or Oct... but this is just speculation. If the indicators keep showing risky stuff come late August, then September could be very interesting indeed.
At the current rate of activity, Gonzalo just might end up coming early as well (August) and come September, it might be Marco that becomes the one. Another one of my hunches. We'll see, no matter what happens I hope those of you in Florida are stocked and prepared early just in case this becomes the year.
0 likes
Georges '98, Irene '99, Frances '04, Jeanne '04, Katrina '05, Wilma '05, Gustav '08, Isaac '12, Matthew '16, Florence '18, Michael '18, Ian '22
Re: 2020 Indicators: SST's / SAL / MSLP / Steering / Shear / Instability / Sat Images
Shell Mound wrote:NDG wrote:AutoPenalti wrote:An “uptick in activity” doesn’t necessarily mean uptick in tropical cyclones but rather more robust waves. We’ve seen that already even with an unusually abundant SAL.
I disagree, TWs have not been impressive at all once the SAL has over the whole MDR.
The waves have been structurally extremely impressive since late May, even though SAL and the TUTT have hindered development. We are still in late June (29 June). Given the near-record TCHP/OHC beneath the surface, I would expect a significant, rapid warming of the SSTs once low-level westerlies return to the MDR by mid-July. If I recall correctly, SSTs actually tend to rebound faster after major SAL outbreaks, especially when the trades slacken. Don’t be surprised if SSTs reach near-record levels by mid- to late July.
One thing that the record breaking SAL outbreak is that it has dried them out, during the past 10 days or so much of the Caribbean & western MDR is below average in precipitation.
Like in past years, the SAL outbreaks don't believe in MJO, Kelvin waves, etc, etc. They always seem to win out.

0 likes
-
SFLcane

- S2K Supporter
- Posts: 10163
- Age: 47
- Joined: Sat Jun 05, 2010 1:44 pm
- Location: Lake Worth Florida
Re: 2020 Indicators: SST's / SAL / MSLP / Steering / Shear / Instability / Sat Images
Rather sizable bust from the Euro model concerning precipitation over Africa. Likely wrong also with its hurricane seasonal numbers. 
https://twitter.com/AndyHazelton/status/1277578584215957504
https://twitter.com/AndyHazelton/status/1277578584215957504
0 likes
-
cycloneye
- Admin
- Posts: 145367
- Age: 68
- Joined: Thu Oct 10, 2002 10:54 am
- Location: San Juan, Puerto Rico
Re: 2020 Indicators: SST's / SAL / MSLP / Steering / Shear / Instability / Sat Images
Interesting about the possibbility of waves emerging more north.
https://twitter.com/pppapin/status/1277672256655601664
https://twitter.com/pppapin/status/1277672256655601664
3 likes
Visit the Caribbean-Central America Weather Thread where you can find at first post web cams,radars
and observations from Caribbean basin members Click Here
and observations from Caribbean basin members Click Here
Re: 2020 Indicators: SST's / SAL / MSLP / Steering / Shear / Instability / Sat Images
cycloneye wrote:Interesting aboout the possibbility of waves emerging more north.
https://twitter.com/pppapin/status/1277672256655601664
I agree, not good for AEW's to track further north.
0 likes
Who is online
Users browsing this forum: Bobbyh83 and 53 guests