


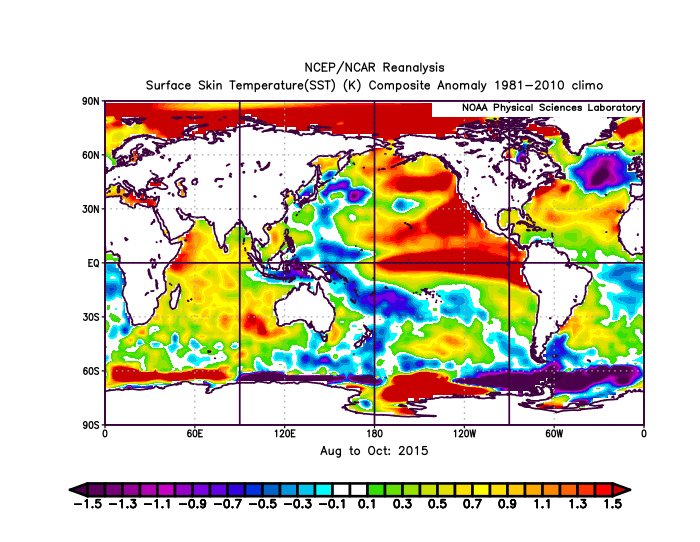
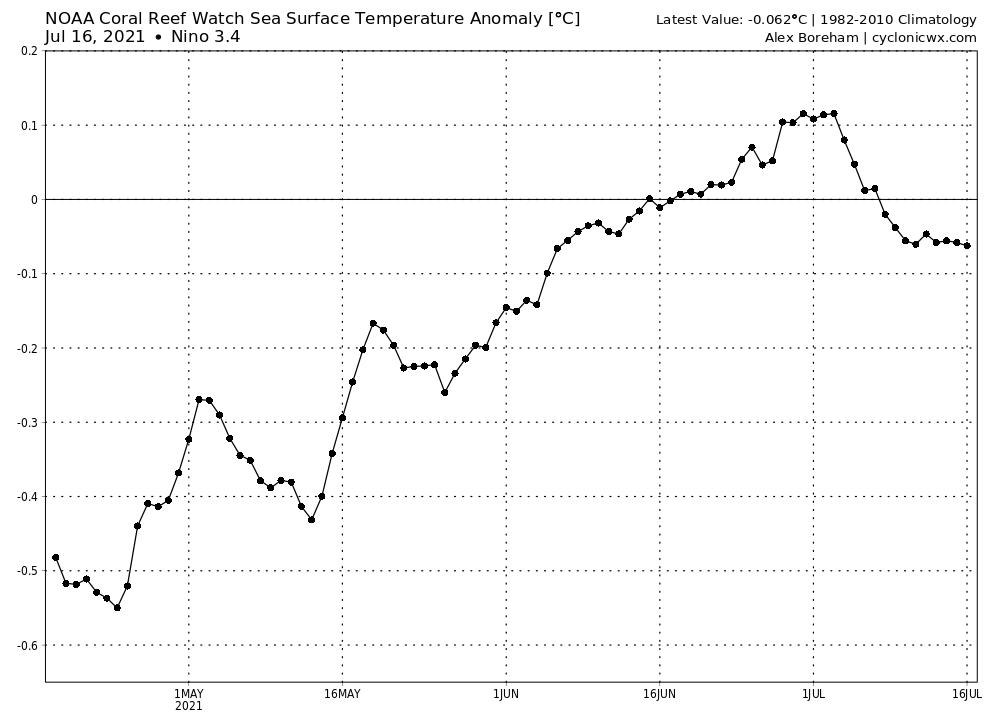
Shell Mound wrote:jconsor wrote:Reanalyses are a poor dataset to use for SST. It's best to use a dataset that is designed for ocean temperatures.
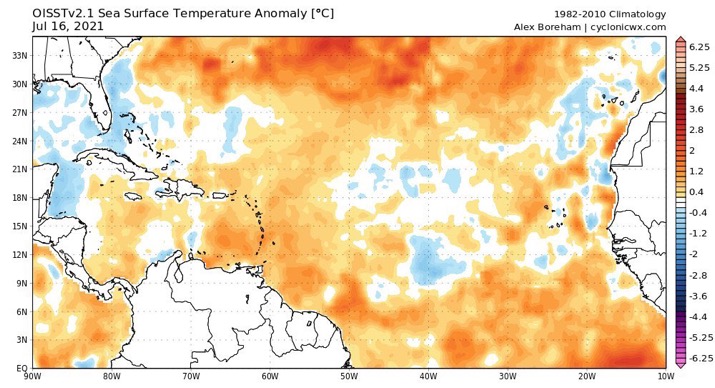
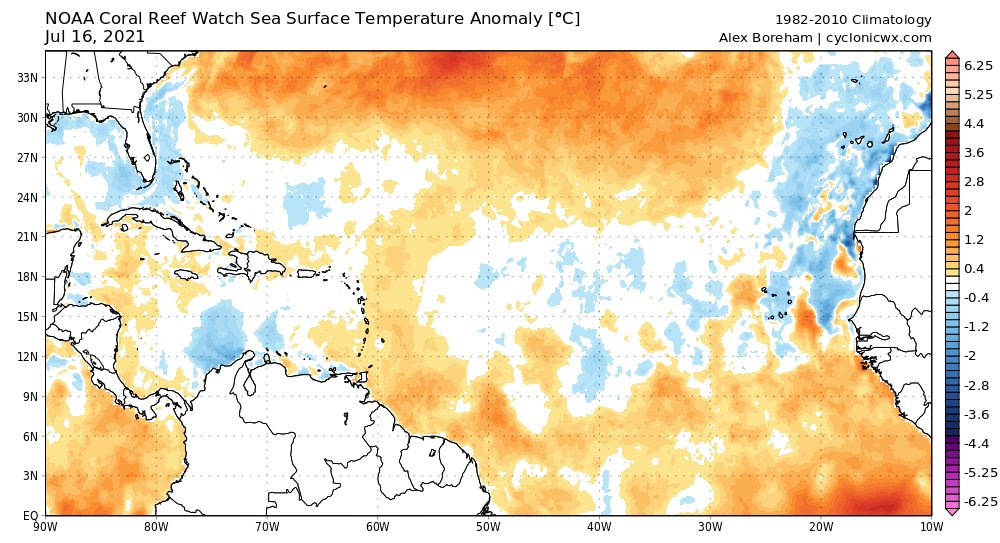
NOAA OI SST maps show that of the five years I mentioned that had Atlantic Niños and a flip from -AMM to +AMM by peak season, two (2008 and 2019) had July MDR SSTs that were slightly warmer than 2021 to date, and three (1996, 1999 and 2003) were cooler. Note that I use a broad definition of the MDR (10 to 20N and 20W to 90W).
https://i.ibb.co/hfp645Z/oisst-anom-14d-tropatl-2021071300.png
https://i.ibb.co/MgH9Gz0/oisst-anom-28d-tropatl-2019073000.png
https://i.ibb.co/YkvCkkY/oisst-anom-28d-tropatl-2008073000.png
https://i.ibb.co/56KtkCj/oisst-anom-28d-tropatl-2003073000.png
https://i.ibb.co/P5TTM9t/oisst-anom-28d-tropatl-1999073000.png
https://i.ibb.co/8jYhz2c/oisst-anom-28d-tropatl-1996073000.pngShell Mound wrote:
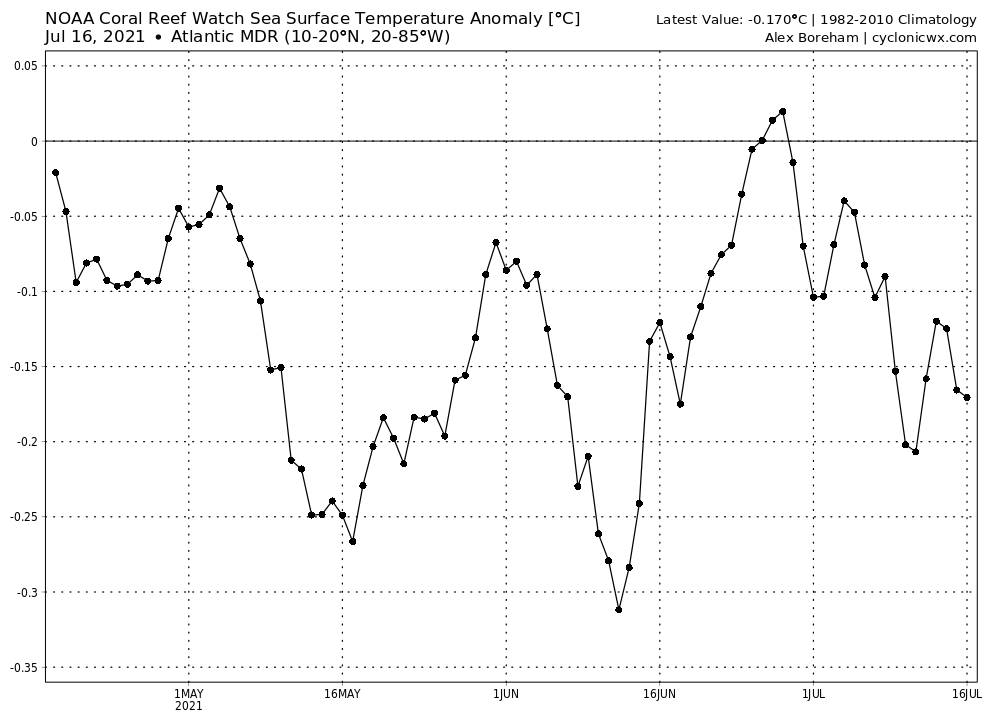
The main problem, then, is that July 2021 to date seems to be much cooler in the MDR and have more of a -AMM/-AMO than any of the years that you mentioned.
https://i.ibb.co/FBsRY5j/Ska-rmavbild-2021-07-15-kl-13-43-25.png
https://i.ibb.co/w4rVwLG/Ska-rmavbild-2021-07-15-kl-13-42-30.png
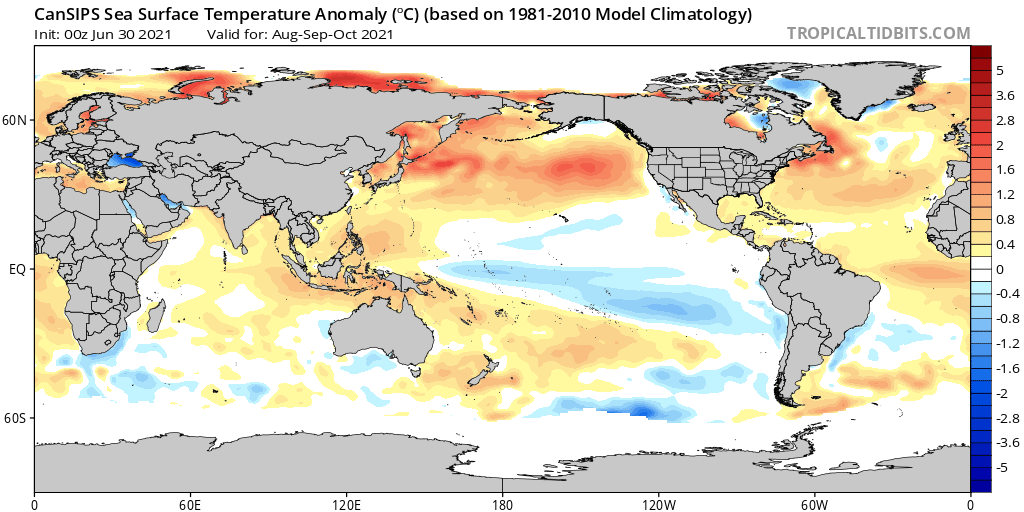
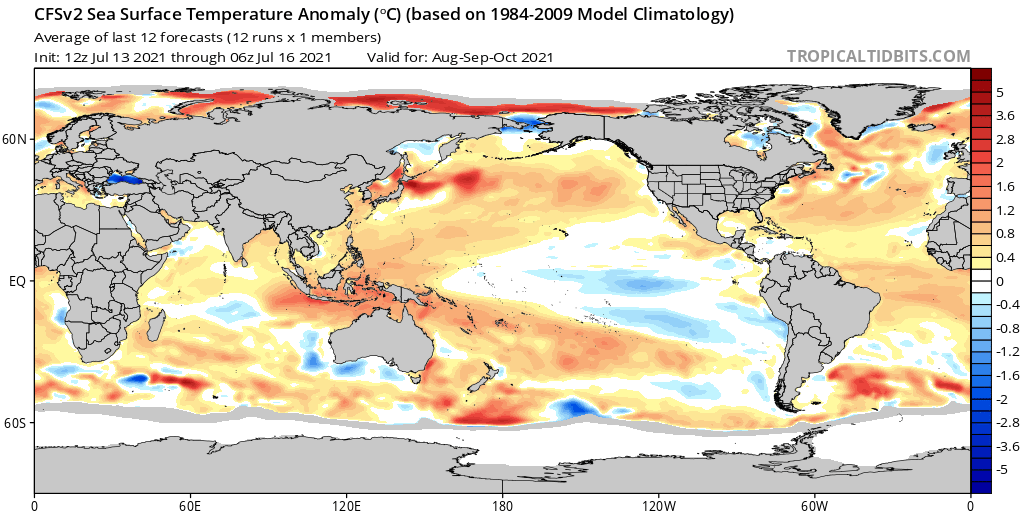
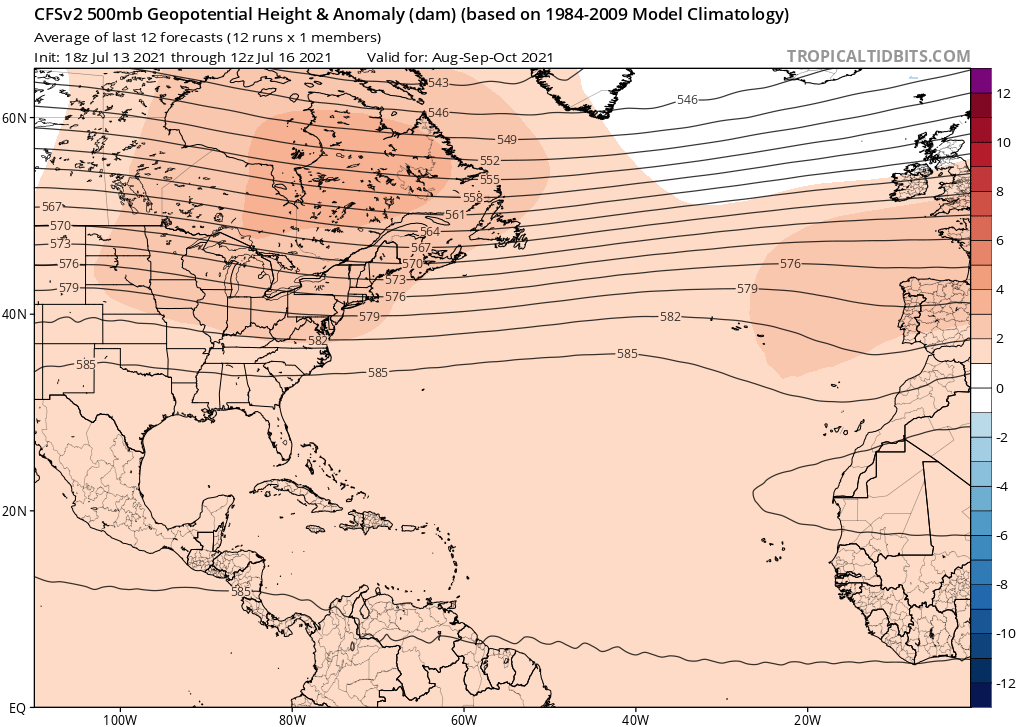
Clearly, 2021 has more of a hurdle to overcome in the AMM/AMO department than any of the other years to date. The -IOD/-ENSO could help somewhat, however.
Thank you for clarifying. Of the five years mentioned, the three that featured a cooler MDR to date ultimately yielded intense long-trackers such as Bertha, Edouard, Fran, Hortense, and Isidore (1996); Cindy, Floyd, and Gert (1999); and Fabian, Isabel, and Kate (2003). In particular, Edouard, Floyd, Gert, Fabian, and Isabel were all at least ≥ 125 kt at their respective peak intensities, and either Edouard or Floyd or both may have briefly attained Cat-5 status. Storms such as these belong to the same class as other intense CV long-trackers like Ivan (2004), Igor (2010), and Irma (2017)—several of which have been notorious “I” storms. Interestingly, the years that featured a cooler MDR than 2021 to date ended up with more intense activity in the MDR than did the two years that were slightly warmer. Additionally, the years that were cooler than 2021 to date ended up with more seasonal ACE (in the range of 166 to 177) than the years that were warmer. Given that 2021 will likely feature -IOD/-ENSO during ASO, the likelihood of a suppressed EPAC should further act to enhance the MDR for long-trackers. We could easily see multiple long-tracking majors in the MDR during ASO, in light of the years mentioned above. An enhanced MDR + projected steering currents favouring peninsular FL and the western Gulf → potentially significant trouble for portions of the CONUS and the southwestern Caribbean. If one takes into account “unofficial” indicators such as this—that happen to reinforce the “official” ones mentioned in this thread—then we could see multiple Cat-4+ threats to portions of the CONUS and Caribbean during ASO. A blend of 1943, 1945, 1949, 1961, 1996, 1999, and 2003 yields some rather unpleasant outcomes, as the following illustration of Category-2+ cyclones from those seasons suggests:
https://i.ibb.co/7JTKBFk/Ska-rmavbild-2021-07-16-kl-17-54-24.png
Note that the favoured regions of impact are the western Gulf Coast (principally TX), the SW Caribbean, southern peninsular FL, and eastern NC.
Also the NE Caribbean.


