When will we see more Arctic Cold?

Winter Weather Discussion

Moderator: S2k Moderators

Forum rules

The posts in this forum are NOT official forecast and should not be used as such. They are just the opinion of the poster and may or may not be backed by sound meteorological data. They are NOT endorsed by any professional institution or STORM2K.

Help Support Storm2K
Message
Author
donsutherland1
S2K Analyst
S2K Analyst
Posts: 2718
Joined: Mon Sep 15, 2003 8:49 pm
Location: New York

Re: When will we see more Arctic Cold?

#101 Postby donsutherland1 » Thu Feb 11, 2010 11:35 am

StormingB81 wrote: Someone on NBC said that Global Warming is causing this. Whic hmakes me really confused on the wole thing.


The recent heavy snowstorms do not prove or disprove climate change. They are the function of a synoptic pattern (severe blocking coupled with an active subtropical jet stream) that is known to be a prolific producer of winter storms. Such patterns have produced notable snowstorms in 1958, 1969, 1978, 1983, etc.
0 likes   

donsutherland1
S2K Analyst
S2K Analyst
Posts: 2718
Joined: Mon Sep 15, 2003 8:49 pm
Location: New York

Re: When will we see more Arctic Cold?

#102 Postby donsutherland1 » Thu Feb 11, 2010 11:36 am

This morning, the Arctic Oscillation was -4.403. That marks the 7th consecutive day on which the AO was -4.000 or below. Only two years have seen a comparable stretch in February:

1969: 8 consecutive days (2/12-19)
1978: 7 consecutive days (2/2-8)

Like Winter 2009-10, both of the above cases occurred during central Pacific-based El Niño winters. Winter 1962-63, a weak La Niña winter, saw a stretch of 6 consecutive days in February (2/1-6).

One of the arguments that has been made in this thread is that after mid-month, there would be a growing risk of a strong shot of cold that would affect an area running from Southeast Texas to Florida, with some areas witnessing a freeze.

If one looks back at Winters 1962-63, 1968-69, and 1977-78, one finds that a strong shot of cold moved into the aforementioned region approximately 11-18 days after the AO first fell to -4.000 or below. This winter, the implied timing would be 2/16-2/23. The idea of such cold during that timeframe is currently supported on the NAEFS and the 2/11 0z GFS ensembles.

Beyond that timeframe, questions arise as to March. In all three cases, the first half of March started with cold in a large part of the East, though the El Niño cases had greater and more widespread cold. The second half of March saw a divergence. In the single La Niña case, warmth overspread the nation. The warmth was great enough to overwhelm any early cold anomalies and the month turned out warmer than normal across much of the country. In the two El Niño cases, the cold predominated in the eastern half of the U.S. With respect to those cases, the cold was more widespread during the stronger, more slowly fading El Niño (1968-69). As a result, for the month as a whole, March 1969 had almost nationwide cold anomalies in the U.S. March 1978 had cold anomalies for the eastern half of the U.S.

With respect to Canada, the three cases provided differing outcomes. Both halves of March 1963 featured cold throughout almost all of Canada. March 1969 featured milder than normal readings during the March 1-15 timeframe, except for southernmost Canada. The warmth was due to strong blocking that continued until near the end of March, something that appears likely this winter, especially given the ongoing major mid-winter stratospheric warming. The second half of March 1969 was colder than normal through most of Canada. The cold was of a sufficient magnitude that all but Atlantic Canada had normal readings or cold anomalies for the month as a whole. March 1978 saw cold predominate across most of Canada during the March 1-15 timeframe, as the blocking ended on March 8. The second half of the month was cold in the eastern half of Canada. For the month as a whole, March 1978 was colder than normal across most of Canada. The coldest anomalies were centered east of the Hudson Bay.

The bottom line is that the current blocking regime may be signaling a cold end to winter and cold start to spring in eastern Canada. That would include Ontario and Quebec. Under such a scenario, the majority of March snowfall would occur during the March 16-31 timeframe.

Using the two El Niño cases for reference, in March 1969 Ottawa picked up 21.1 cm of snow. 76% of that snow fell during the second half of March. April 1-15, 1969 saw 11.4 cm of snow and an additional 7.1 cm of snow fell on April 18. In March 1978, Ottawa received 32.2 cm of snow. 90% of that snow fell during the second half of the month. April 1-15, 1978 saw 11.6 cm of snow.

in March 1969 Montreal picked up 17.3 cm of snow. 81% of that snow fell during the second half of March. April 1-15, 1969 saw an additional 11.0 cm of snow. In March 1978, Montreal received 46.4 cm of snow. 95% of that snow fell during the second half of the month. April 1-15, 1978 saw 7.7 cm of snow.

In any case, the signal offered by the current blocking regime is but one hint of how March might evolve. But for now, the idea is that the eastern half of the USA looks cold for March as a whole and the eastern half of Canada could turn colder than normal for the second half of March.

Before then, the Deep South will likely experience accumulating snow tomorrow into Saturday. It is not out of the realm of possibility that even portions of northernmost Florida would pick up some accumulations.
0 likes   

User avatar
StormingB81
S2K Supporter
S2K Supporter
Posts: 5676
Age: 42
Joined: Thu Aug 27, 2009 1:45 am
Location: Rockledge, Florida

#103 Postby StormingB81 » Thu Feb 11, 2010 6:54 pm

Thank you all for the explanations and I didn't mean to ruffle any feathers. I know its a sticky subject.
0 likes   

User avatar
srainhoutx
S2K Supporter
S2K Supporter
Posts: 6919
Age: 66
Joined: Sun Jan 14, 2007 11:34 am
Location: Haywood County, NC
Contact:

Re: When will we see more Arctic Cold?

#104 Postby srainhoutx » Fri Feb 12, 2010 5:51 pm

Code: Select all

STORM SUMMARY NUMBER 5 FOR SOUTHERN SNOWSTORM
NWS HYDROMETEOROLOGICAL PREDICTION CENTER CAMP SPRINGS MD
300 PM CST FRI FEB 12 2010
 
...RARE WINTER STORM IN PROGRESS ACROSS THE SOUTHERN TIER OF THE
UNITED STATES...
 
WINTER STORM WARNINGS ARE IN EFFECT FROM THE SOUTHERN
LOUISIANA/MISSISSIPPI BORDER AND EXTEND EAST-NORTHEASTWARD THROUGH
SOUTHERN ALABAMA...SOUTHERN GEORGIA...MUCH OF SOUTH CAROLINA...AND
SOUTHERN NORTH CAROLINA. WINTER WEATHER ADVISORIES ARE IN EFFECT
FROM CENTRAL MISSISSIPPI THROUGH NORTHERN ALABAMA...NORTHERN
GEORGIA...EXTREME NORTHWEST SOUTH CAROLINA...AND MUCH OF NORTHERN
NORTH CAROLINA.
 
FOR A DETAILED GRAPHICAL DEPICTION OF THE LATEST
WATCHES...WARNINGS AND ADVISORIES...PLEASE SEE WWW.WEATHER.GOV

AT 300 PM CST...AN AREA OF LOW PRESSURE WITH A CENTRAL PRESSURE OF
997 MB...29.44 INCHES...WAS LOCATED IN THE GULF OF MEXICO 180
MILES WEST-SOUTHWEST OF TAMPA FLORIDA AND WAS MOVING EASTWARD AT
25 MPH. NATIONAL WEATHER SERVICE DOPPLER RADAR AND SURFACE
OBSERVATIONS INDICATED A SHIELD OF MODERATE TO OCCASIONALLY HEAVY
RAINFALL ACROSS THE FLORIDA PANHANDLE...THE CENTRAL AND SOUTHERN
SECTIONS OF THE FLORIDA PENINSULA...AND SOUTHEAST GEORGIA.
SNOWFALL HAS BEEN RECENTLY REPORTED FROM EASTERN MISSISSIPPI
ACROSS ALABAMA...THE NORTHWEST HALF OF GEORGIA...AND EASTERN
TENNESSEE...AND EXTREME WESTERN NORTH CAROLINA.

...SELECTED STORM TOTAL SNOWFALL IN INCHES FROM 200 AM CST THU FEB
11 THROUGH 300 PM CST THU FEB 12...

...ALABAMA...
BELLEVILLE                            6.0                     
BRANTLEY                              5.0                     
EVERGREEN 5 N                         5.0                     
THOMASVILLE                           5.0                     
LOTTIE                                4.5                     
PINSON                                4.0                     
TROY                                  4.0                     
RAMER                                 3.5                     
AUBURN                                3.0                     
GREENVILLE                            3.0                     
HAYNEVILLE                            3.0                     
LUCEDALE                              3.0                     
TENSAW                                3.0                     

...GEORGIA...
CUTHBERT                              2.0                     
FORT GAINES                           1.0                     
DAWSON                                0.5                     

...MISSISSIPPI...
DE KALB                               8.0                     
CATAHOULA                             5.0                     
VICKSBURG                             5.0                     
BRANDON 1.9 NE                        4.6                     
MADISON 1.1 SW                        4.5                     
RAYVILLE                              4.2                     
BROOKHAVEN                            4.0                     
MCCALL CREEK 5 W                      4.0                     
FOREST                                3.5                     
PORT GIBSON 6 NW                      3.5                     

...SELECTED STORM TOTAL FREEZING RAIN ICE AMOUNTS IN INCHES FROM
200 AM CST THU FEB 11 THROUGH 300 PM CST THU FEB 12...

...ALABAMA...
ARITON                                4.00                     
IRONDALE                              0.30                     

...SELECTED PEAK WIND GUSTS IN MILES PER HOUR EARLIER IN THE
EVENT...

...FLORIDA...
CLEARWATER                              51                     
SAINT PETERSBURG                        45                     

...SELECTED STORM TOTAL SNOWFALL IN INCHES WHERE THE EVENT HAS
ENDED...

...ARKANSAS...
FOREMAN                               4.0                     
TEXARKANA 1 N                         4.0                     
ASHDOWN                               3.0                     
MENA                                  3.0                     
AMITY 1 N                             2.5                     
VANDERVOORT                           2.5                     
DE QUEEN                              2.0                     
HAMPTON                               2.0                     
FORDYCE 6.6 NNW                       1.8                     

...LOUISIANA...
SHREVEPORT 9.1 SE                     6.1                     
NATCHITOCHES 0.9 NE                   6.0                     
SHONGALOO 5 N                         6.0                     
SICILY ISLAND 3.3 WNW                 6.0                     
GOLDONNA 8.8 SSW                      5.6                     
MONROE                                5.0                     
PLAIN DEALING 3.3 ESE                 5.0                     
HOMER 1.2 N                           3.7                     
WEST MONROE 6.1 WSW                   3.5                     

...OKLAHOMA...
HAWORTH 4 SW                          7.5                     
IDABEL 8 SE                           7.5                     
ADA 0.3 NNW                           5.6                     
RATTAN 13 E                           4.5                     
LOCO 0.9 SE                           4.3                     
CORINNE                               3.5                     
FORT TOWSON 1 W                       3.5                     
SULPHUR 2.5 WSW                       3.5                     
CANEY 7 W                             3.0                     
CAMDEN 1.8 NNW                        2.0                     

...TEXAS...
DUNCANVILLE 1.7 NNW                  14.9                     
HASLET                               14.2                     
FORT WORTH                           12.6                     
DALLAS                               12.5                     
MANSFIELD 2.6 NNE                    12.2                     
BRIDGEPORT                           12.0                     
ROYSE CITY                           12.0                     
SANGER 1.8 WSW                       12.0                     
MESQUITE 3.3 ESE                     11.4                     
NORTH RICHLAND HILLS 1.9 NE          11.3                     

THE SNOW WHICH FELL IN DALLAS TEXAS ESTABLISHED AN ALL-TIME 24
HOUR AND DAILY SNOWFALL RECORD FOR FEBRUARY 11.  WICHITA FALLS
TEXAS HAS ESTABLISHED A NEW ALL-TIME SEASONAL SNOWFALL RECORD OF
15.0 INCHES...BREAKING THE RECORD PREVIOUSLY ESTABLISHED DURING
THE WINTER OF 1957-1958.

THIS SURFACE LOW WILL PROGRESS EAST-NORTHEAST THROUGH THE FLORIDA
PENINSULA THIS EVENING AND OFFSHORE THE CAROLINAS DURING THE DAY
SATURDAY. ACROSS MUCH OF THE SOUTHEAST...A POLAR AIR MASS IN PLACE
WILL ALLOW WIDESPREAD MODERATE TO HEAVY SNOW TO FALL. SNOW
ACCUMULATIONS OF 2 TO 4 INCHES...WITH LOCALLY HIGHER AMOUNTS...ARE
POSSIBLE IN AN AREA EXTENDING FROM SOUTHERN GEORGIA EAST
NORTHEASTWARD THROUGH THE EASTERN CAROLINAS.

THE NEXT STORM SUMMARY WILL BE ISSUED BY THE HYDROMETEOROLOGICAL
PREDICTION CENTER AT 1000 PM EST. PLEASE REFER TO YOUR LOCAL
NATIONAL WEATHER SERVICE OFFICE FOR ADDITIONAL INFORMATION ON THIS
EVENT.

ROTH

0 likes   
Carla/Alicia/Jerry(In The Eye)/Michelle/Charley/Ivan/Dennis/Katrina/Rita/Wilma/Ike/Harvey

Member: National Weather Association
Wx Infinity Forums
http://wxinfinity.com/index.php

Facebook.com/WeatherInfinity
Twitter @WeatherInfinity

User avatar
srainhoutx
S2K Supporter
S2K Supporter
Posts: 6919
Age: 66
Joined: Sun Jan 14, 2007 11:34 am
Location: Haywood County, NC
Contact:

Re: When will we see more Arctic Cold?

#105 Postby srainhoutx » Sat Feb 13, 2010 10:25 am

Code: Select all

STORM SUMMARY NUMBER 8 FOR SOUTHERN SNOWSTORM
NWS HYDROMETEOROLOGICAL PREDICTION CENTER CAMP SPRINGS MD
1000 AM EST SAT FEB 13 2010
 
...RARE WINTER STORM COMING TO AN END ACROSS THE SOUTHEASTERN
UNITED STATES...
 
WINTER STORM WARNINGS ARE IN EFFECT FOR EASTERN NORTH CAROLINA
WITH A WINTER WEATHER ADVISORY IN EFFECT FOR EXTREME NORTHEASTERN
NORTH CAROLINA.
 
FOR A DETAILED GRAPHICAL DEPICTION OF THE LATEST
WATCHES...WARNINGS AND ADVISORIES...PLEASE SEE WWW.WEATHER.GOV

AT 900 AM EST...AN AREA OF LOW PRESSURE WITH A CENTRAL PRESSURE OF
986 MB...29.12 INCHES...WAS LOCATED 250 MILES EAST OF THE NORTH
CAROLINA OUTER BANKS...AND MOVING STEADILY OUT TO SEA. NATIONAL
WEATHER SERVICE DOPPLER RADAR AND SURFACE OBSERVATIONS INDICATED
LIGHT SNOW FALLING OVER THE COASTAL PLAIN AND OUTER BANKS OF NORTH
CAROLINA NORTHWARD INTO SOUTHEASTERN VIRGINIA.

...SELECTED STORM TOTAL SNOWFALL IN INCHES FROM 1200 AM EST THU
FEB 11 THROUGH 900 AM EST SAT FEB 13...

...NORTH CAROLINA  ...
HARKERS ISLAND 3.2 NE                 8.8                     
HAVELOCK 2.7 S                        8.5                     
BEAUFORT                              7.0                     
NEWPORT                               7.0                     
SEA LEVEL                             7.0                     
OUTLAND 4 S                           6.8                     
WINTERVILLE 3.5 W                     6.4                     
CAPE CARTERET                         6.2                     
BETTIE                                6.0                     
BURGAW                                6.0                     
JACKSONVILLE                          6.0                     
MOREHEAD CITY                         6.0                     
GREENVILLE                            5.8                     
MOUNT OLIVE 6 SE                      5.5                     
WHITEVILLE 5 SE                       5.3                     
WHORTONSVILLE                         5.3                     

...VIRGINIA...
FRANKLIN                              2.2                     
CARRSVILLE 0.6 SW                     2.0                     
ALBERTA                               1.9                     
SAXE 4.3 SE                           1.8                     

...SELECTED STORM TOTAL SNOWFALL IN INCHES WHERE THE EVENT HAS
ENDED...

...ALABAMA...
BELLEVILLE                            6.0                     
BRANTLEY                              5.0                     
EVERGREEN 5 N                         5.0                     
THOMASVILLE                           5.0                     
EUFAULA 4 S                           4.5                     
LOTTIE                                4.5                     
MONROEVILLE 0.6 SSW                   4.1                     
ARITON                                4.0                     
PINSON                                4.0                     
RAMER                                 4.0                     
TROY                                  4.0                     
WARD                                  4.0                     

...ARKANSAS...
FOREMAN                               4.0                     
TEXARKANA 1 N                         4.0                     
ASHDOWN                               3.0                     
MENA                                  3.0                     
AMITY 1 N                             2.5                     
VANDERVOORT                           2.5                     
DE QUEEN                              2.0                     
HAMPTON                               2.0                     
FORDYCE 6.6 NNW                       1.8                     

...FLORIDA...
BERRYDALE                             2.0                     
MUNSON                                2.0                     
JAY                                   1.0                     

...GEORGIA...
LUMPKIN                               6.0                     
WASHINGTON 1.9 NE                     5.8                     
LOGANVILLE 4 SSE                      5.3                     
NICHOLSON 4.9 SE                      4.8                     
ATHENS 3.2 NW                         4.6                     
LA GRANGE 10.6 ESE                    4.5                     
WATKINSVILLE 1.6 ENE                  4.4                     
ROCKMART 9.6 SSE                      4.3                     
TALBOTTON                             4.0                     
HAMILTON 5 W                          3.5                     
VILLA RICA                            3.5                     
SENOIA 2 N                            3.0                     
DACULA                                2.5                     
CUTHBERT                              2.0                     
MACON                                 2.0                     
ROME                                  2.0                     

...LOUISIANA...
SHREVEPORT 9.1 SE                     6.1                     
NATCHITOCHES 0.9 NE                   6.0                     
SHONGALOO 5 N                         6.0                     
SICILY ISLAND 3.3 WNW                 6.0                     
GOLDONNA 8.8 SSW                      5.6                     
MONROE                                5.0                     
PLAIN DEALING 3.3 ESE                 5.0                     
HOMER 1.2 N                           3.7                     
WEST MONROE 6.1 WSW                   3.5                     

...MISSISSIPPI...
DE KALB                               8.0                     
BUDE                                  6.5                     
VICKSBURG                             6.3                     
BROOKHAVEN                            6.0                     
NATCHEZ                               6.0                     
PETAL                                 6.0                     
BRANDON                               5.0                     
CATAHOULA                             5.0                     
MADISON                               5.0                     
BRANDON 1.9 NE                        4.6                     
MERIDIAN                              4.5                     
MCCALL CREEK 5 W                      4.0                     

...OKLAHOMA...
HAWORTH 4 SW                          7.5                     
IDABEL 8 SE                           7.5                     
ADA 0.3 NNW                           5.6                     
RATTAN 13 E                           4.5                     
LOCO 0.9 SE                           4.3                     
CORINNE                               3.5                     
FORT TOWSON 1 W                       3.5                     
SULPHUR 2.5 WSW                       3.5                     
CANEY 7 W                             3.0                     
CAMDEN 1.8 NNW                        2.0                     

...SOUTH CAROLINA...
SUMMERVILLE 3.8 NE                    8.2                     
COLUMBIA                              7.3                     
BAMBERG                               7.0                     
BOWMAN                                7.0                     
EVANS 1 SE                            7.0                     
LEXINGTON 1.6 WNW                     7.0                     
OAK GROVE 1 SE                        7.0                     
OATLAND 8 N                           7.0                     
SMOAKS                                7.0                     
HEMINGWAY                             6.8                     
SANGAREE                              6.5                     
ORANGEBURG                            6.0                     
DARLINGTON                            5.0                     
BLYTHE                                4.0                     
CHARLESTON                            3.3                     
BEAUFORT                              3.0                     

...TEXAS...
DUNCANVILLE 1.7 NNW                  14.9                     
HASLET                               14.2                     
FORT WORTH                           12.6                     
DALLAS                               12.5                     
MANSFIELD 2.6 NNE                    12.2                     
BRIDGEPORT                           12.0                     
ROYSE CITY                           12.0                     
SANGER 1.8 WSW                       12.0                     
MESQUITE 3.3 ESE                     11.4                     
NORTH RICHLAND HILLS 1.9 NE          11.3                     

...SELECTED STORM TOTAL FREEZING RAIN IN INCHES WHERE THE EVENT
HAS ENDED...

...ALABAMA...
IRONDALE                              0.30                     


SNOW WILL COME TO AN END TODAY ACROSS NORTH CAROLINA AND VIRGINIA
AS THE SURFACE LOW PROGRESSES QUICKLY TO THE EAST-NORTHEAST OUT TO
SEA. AN ADDITIONAL INCH OR TWO OF SNOW ACCUMULATION IS POSSIBLE
ACROSS NORTHEASTERN NORTH CAROLINA AND EXTREME SOUTHEASTERN
VIRGINIA BEFORE THE SNOW COMES TO AN END THIS AFTERNOON.

THIS WILL BE THE LAST STORM SUMMARY ISSUED BY THE
HYDROMETEOROLOGICAL PREDICTION CENTER FOR THIS EVENT. PLEASE REFER
TO YOUR LOCAL NATIONAL WEATHER SERVICE OFFICE FOR ADDITIONAL
INFORMATION.

RYAN


PRELIMINARY EXTENDED FORECAST DISCUSSION
NWS HYDROMETEOROLOGICAL PREDICTION CENTER CAMP SPRINGS MD
744 AM EST SAT FEB 13 2010

VALID 12Z WED FEB 17 2010 - 12Z SAT FEB 20 2010

INTENSE POSITIVE HT ANOMALIES CONT THRU THIS PERIOD NEAR CAPE
FAREWELL AND OVER THE SERN AK PANHANDLE KEEPING UP THE STRONG
PERSISTENT NEG AO/NAO PATTERN. REASONABLE MODEL AGREEMENT
CONTINUES THRU DAY 5 THURSDAY OF A NEAR NEUTRAL TO SLIGHTLY
POSITVE PNA PATTERN BY GFS AND GFS ENS GUIDANCE. DIFFERENCES SHOW
UP BY DAY 6 FRIDAY ONWARD AS GFS AND ITS ENS MEAN TO SOME EXTENT
UNDER CUT THE WRN CONUS COASTAL RIDGING RESULTING IN A NERN
PACIFIC REX BLOCK WITH CONSIDERABLE SRN STREAM FLOW COMING ACROSS
THE SRN TIER OF CONUS. IN THIS STRONG EL NINO YEAR THIS REMAINS
POSSIBLE. CURRENT MJO PHASE 8 AND ENTERING PHASE 1 WHILE WEAKENING
INTO INDETERMINATE STATUS LEAVES A RELATIVELY POOR MATCH TO D+8
GUIDANCE OF GFS OR ECMWF. THESE DIFFER LATE PERIOD AND INTO THE
DAY 8 AND BEYOND BY GFS KEEPING UP A STRONGER SRN STREAM AS
MENTIONED PREVIOUSLY WHILE BOTH MODELS AND CMC KEEP UP THE STRONG
POSITIVE HT ANOMALIES NEAR LOWER DAVIS STRAIT AND THE SRN AK
PENINSULA. ECMWF KEEPS UP MUCH MORE OF A STRONGER DOMINANT
AMPLIFIED PNA PATTERN. D+8 ANALOGS OF GFS/ECMWF/CMC LIKE FEB 63
AND 68 BOTH OF WHICH HAD A VERY AMPLIFIED PNA PATTERN AND A SRN
STREAM CONNECTION AT THE ANALOG TIME FRAME..A HYBRID OF THE TWO
MODEL SOLUTIONS LATE PERIOD. HOWEVER THESE WERE BOTH NON EL NINO
YEARS. GOING A BIT FARTHER TO THE D+11 TIME FRAME GFS/CMC SERIES
TARGET AND HAVE BEEN TARGETING FOR QUITE A WHILE FEB 1978 AND
ESPECIALLY FEB 1958 WHICH WERE INFAMOUS ERN CONUS WINTERS AND WERE
WARM ENSO EL NINO YEARS LIKE TEH CURRENT ONE. THE INFLUENCE OF THE
STRONG NEG A0/NAO AND ITS CORRESPONDING PARTNER THE POSITIVE PNA
HAS BEEN THE LEADING INFLUENCE OVER NOAM THIS WINTER WITH A VERY
SIGNIFICANT MOISTURE FEED FROM THE SRN STREAM. PREFER THE
AMPLIFIED ECMWF ENS MEAN WITH SOME ADDITION OF THE GFS ENS MEAN
WHICH IS MORE AMPLIFIED THAN ITS OP RUN FOR DAYS 6 AND 7 FRI/SAT
WITH THIS BEING THE PREVAILING PATTERN.

HPC PRELIMS 50/50 OP ECMWF/GFS DAYS 3 AND 4 TUES/WED WITH
INCREASING INCORPORATION OF ENS MEANS DOMINATED BY ECMWF ENS MEAN
DAYS 5-7 THURS-SAT.

MID LEVEL CLOSED LOW AND SFC REFLECTION SWINGS OFF THE NORTHEAST
COAST DAY 3 TUES ROTATING UP TO THE ST LAWRENCE RIVER VALLEY WHERE
IT BECOMES A LOCKED IN FEATURE. THIS SPREADS A MODERATE SNOW INTO
NEW ENG WITH CONTINUOUS COLD ADVECTION FLOW AND WELL BELOW NORMAL
TEMPS OVER THE ERN THIRD OF CONUS WITH LAKE EFFECT SNOWS AND UP
SLOPE SNOWS INTO THE NRN AND CENTRAL APPLCHNS INTO DAY 5 THURSDAY.
SHORTWAVE ENERGY COMING ACROSS THE SOUTHWEST AND SRN PLAINS FRI
AND SAT WITH A ECMWF/ECMWF ENS MEAN PREFERENCE BREAKS OUT TX TO TN
VALLEY PCPN THE NRN PORTION OF WHICH WILL NEED TO BE CLOSELY
WATCHED FOR WINTER TYPE PCPN. THIS WILL SPREAD EWD INTO MUCH OF
ERN CONUS DAY 8 SUNDAY.

WESTWARD WET CONDS WELL AGREED UPON NRN CA AND PAC NORTHWEST INTO
THE NRN ROCKIES DAY 3 TUES WITH ROCKIES SNOWS WED AND THURS.
PREFER THE DRIER PATTERN OF ECMWF/ECMWF ENS MEAN OVER THE WEST
COAST LATE PERIOD. HIGH PRESSURE DROPS SOUTHWARD THRU THE PLAINS
WED TO SAT REINFORCING SEASONABLY COLD WEATHER.
ROSENSTEIN
0 likes   
Carla/Alicia/Jerry(In The Eye)/Michelle/Charley/Ivan/Dennis/Katrina/Rita/Wilma/Ike/Harvey

Member: National Weather Association
Wx Infinity Forums
http://wxinfinity.com/index.php

Facebook.com/WeatherInfinity
Twitter @WeatherInfinity

donsutherland1
S2K Analyst
S2K Analyst
Posts: 2718
Joined: Mon Sep 15, 2003 8:49 pm
Location: New York

#106 Postby donsutherland1 » Sun Feb 14, 2010 7:00 pm

Historic Winter Blocking Continues…

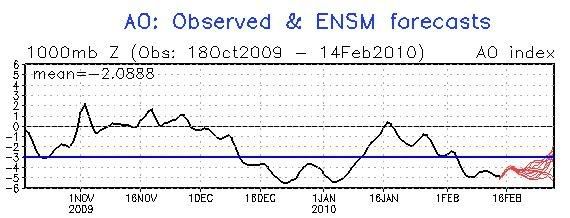
Today, the Arctic Oscillation was -5.048. That marks the 14th day this winter that the AO registered -5.000 or below. To put things into perspective, that destroys the previous record of 9 days during Winter 1976-77. It is also more than 40% of the 32 prior days on which the AO reached that level in the 1950-2009 timeframe.

Looking ahead, the ensembles continue to suggest strong blocking will persist through the extended range. Most of the guidance suggests that the AO will remain at or below -3.000 through the extended range.

Image

The composite 500 mb height anomalies for the February 15-March 15 timeframe for all dates on which the AO was -3.000 or below (1950-2009) were:

Image

The extended range of the GFS ensemble 500 mb mean anomalies closely resembles the composite pattern:

Image

That translates into cold weather for the eastern half of the U.S. into parts of Canada:

Image

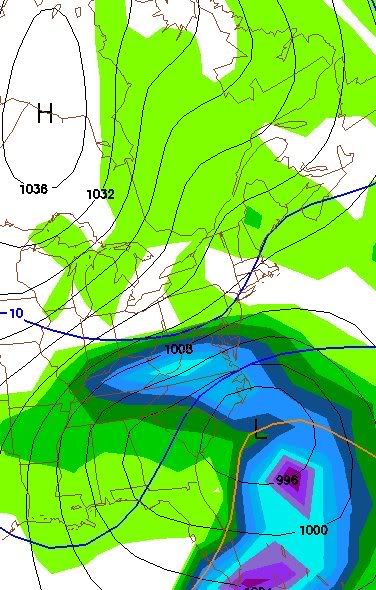
Given the strong likelihood of blocking—and the recent major midwinter warming of the stratosphere should facilitate a continuation of the blocking—any southern stream systems that should develop during the closing week of February into the first week of March are more likely to move off the U.S. East Coast than to cut to the Great Lakes. As a result, something along the lines of the 288-hour solution on the 2/14 18z run of the GFS is more likely than the 348-hour solution shown on the 2/14 12z run of that model.

2/14/2010 12z GFS: 348 Hours:
Image

2/14/2010 18z GFS: 288 Hours:
Image

In short, the Mid-Atlantic region’s snow pause does not mark the end of the winter there. Instead, given the continued strong blocking, another KU-type snowstorm remains a realistic prospect. Moreover, given the seasonal migration of the jet stream, southern New England could also benefit from any late February-early March Miller A storms.
0 likes   

User avatar
srainhoutx
S2K Supporter
S2K Supporter
Posts: 6919
Age: 66
Joined: Sun Jan 14, 2007 11:34 am
Location: Haywood County, NC
Contact:

Re: When will we see more Arctic Cold?

#107 Postby srainhoutx » Sun Feb 14, 2010 7:08 pm

Thanks for the Update Don. What an amazing blocking regime to watch since November! For those that follow Long Range forecasting, this has been a very memorable event and one not seen in many years.
0 likes   
Carla/Alicia/Jerry(In The Eye)/Michelle/Charley/Ivan/Dennis/Katrina/Rita/Wilma/Ike/Harvey

Member: National Weather Association
Wx Infinity Forums
http://wxinfinity.com/index.php

Facebook.com/WeatherInfinity
Twitter @WeatherInfinity

Snowluvr
Tropical Low
Tropical Low
Posts: 44
Joined: Thu Jan 07, 2010 10:27 pm
Location: Lucedale, Ms

Re: When will we see more Arctic Cold?

#108 Postby Snowluvr » Sun Feb 14, 2010 8:06 pm

Uh.. does this mean that we could possibly have another winter weather event in southern Ms?
0 likes   

User avatar
Ptarmigan
Category 5
Category 5
Posts: 5273
Joined: Wed Aug 16, 2006 9:06 pm

Re: When will we see more Arctic Cold?

#109 Postby Ptarmigan » Sun Feb 14, 2010 8:08 pm

Thanks for the analysis Don. This winter is the coldest in quite sometimes.
0 likes   

User avatar
WeatherLovingDoc
S2K Supporter
S2K Supporter
Posts: 453
Joined: Fri Sep 05, 2008 10:08 pm
Location: Washington D.C.

Re: When will we see more Arctic Cold?

#110 Postby WeatherLovingDoc » Sun Feb 14, 2010 8:50 pm

Being a weather novice, I read this wonderful thread with full concentration from the beginning and thank you all, especially expert Sutherland. A true newcomer to this science, I still did not have full comprehension of the word "blocking" so searched a bit more. For other novices like myself, I trust all do not mind I post one definition/description which I found, along with two links further discussing blocking and NAO. Please comment/correct or provide additional definitions. Thank you. WLD.

"To be called blocking, the high must split the mid-latitude jet stream meridionally into winds at least 45 degrees of latitude apart, and persist for 10 days or more. In other words, a blocking region is identified by a sustained split in the jet stream, with a polar jet at an unusually high latitude, and a well-defined subtropical jet at an anomalously low latitude. An unusually broad, quasi-stationary upper-level ridge extending to high latitudes is also referred to as a blocking event. The term 'blocking' is used because the large ridge in the polar jet blocks the normal progression of upper-level shortwaves and frontal disturbances in midlatitude."

http://www-das.uwyo.edu/~geerts/cwx/notes/chap12/blocking.html

The North Atlantic Oscillation

http://www-das.uwyo.edu/~geerts/cwx/notes/chap12/nao.html
0 likes   

donsutherland1
S2K Analyst
S2K Analyst
Posts: 2718
Joined: Mon Sep 15, 2003 8:49 pm
Location: New York

Re: When will we see more Arctic Cold?

#111 Postby donsutherland1 » Tue Feb 16, 2010 9:56 am

Snowluvr wrote:Uh.. does this mean that we could possibly have another winter weather event in southern Ms?


Such an event cannot be ruled out.
0 likes   

donsutherland1
S2K Analyst
S2K Analyst
Posts: 2718
Joined: Mon Sep 15, 2003 8:49 pm
Location: New York

Re: When will we see more Arctic Cold?

#112 Postby donsutherland1 » Tue Feb 16, 2010 9:56 am

Quick update...

First, if one takes a look at the ensemble forecast for the AO, one finds a forecast increase in the approximately 3-4 days leading up to March 1. However, by March 1, with the exception of two ensemble members, the others show the increase coming to an end. IMO, given the ongoing stratospheric warming, the idea of a restrengthening blocking regime sometime during the first week of March +/- a few days remains reasonable.

Second, if one looks at the objective analogs centered around 2/27, one finds a number of dates during or near KU snowstorms. Those dates are: 2/11/1958, 2/16/1958, 2/12/1969, and 2/10/1978. The relevant KU snowstorms are: 2/14-17/1958, 2/8-10/1969, and 2/5-7/1978.

Third, another date showing up is March 1, 2005. The February 28-March 2, 2005 event was a moderate snowstorm. Accumulations included:

Albany: 11.9"
Allentown: 10.1"
Baltimore: 4.2"
Binghamton: 12.8"
Boston: 8.6"
Burlington: 8.2"
Caribou: 9.3"
Concord: 8.3"
Harrisburg: 6.0"
Hartford: 7.0"
Montreal: 4.2" (10.6 cm)
New York: 7.7"
Newark: 9.5"
Ottawa: 5.4" (13.8 cm)
Philadelphia: 5.8"
Pittsburgh: 8.0"
Portland, ME: 10.0"
Providence: 6.8"
Toronto: 5.6" (14.2 cm)
Washington:
...DCA: 2.2"
...IAD: 4.1"
Worcester: 5.7"

In sum, the pattern seems to be evolving toward something that would favor renewed opportunities for snow in large parts of the East for the last week of February and first week of March. A KU snowstorm during that period cannot be ruled out.
0 likes   

Weatherdude20

Re: When will we see more Arctic Cold?

#113 Postby Weatherdude20 » Tue Feb 16, 2010 10:49 am

Thanks Don.
0 likes   

User avatar
srainhoutx
S2K Supporter
S2K Supporter
Posts: 6919
Age: 66
Joined: Sun Jan 14, 2007 11:34 am
Location: Haywood County, NC
Contact:

Re: When will we see more Arctic Cold?

#114 Postby srainhoutx » Tue Feb 16, 2010 9:07 pm

donsutherland1 wrote:Quick update...

First, if one takes a look at the ensemble forecast for the AO, one finds a forecast increase in the approximately 3-4 days leading up to March 1. However, by March 1, with the exception of two ensemble members, the others show the increase coming to an end. IMO, given the ongoing stratospheric warming, the idea of a restrengthening blocking regime sometime during the first week of March +/- a few days remains reasonable.

Second, if one looks at the objective analogs centered around 2/27, one finds a number of dates during or near KU snowstorms. Those dates are: 2/11/1958, 2/16/1958, 2/12/1969, and 2/10/1978. The relevant KU snowstorms are: 2/14-17/1958, 2/8-10/1969, and 2/5-7/1978.

Third, another date showing up is March 1, 2005. The February 28-March 2, 2005 event was a moderate snowstorm. Accumulations included:

Albany: 11.9"
Allentown: 10.1"
Baltimore: 4.2"
Binghamton: 12.8"
Boston: 8.6"
Burlington: 8.2"
Caribou: 9.3"
Concord: 8.3"
Harrisburg: 6.0"
Hartford: 7.0"
Montreal: 4.2" (10.6 cm)
New York: 7.7"
Newark: 9.5"
Ottawa: 5.4" (13.8 cm)
Philadelphia: 5.8"
Pittsburgh: 8.0"
Portland, ME: 10.0"
Providence: 6.8"
Toronto: 5.6" (14.2 cm)
Washington:
...DCA: 2.2"
...IAD: 4.1"
Worcester: 5.7"

In sum, the pattern seems to be evolving toward something that would favor renewed opportunities for snow in large parts of the East for the last week of February and first week of March. A KU snowstorm during that period cannot be ruled out.


Thanks for the update Don. Many of our folks S of I-20 from TX across the Deep South are watching carefully. The ECMWF suggests another Southern Storm at 214 hours. It will be interesting to see the guidance latch onto a sensible solution.
0 likes   
Carla/Alicia/Jerry(In The Eye)/Michelle/Charley/Ivan/Dennis/Katrina/Rita/Wilma/Ike/Harvey

Member: National Weather Association
Wx Infinity Forums
http://wxinfinity.com/index.php

Facebook.com/WeatherInfinity
Twitter @WeatherInfinity

timNms
Category 5
Category 5
Posts: 1371
Age: 62
Joined: Sat Oct 19, 2002 5:45 pm
Location: Seminary, Mississippi
Contact:

Re: When will we see more Arctic Cold?

#115 Postby timNms » Wed Feb 17, 2010 10:40 am

StormingB81 wrote:
Stephanie wrote:
This winter's rare combination of often severe blocking and a moderate El Niño has resulted in new seasonal snowfall records being established across the Middle Atlantic Region. As of 8 pm today, records include:

Baltimore: 79.9"; Old record: 62.5", 1995-96
Dulles International Airport: 72.8"; Old record: 61.9", 1995-96
Philadelphia: 70.3"; Old record: 65.5", 1995-96
Washington, DC: 55.6"; Old record: 54.4", 1898-99

Baltimore's record is now 28% above the previous mark. Even more impressive, Baltimore's record is greater than the highest seasonal snowfall recorded at either Philadelphia or New York City.

Almost as noteworthy as the seasonal snowfall marks were the enormous snowstorms that blanketed the Middle Atlantic States. To date, Philadelphia has had 2 20" snowstorms. Prior to 2009-10, Philadelphia had just 3 such snowstorms going back to 1884-85. Baltimore had two such snowstorms this winter--and the current one has seen 19.5". Prior to 2009-10, Baltimore had 7 such snowstorms going back to 1883-84.


Those are incredible statistics - particularly Baltimore's with the higher snowfall total and the number of 20" snowfalls over Philadelphia. It's an hour and a half south of here. Their geography must be just so where more snow gets squeezed out than in Philadelphia. Go figure.

Thanks also for the photos of Cape May.


Someone on NBC said that Global Warming is causing this. Whic hmakes me really confused on the wole thing.


And when I was a kid the big thing was "global cooling" :P We were supposed to be heading for another ice age. After having seen several days of lows in the lower teens in South MS in January, and a 5 inch snowfall in February, I am beginning to wonder if those guys were actually on to something way back then??? :P
My personal opinion is this. The weather (or climate or whatever one wants to call it) is not now, nor will it ever be controlled or influenced by man. I don't think weather records date back far enough for anyone to conclude that we are experiencing "climate change". I think weather/climate works in cycles. We'll have warm years and cool years, dry years and wet years.
0 likes   

JonathanBelles
Professional-Met
Professional-Met
Posts: 11430
Age: 33
Joined: Sat Dec 24, 2005 9:00 pm
Location: School: Florida State University (Tallahassee, FL) Home: St. Petersburg, Florida
Contact:

#116 Postby JonathanBelles » Wed Feb 17, 2010 6:54 pm

Climotology tells me that winter cold should be over, but in a winter where climotology left in December, how many cold blasts does the Southeast and Florida have left?
0 likes   

TideJoe
Tropical Storm
Tropical Storm
Posts: 155
Joined: Fri Aug 15, 2008 1:05 pm

Re:

#117 Postby TideJoe » Wed Feb 17, 2010 9:27 pm

fact789 wrote:Climotology tells me that winter cold should be over, but in a winter where climotology left in December, how many cold blasts does the Southeast and Florida have left?


I hope we're done soon. I'm almost out of firewood.
0 likes   

User avatar
cycloneye
Admin
Admin
Posts: 139596
Age: 67
Joined: Thu Oct 10, 2002 10:54 am
Location: San Juan, Puerto Rico

Re: When will we see more Arctic Cold?

#118 Postby cycloneye » Mon Feb 22, 2010 11:34 am

Well,those who want spring to come I am afraid that it will have to wait a while longer as El Nino still is hanging on as moderate.

Here is this week's Climate Prediction Center update:

Last Week Numbers

Niño 4= +1.0ºC
Niño 3.4= +1.2ºC
Niño 3= +0.7ºC
Niño1+2= -0.1ºC

This Week Numbers

Niño 4= +1.1ºC
Niño 3.4= +1.2ºC
Niño 3= +0.8ºC
Niño1+2= +0.4ºC


http://www.cpc.ncep.noaa.gov/products/a ... ts-web.pdf

Image
0 likes   
Visit the Caribbean-Central America Weather Thread where you can find at first post web cams,radars
and observations from Caribbean basin members Click Here


Return to “Winter Weather”

Who is online

Users browsing this forum: No registered users and 15 guests