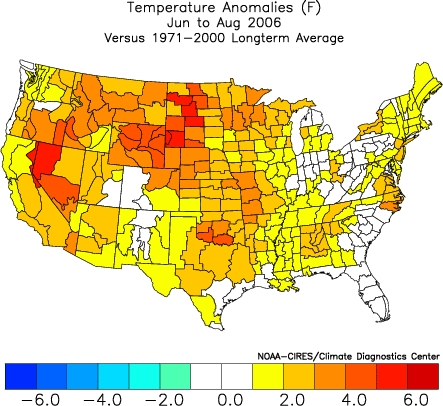
Temperature Snapshot:
• Northeast: Near normal to somewhat above normal
• Mid-Atlantic: Near normal to somewhat above normal
• Southeast: Near normal
• Great Lakes: Near normal
• Northern Plains: Near normal to above normal
• Central and Southern Plains: Above normal
• Western third of the United States: Above normal
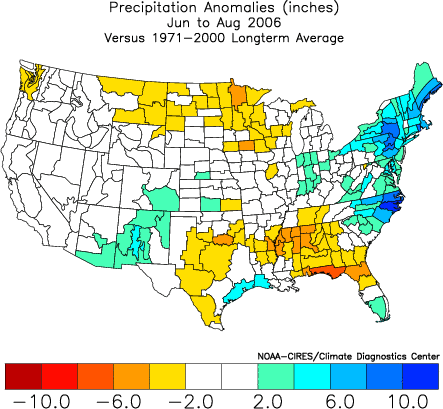
Precipitation Snapshot:
• Northeast: Above normal
• Mid-Atlantic: Above normal
• Southeast: Near normal
• Gulf Coast: Above normal
• Central and Southern Plains: Below normal
• Pacific Northwest: Below normal
The hottest temperatures should be cooler than last summer and outbreaks of heat less frequent and less sustained. It is possible that either Boston or Detroit might see no heatwaves (3 or more consecutive days with high temperatures reaching 90° or above).
Boston:
Highest temperature: 93°-96°
90° days: 8 or more
Heatwaves: Perhaps 1
Detroit:
Highest temperature: 92°-95°
90° days: 4 or more
Heatwaves: Perhaps 1
New York City:
Highest temperature: 95°-98°
90° days: 12 or more
Heatwaves: 1 or more; 1 of at least 4 days
Philadelphia:
Highest temperature: 94°-97°
90° days: 12 or more
Heatwaves: 1 or more; 1 of at least 4 days
Washington, DC:
Highest temperature: 95°-98°
90° days: 23 or more
Heatwaves: 3 or more; 1 of at least 5 days
Additional Discussion:
Summers Following Weak La Niña Winters:
Such summers often average on the cool side of normal, although bouts of excessive heat can occur. The Northeastern U.S. typically winds up warmer than normal. The western half of the United States is often warmer than normal.
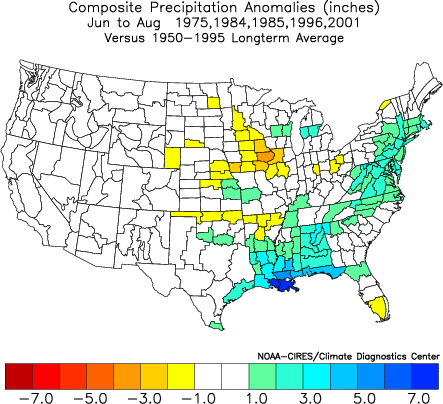
Summers following weak La Niña winters often feature above normal rainfall running from the Gulf Coast and up the spine of the Appalachians to the northern Mid-Atlantic/southeastern New England region. The Plains states are often somewhat drier than normal to near normal in terms of rainfall.
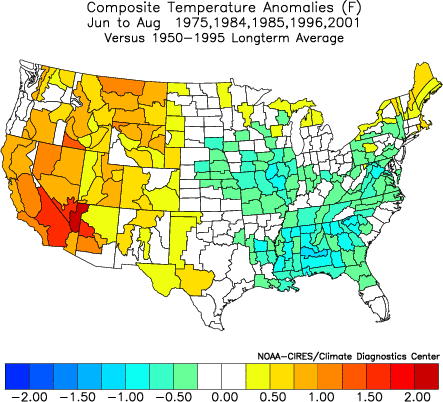
Since 1950, there have been 5 such summers: 1975, 1984, 1985, 1996, and 2001. Most were warmer than normal in the Northeast. In the Mid-Atlantic and Southeastern states near normal to cooler than normal conditions prevailed:
• Northeast: 3/5 (60%) Above normal temperatures; 4/5 (80%) Normal to above normal temperatures
• Mid-Atlantic: 3/5 (60%) Near normal temperatures; 5/5 (100%) Below normal to near normal temperatures
• Southeast: 5/5 (100%) Below normal to near normal temperatures
ENSO Region Matches (March 2006 + Last 3 Months):
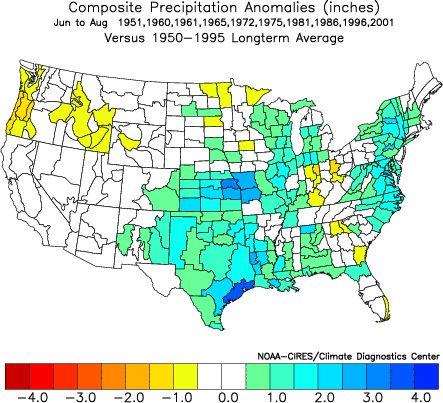
There were 15 years that saw the average ENSO region difference of 0.5°C or less from the ENSO region temperatures of March 2006. From that sample, the 10 years that had the most similar ENSO region conditions over the past 3 months were: 1951, 1960, 1961, 1965, 1972, 1975, 1981, 1986, 1996, and 2001. All had average ENSO region differences of less than 0.5°C from the first three months of 2006.
The composite temperature anomalies were cool in the eastern half of the U.S. excluding the Gulf Coast and Southeast and warm in the West:

The composite precipitation anomalies showed wet conditions in the Central and Southern Plains and then the East Coast. Dry anomalies are shown in the Pacific Northwest:
From that sample, summers 1965 and 1972 can be excluded on account of the development of an El Niño. Summer 1975 can be excluded on account of a moderate La Niña. ENSO conditions are likely to be neutral during Summer 2006 per the latest computer guidance.
Under such constraints, the following conditions prevailed:
• Northeast: 5/7 (71%) Below normal to near normal temperatures
• Mid-Atlantic: 5/7 (71%) Near normal temperatures
• Southeast: 5/7 (71%) Near normal to above normal temperatures
500 mb Upper Air Pattern:
The upper air patterns tended to promote a warmer solution for the East.
• Northeast: 3/4 (75%) Above normal temperatures
• Mid-Atlantic: 3/4 (75%) Normal to above normal temperatures
• Southeast: 4/4 (100%) Normal to above normal temperatures
The composite lent additional support to the precipitation profile discussed earlier.
Northern Hemisphere Snowcover profiles (October-February):
In the October-February period, 1990-91 has proved the closest match to 2005-06 in terms of Northern Hemisphere snowcover. The average monthly difference in Northern Hemisphere snowcover was 0.940 million square kilometers. The largest monthly difference was 2.0 million square kilometers. 1995-96 offered the second closest match with an average difference of 0.960 million square kilometers. Summer 1991 was warmer than normal in both the Northeast and Mid-Atlantic and near normal in the Southeast. Summer 1996 was near normal in the East.
In 2004, I did not use this indicator. However, after a review of the seasonal forecast debacle, I found that this indicator shed valuable light. The closest 5-month match to 2003-04 was 1999-00. The average monthly difference in Northern Hemisphere snowcover came to 0.580 million square kilometers. The largest monthly difference was 1.7 million square kilometers. Last summer, this indicator worked very well. As a result, I have again given it consideration in weighting my analogs.