Using Hovmoller Diagrams to Diagnose Tropical Development

This is the general tropical discussion area. Anyone can take their shot at predicting a storms path.

Moderator: S2k Moderators

Forum rules

The posts in this forum are NOT official forecasts and should not be used as such. They are just the opinion of the poster and may or may not be backed by sound meteorological data. They are NOT endorsed by any professional institution or STORM2K. For official information, please refer to products from the National Hurricane Center and National Weather Service.

Help Support Storm2K
Message
Author
MWatkins
S2K Supporter
S2K Supporter
Posts: 2574
Joined: Sat Oct 12, 2002 7:51 pm
Location: SE Florida
Contact:

Using Hovmoller Diagrams to Diagnose Tropical Development

#1 Postby MWatkins » Thu Jul 29, 2010 12:19 pm

One analysis tool that goes back to the OLD OLD OLD days of tropical forecasting is the good old Hovmoller Diagram.

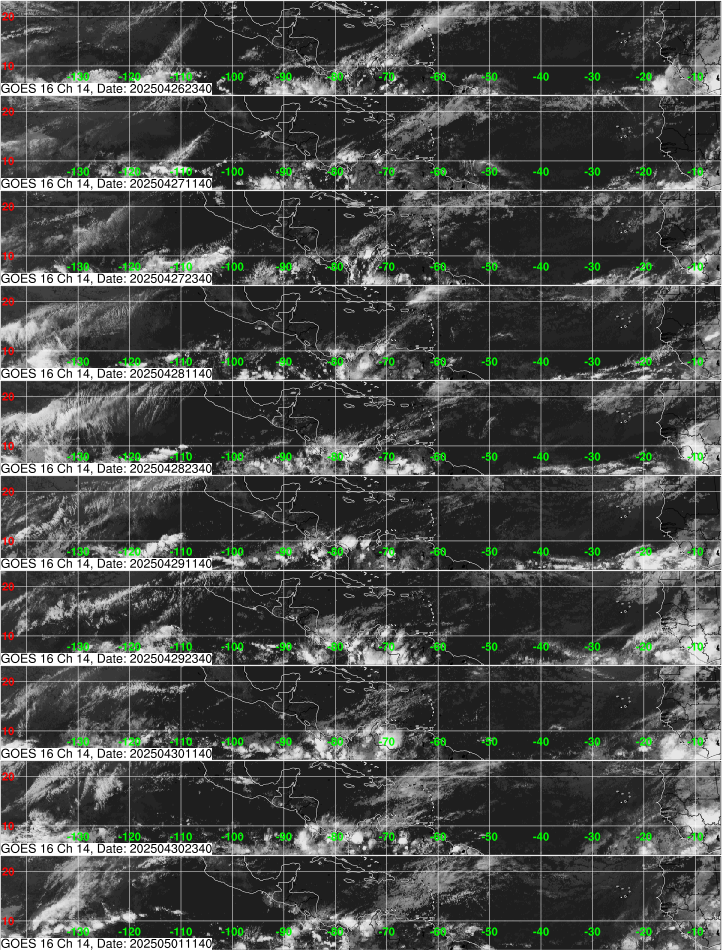
In tropical meteorology...these can be applied by using a strip of 10 satelllite images over 5 days, taken around 0Z and 12Z.

Back in the day, some may remember John Hope talking about persistence of tropical features...that they needed to be around ofr 24 hours or more before he would really take a look to see if it had a chance to develop. He didn't need models, just good old synoptic reasoning.

The Hovmoller Diagram lets forecasters, analysts and tropical enthusiasts see which features have and haven't been around long enough...or haven't been persistent enough, to warrent a closer look.

Here is the most recent view of the Atlantic basin:

Image

Here's that link:
http://www.nhc.noaa.gov/tafb_latest/gehov1latest.gif

The first image is the oldest...so as you read down you should see the progression of features moving from east to west until you get to the most recent image from 11:45Z this morning.

Now, take a look at that area of disturbed weather coming into the islands...it just started to get going overnight and most of the real convection hasn't been around for more than 12 hours. That would not be a place I would look.

However, the weather near 32 west can be tracked from it's departure from Africa around 12Z July 27th.

Given this has been more or less on the map for 2 full days, I really believe it warrents some attention in the TWO...and maybe they will bring it up at 2PM..

Looking at the diagram, though, it's no better organized than it was 2 days ago...just an area of storms that appear to be impacted by easterly shear. Plus, there's not much model support for development. So, I can see where the case could be made to not discuss it.

To me, figuring out if something will develop or not is the most interesting part about tropical meteorology. Over the years, this diagram is the first thing I look at in the morning to see if something is persisting, increasing or decreasing in organization.

Hopefully it helps others do the same.

MW

PS (Edit): These kind of diagrams are used for lots of weather applications, including finding Kelvin waves through tracking SST anoms over time, watching the MJO etc. They are more familiar than some realize...
0 likes   
Updating on the twitter now: http://www.twitter.com/@watkinstrack

Aric Dunn
Category 5
Category 5
Posts: 21238
Age: 42
Joined: Sun Sep 19, 2004 9:58 pm
Location: Ready for the Chase.
Contact:

#2 Postby Aric Dunn » Thu Jul 29, 2010 12:25 pm

absolutely.. although I do not use the Hovmoller Diagram I do save my own close up images of specific features from day to day since some features in the Hovmoller Diagram are too small or blurry to see some of the features. but the use of the Hovmoller Diagram is a huge tool.
0 likes   
Note: If I make a post that is brief. Please refer back to previous posts for the analysis or reasoning. I do not re-write/qoute what my initial post said each time.
If there is nothing before... then just ask :)

Space & Atmospheric Physicist, Embry-Riddle Aeronautical University,
I believe the sky is falling...

User avatar
hurricanetrack
HurricaneTrack.com
HurricaneTrack.com
Posts: 1781
Joined: Tue Dec 02, 2003 10:46 pm
Location: Wilmington, NC
Contact:

#3 Postby hurricanetrack » Thu Jul 29, 2010 12:30 pm

Thanks Mike. I think I will use that on a certain daily video outlook- with credit for the idea given to Jeebs MacGregor. :lol:
0 likes   


Return to “Talkin' Tropics”

Who is online

Users browsing this forum: chaser1, Cpv17, cycloneye, Google Adsense [Bot], Hurricane2022, ineedsnow, jaguars_22, Landy, StPeteMike, Stratton23, TomballEd, Ulf and 50 guests