2024 Indicators: SST's, MSLP, Shear, SAL, Steering, Instability (Day 16+ Climate Models) June CanSIPS is up
Moderator: S2k Moderators
Forum rules

The posts in this forum are NOT official forecasts and should not be used as such. They are just the opinion of the poster and may or may not be backed by sound meteorological data. They are NOT endorsed by any professional institution or STORM2K. For official information, please refer to products from the National Hurricane Center and National Weather Service.

Re: 2024 Indicators: SST's, MSLP, Shear, SAL, Steering, Instability (Day 16+ Climate Models)
The correlation between the spring and summer NAO during 1979–2012 is 0.05. Weaker subtropical high in the spring means pretty much nothing for the summer.
2 likes
Re: 2024 Indicators: SST's, MSLP, Shear, SAL, Steering, Instability (Day 16+ Climate Models)


EPS forecasts above average precipitation in the MDR and the Caribbean despite unfavorable MJO (huge sinking branch over Atlantic and Africa), a sign of very favorable Atlantic. I think we will see a burst of activity in the western Atlantic and maybe storms in the deep tropics when the MJO comes back in early June.
1 likes
-
TheAustinMan

- Category 5

- Posts: 1012
- Age: 24
- Joined: Mon Jul 08, 2013 4:26 pm
- Location: United States
- Contact:
Re: 2024 Indicators: SST's, MSLP, Shear, SAL, Steering, Instability (Day 16+ Climate Models)
skyline385 wrote:TheAustinMan wrote:<...>
Interestingly, all three of those analogues (1995,1998 and 2010) had mostly long lived CV systems and weren't crazy like 2005 or 2020 in the Caribbean. One big exception here is of course Mitch but still the years were nowhere like some of the west heavy seasons we have had (2005, 2020, etc.). With an +AMO this strong, I do think there is a lot of potential for systems to recurve from beta drift similar to what the CFS is showing but all other climate models seem to suggest otherwise.
<..>
If we take a composite of that set of three years (albeit a small set), two hotspots of tropical activity emerge relative to climatology: long track systems extending near or north of the Leeward Islands continuing on to points north and west, and systems over the Western Caribbean. These hotspots are generally what you'd expect for a year exhibiting a strong +AMO horseshoe SST pattern, which especially favors the first hotspot, and La Nina, which especially favors the second. For the time being, it seems like these two regions may be key areas for this year. Predicting land impacts is very imprecise and uncertain, but if there's any place that I'd have higher confidence in, I'd say the Yucatan Peninsula has higher-than-normal odds of experiencing heightened tropical activity.
Source: Me, using Python on IBTrACS data. This is a map showing anomalous ACE density, or in other words, given the set of years, which areas experienced unusually more or less amounts of intense tropical activity than average? Being an ACE-related calculation, concentrations of intense major hurricanes influence the map heavily, while weaker systems have relatively little influence on the depicted hotspots.

If we expand the set of analogs a bit to also include years that were Neutral in peak season (which is a lower likelihood, but still very much possible), we get the following map of hotspots, which seems to capture more subtropical activity often characteristic of ENSO-neutral years:

And, finally, if we consider the set of years to include, more broadly, any transition into a La Nina state, with decently above-normal MDR warmth and +AMO, we get this (caveat: the more subdued hotspot in the MDR may be at least partially influenced by WW2 observation coverage):

7 likes


Treat my opinions with a grain of salt. For official information see your local weather service.
-
cycloneye

- Admin

- Posts: 139468
- Age: 67
- Joined: Thu Oct 10, 2002 10:54 am
- Location: San Juan, Puerto Rico
Re: 2024 Indicators: SST's, MSLP, Shear, SAL, Steering, Instability (Day 16+ Climate Models)
1 likes
Visit the Caribbean-Central America Weather Thread where you can find at first post web cams,radars
and observations from Caribbean basin members Click Here
and observations from Caribbean basin members Click Here
-
Category5Kaiju

- Category 5
- Posts: 3415
- Age: 22
- Joined: Thu Dec 24, 2020 12:45 pm
- Location: Seattle
Re: 2024 Indicators: SST's, MSLP, Shear, SAL, Steering, Instability (Day 16+ Climate Models)
cycloneye wrote:MDR is even hotter than a few days ago.
https://x.com/WeatherProf/status/1791476266413047989
Wow, should this trend hold up, we actually have a chance of reaching an average Caribbean Sea temperature of 31 C for the first time recorded.
0 likes
Unless explicitly stated, all information covered in my posts is based on my opinions and observations. Please refer to a professional meteorologist or an accredited weather research agency otherwise, especially if serious decisions must be made in the event of a potentially life-threatening tropical storm or hurricane.
-
skyline385

- Category 5
- Posts: 2518
- Age: 33
- Joined: Wed Aug 26, 2020 11:15 pm
- Location: Houston TX
Re: 2024 Indicators: SST's, MSLP, Shear, SAL, Steering, Instability (Day 16+ Climate Models)
Not sure how many people here follow severe weather but we had a major severe wx event in Houston yesterday which left more than a million people without power at peak (and still 700k without power). Now, the reason I bring this up is because the last time we had such a major event was on May 20, 1983 where 3 EF-2 tornadoes touched down around the Houston area. What's peculiar about this is that 1983 also had a decaying El-Nino during May (which eventually transitioned to a Nina towards end of year) and a somewhat +AMO config in May (which eventually decayed as we got into hurricane season). Now the same hurricane season while being one of the quietest on records is also famous for Hurricane Alicia over here which again ran straight through the Greater Houston area as a C3. And we also have climate models showing a west based track this season. So, long story short, I am going to definitely make sure my preparations are well in order this month.
Last edited by skyline385 on Fri May 17, 2024 2:04 pm, edited 1 time in total.
4 likes
-
ScottNAtlanta

- Category 5
- Posts: 2008
- Joined: Sat May 25, 2013 3:11 pm
- Location: Atlanta, GA
Re: 2024 Indicators: SST's, MSLP, Shear, SAL, Steering, Instability (Day 16+ Climate Models)
skyline385 wrote:Not sure how many people here follow severe weather but we had a major severe wx event in Houston yesterday which left more than a million people without power at peak (and still 700k without power). Now, the reason I bring this up is because the last time we had such a major event was on May 20, 1983 where 3 EF-2 tornadoes touched down around the Houston area. What's peculiar about this is that 1983 had a decaying El-Nino during May (which eventually transitioned to a Nina towards end of year) and a somewhat +AMO config in May (which eventually decayed as we got into hurricane season). Now the same hurricane season while being one of the quietest on records is also famous for Hurricane Alicia over here which again ran straight through the Greater Houston area as a C3. And we also have climate models showing a west based track this season. So, long story short, I am going to definitely make sure my preparations are well in order this month.
You know what they say...
Don't be scared, be prepared!
3 likes
The posts in this forum are NOT official forecast and should not be used as such. They are just the opinion of the poster and may or may not be backed by sound meteorological data. They are NOT endorsed by any professional institution or storm2k.org. For official information, please refer to the NHC and NWS products.
-
AnnularCane
- S2K Supporter

- Posts: 2651
- Joined: Thu Jun 08, 2006 9:18 am
- Location: Wytheville, VA
Re: 2024 Indicators: SST's, MSLP, Shear, SAL, Steering, Instability (Day 16+ Climate Models)
skyline385 wrote:Not sure how many people here follow severe weather but we had a major severe wx event in Houston yesterday which left more than a million people without power at peak (and still 700k without power). Now, the reason I bring this up is because the last time we had such a major event was on May 20, 1983 where 3 EF-2 tornadoes touched down around the Houston area. What's peculiar about this is that 1983 also had a decaying El-Nino during May (which eventually transitioned to a Nina towards end of year) and a somewhat +AMO config in May (which eventually decayed as we got into hurricane season). Now the same hurricane season while being one of the quietest on records is also famous for Hurricane Alicia over here which again ran straight through the Greater Houston area as a C3. And we also have climate models showing a west based track this season. So, long story short, I am going to definitely make sure my preparations are well in order this month.
Is there a reason 1983 had so few storms? Aside from being during a less active period, it sounded kind of favorable, maybe kind of like this year (not sure about the +AMO though, probably don't know enough). In fact up until recently I had assumed that the El Nino had continued through the 1983 season.
0 likes
"But it never rained rain. It never snowed snow. And it never blew just wind. It rained things like soup and juice. It snowed mashed potatoes and green peas. And sometimes the wind blew in storms of hamburgers." -- Judi Barrett, Cloudy with a Chance of Meatballs
-
Category5Kaiju
- Category 5
- Posts: 3415
- Age: 22
- Joined: Thu Dec 24, 2020 12:45 pm
- Location: Seattle
Re: 2024 Indicators: SST's, MSLP, Shear, SAL, Steering, Instability (Day 16+ Climate Models)
AnnularCane wrote:skyline385 wrote:Not sure how many people here follow severe weather but we had a major severe wx event in Houston yesterday which left more than a million people without power at peak (and still 700k without power). Now, the reason I bring this up is because the last time we had such a major event was on May 20, 1983 where 3 EF-2 tornadoes touched down around the Houston area. What's peculiar about this is that 1983 also had a decaying El-Nino during May (which eventually transitioned to a Nina towards end of year) and a somewhat +AMO config in May (which eventually decayed as we got into hurricane season). Now the same hurricane season while being one of the quietest on records is also famous for Hurricane Alicia over here which again ran straight through the Greater Houston area as a C3. And we also have climate models showing a west based track this season. So, long story short, I am going to definitely make sure my preparations are well in order this month.
Is there a reason 1983 had so few storms? Aside from being during a less active period, it sounded kind of favorable, maybe kind of like this year (not sure about the +AMO though, probably don't know enough). In fact up until recently I had assumed that the El Nino had continued through the 1983 season.
From what I understand, a big reason why that happened was that the El Nino from 1982 was very strong and had lingering effects that penetrated into 1983's Atlantic season. The idea of very strong El Ninos having lingering effects into subsequent hurricane season years isn't that uncommon tbh; this also kind of explains why years like 1998 and 2016 were pretty backloaded and had somewhat of slow starts despite being first year La Ninas.
Combine that with meh sst anomalies (based on Austinman's diagram in the previous page) and the inactive era itself, and it's easy to see why 1983 was so inactive. I'm not 100% sure, but I also have a suspicion that a dry Sahel region could've exacerbated the inactivity levels. I firmly think if 1983 were to take place during the post-1995 active era, then it would've been considerably more active.
1 likes
Unless explicitly stated, all information covered in my posts is based on my opinions and observations. Please refer to a professional meteorologist or an accredited weather research agency otherwise, especially if serious decisions must be made in the event of a potentially life-threatening tropical storm or hurricane.
-
skyline385
- Category 5
- Posts: 2518
- Age: 33
- Joined: Wed Aug 26, 2020 11:15 pm
- Location: Houston TX
Re: 2024 Indicators: SST's, MSLP, Shear, SAL, Steering, Instability (Day 16+ Climate Models)
AnnularCane wrote:skyline385 wrote:Not sure how many people here follow severe weather but we had a major severe wx event in Houston yesterday which left more than a million people without power at peak (and still 700k without power). Now, the reason I bring this up is because the last time we had such a major event was on May 20, 1983 where 3 EF-2 tornadoes touched down around the Houston area. What's peculiar about this is that 1983 also had a decaying El-Nino during May (which eventually transitioned to a Nina towards end of year) and a somewhat +AMO config in May (which eventually decayed as we got into hurricane season). Now the same hurricane season while being one of the quietest on records is also famous for Hurricane Alicia over here which again ran straight through the Greater Houston area as a C3. And we also have climate models showing a west based track this season. So, long story short, I am going to definitely make sure my preparations are well in order this month.
Is there a reason 1983 had so few storms? Aside from being during a less active period, it sounded kind of favorable, maybe kind of like this year (not sure about the +AMO though, probably don't know enough). In fact up until recently I had assumed that the El Nino had continued through the 1983 season.
The +AMM which was active during Spring completely flipped for the peak of hurricane season so that played a big part in it.
2 likes
-
cycloneye
- Admin
- Posts: 139468
- Age: 67
- Joined: Thu Oct 10, 2002 10:54 am
- Location: San Juan, Puerto Rico
Re: 2024 Indicators: SST's, MSLP, Shear, SAL, Steering, Instability (Day 16+ Climate Models)
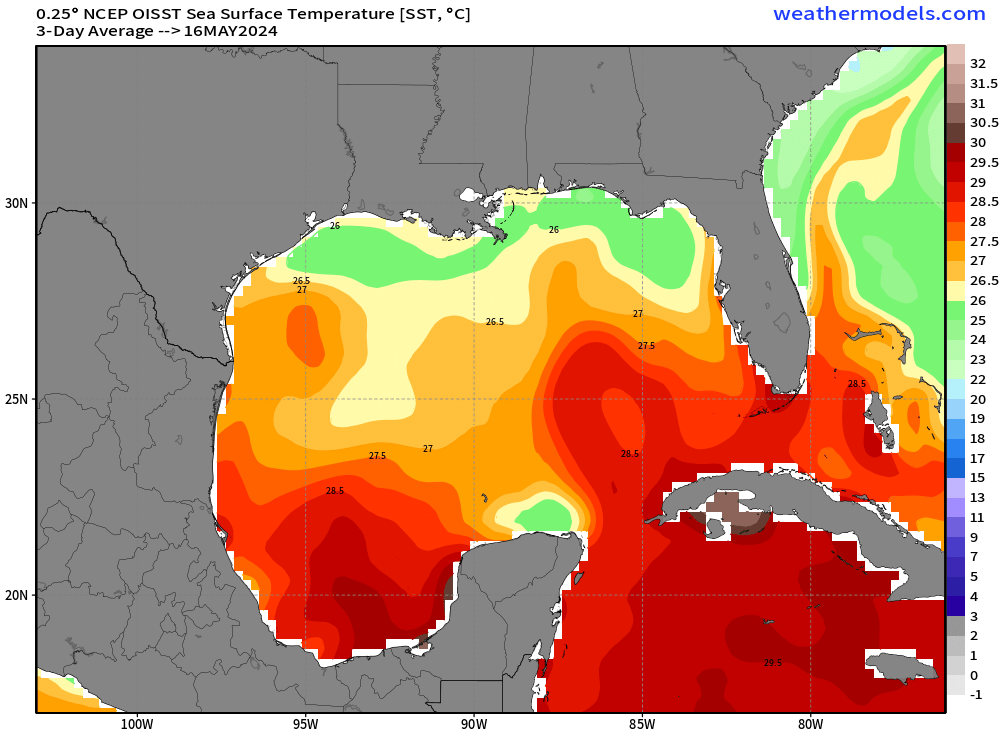
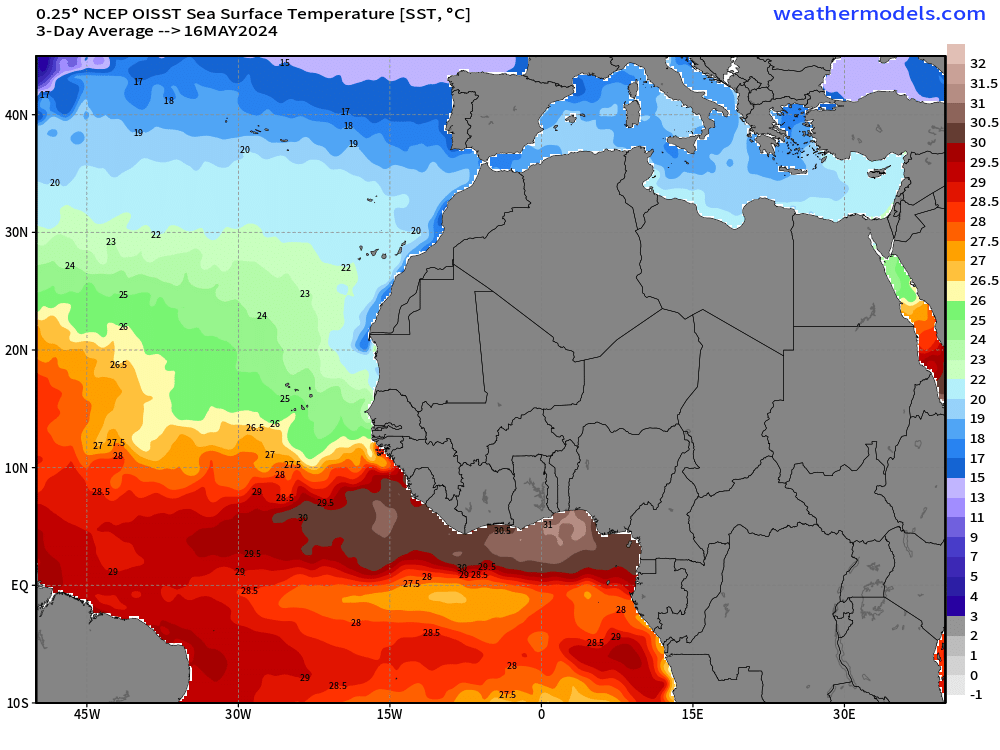
Returning to 2024, look how warm is the Caribbean Sea.
Translation to English from my post at X. The graphics speak for themselves.
The waters of the Caribbean Sea are very warm and if they remain this way in the coming weeks and months, it will be very in favor of systems that move through those waters, since they will have the necessary fuel to intensify.
We say the same about the waters between Africa and the Caribbean.
https://x.com/CycloforumsPR/status/1791530770726584694
0 likes
Visit the Caribbean-Central America Weather Thread where you can find at first post web cams,radars
and observations from Caribbean basin members Click Here
and observations from Caribbean basin members Click Here
Re: 2024 Indicators: SST's, MSLP, Shear, SAL, Steering, Instability (Day 16+ Climate Models)
skyline385 wrote:AnnularCane wrote:skyline385 wrote:Not sure how many people here follow severe weather but we had a major severe wx event in Houston yesterday which left more than a million people without power at peak (and still 700k without power). Now, the reason I bring this up is because the last time we had such a major event was on May 20, 1983 where 3 EF-2 tornadoes touched down around the Houston area. What's peculiar about this is that 1983 also had a decaying El-Nino during May (which eventually transitioned to a Nina towards end of year) and a somewhat +AMO config in May (which eventually decayed as we got into hurricane season). Now the same hurricane season while being one of the quietest on records is also famous for Hurricane Alicia over here which again ran straight through the Greater Houston area as a C3. And we also have climate models showing a west based track this season. So, long story short, I am going to definitely make sure my preparations are well in order this month.
Is there a reason 1983 had so few storms? Aside from being during a less active period, it sounded kind of favorable, maybe kind of like this year (not sure about the +AMO though, probably don't know enough). In fact up until recently I had assumed that the El Nino had continued through the 1983 season.
The +AMM which was active during Spring completely flipped for the peak of hurricane season so that played a big part in it.
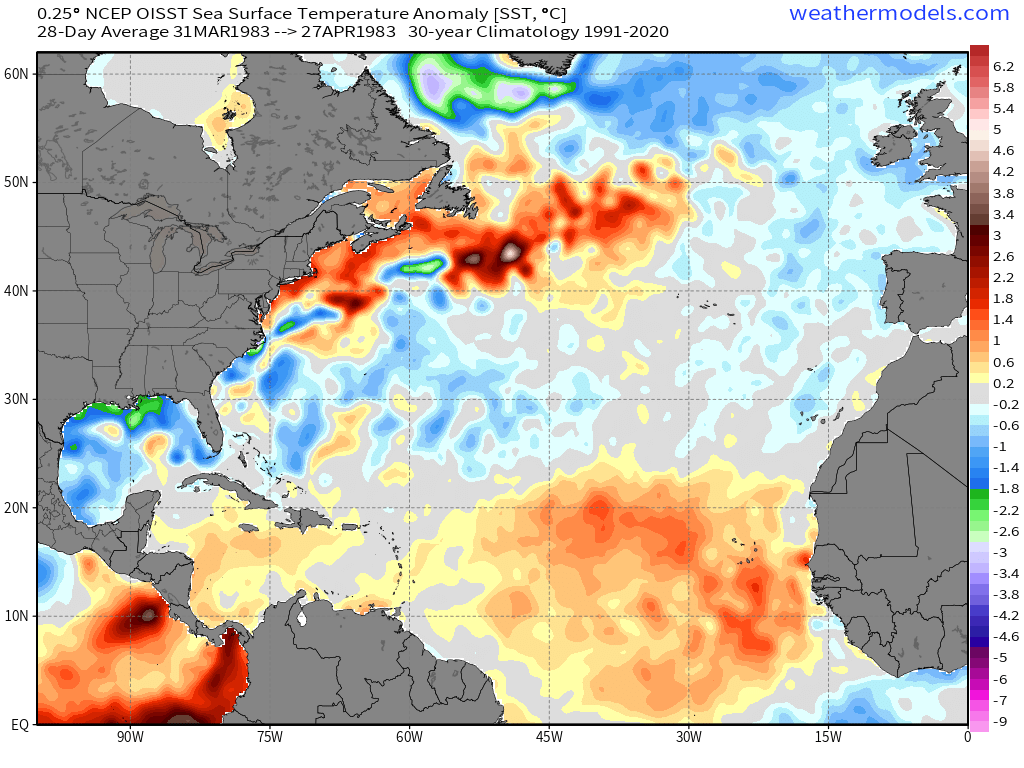
[url]https://i.postimg.cc/TwmZtftJ/image.png [/url]
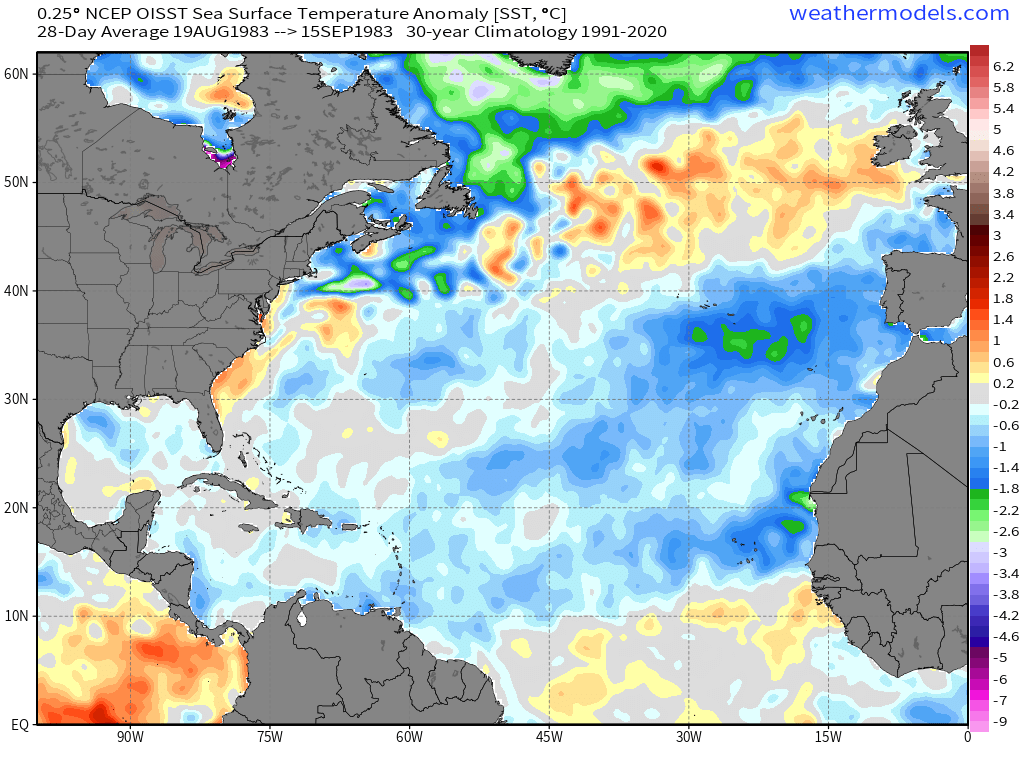
[url]https://i.postimg.cc/J4mWdHVD/image.png [/url]
Does anyone know why the MDR anomalies cooled so much between April and peak time in 1983, especially considering no storms there?
0 likes
Personal Forecast Disclaimer:
The posts in this forum are NOT official forecasts and should not be used as such. They are just the opinion of the poster and may or may not be backed by sound meteorological data. They are NOT endorsed by any professional institution or storm2k.org. For official information, please refer to the NHC and NWS products.
The posts in this forum are NOT official forecasts and should not be used as such. They are just the opinion of the poster and may or may not be backed by sound meteorological data. They are NOT endorsed by any professional institution or storm2k.org. For official information, please refer to the NHC and NWS products.
-
WeatherBoy2000
- Tropical Depression

- Posts: 95
- Joined: Mon Apr 10, 2023 9:29 am
Re: 2024 Indicators: SST's, MSLP, Shear, SAL, Steering, Instability (Day 16+ Climate Models)
skyline385 wrote:AnnularCane wrote:skyline385 wrote:Not sure how many people here follow severe weather but we had a major severe wx event in Houston yesterday which left more than a million people without power at peak (and still 700k without power). Now, the reason I bring this up is because the last time we had such a major event was on May 20, 1983 where 3 EF-2 tornadoes touched down around the Houston area. What's peculiar about this is that 1983 also had a decaying El-Nino during May (which eventually transitioned to a Nina towards end of year) and a somewhat +AMO config in May (which eventually decayed as we got into hurricane season). Now the same hurricane season while being one of the quietest on records is also famous for Hurricane Alicia over here which again ran straight through the Greater Houston area as a C3. And we also have climate models showing a west based track this season. So, long story short, I am going to definitely make sure my preparations are well in order this month.
Is there a reason 1983 had so few storms? Aside from being during a less active period, it sounded kind of favorable, maybe kind of like this year (not sure about the +AMO though, probably don't know enough). In fact up until recently I had assumed that the El Nino had continued through the 1983 season.
The +AMM which was active during Spring completely flipped for the peak of hurricane season so that played a big part in it.

A lot of warmth still remained off South America/Central America during the heart of the 1983 hurricane season as well. This likely allowed conditions to remain more favorable in the epac compared to the Atlantic. The same can't be said about 2024 where the Atlantic has continued to get warmer and warmer:


2 likes
-
cycloneye
- Admin
- Posts: 139468
- Age: 67
- Joined: Thu Oct 10, 2002 10:54 am
- Location: San Juan, Puerto Rico
Re: 2024 Indicators: SST's, MSLP, Shear, SAL, Steering, Instability (Day 16+ Climate Models)
https://x.com/BenNollWeather/status/1791584808377991263
https://x.com/BenNollWeather/status/1791584812857508288
https://x.com/BenNollWeather/status/1791584812857508288
0 likes
Visit the Caribbean-Central America Weather Thread where you can find at first post web cams,radars
and observations from Caribbean basin members Click Here
and observations from Caribbean basin members Click Here
-
cycloneye
- Admin
- Posts: 139468
- Age: 67
- Joined: Thu Oct 10, 2002 10:54 am
- Location: San Juan, Puerto Rico
Re: 2024 Indicators: SST's, MSLP, Shear, SAL, Steering, Instability (Day 16+ Climate Models)
1 likes
Visit the Caribbean-Central America Weather Thread where you can find at first post web cams,radars
and observations from Caribbean basin members Click Here
and observations from Caribbean basin members Click Here
Re: 2024 Indicators: SST's, MSLP, Shear, SAL, Steering, Instability (Day 16+ Climate Models)
The best hint that the water is very shallow and not comparable to deeper water buoy water temps is the diurnal range. This one has had up to 10F ranges! Deep water like Key West buoy typically varies 1-2F or less unless a strong cold front or H has come through, when it might vary a little more.
Last summer, the media took the Manatee Bay buoy reading of 101.1F on 7/24/23 and went crazy/talked about it being a world record. It turned out that that same buoy had 102F on 8/15/17. Also, the world record of 99.7F was set in deep Kuwait Bay 4+ years ago per this:
https://pubmed.ncbi.nlm.nih.gov/33096400/
This is what Dr. Masters said about the 101.1 at Manatee:
“It is possible for sunlit, shallow water surrounded by dark land and light winds to be warmer than the air temperature“ and “Given the gauge's location near land and the Kuwait measurement in open water, Masters said, the two really shouldn't be compared.”
https://www.usatoday.com/story/news/nat ... 463489007/
0 likes
Personal Forecast Disclaimer:
The posts in this forum are NOT official forecasts and should not be used as such. They are just the opinion of the poster and may or may not be backed by sound meteorological data. They are NOT endorsed by any professional institution or storm2k.org. For official information, please refer to the NHC and NWS products.
The posts in this forum are NOT official forecasts and should not be used as such. They are just the opinion of the poster and may or may not be backed by sound meteorological data. They are NOT endorsed by any professional institution or storm2k.org. For official information, please refer to the NHC and NWS products.
-
skyline385
- Category 5
- Posts: 2518
- Age: 33
- Joined: Wed Aug 26, 2020 11:15 pm
- Location: Houston TX
Re: 2024 Indicators: SST's, MSLP, Shear, SAL, Steering, Instability (Day 16+ Climate Models)
Talking about SSTs, we have areas of 30.5-31C SSTs developing in the NATL. I couldn't find any other year where 31C SSTs formed around mid-May. 2023 was the closest to it.
1 likes
Re: 2024 Indicators: SST's, MSLP, Shear, SAL, Steering, Instability (Day 16+ Climate Models)
skyline385 wrote:Talking about SSTs, we have areas of 30.5-31C SSTs developing in the NATL. I couldn't find any other year where 31C SSTs formed around mid-May. 2023 was the closest to it.
[url]https://i.postimg.cc/nzm8sQMn/image.png [/url]
[url]https://i.postimg.cc/kGP0WXtK/image.png [/url]
The Key West buoy, a legit deep water buoy, averaged ~30.5C during May 15-17, well above normal:
https://www.ndbc.noaa.gov/data/realtime2/KYWF1.txt
On 5/15-17/23, it was “only” 29.1C:
https://www.ndbc.noaa.gov/view_text_fil ... al/stdmet/
However, from 5/19/23 forward, it reached and soon after exceeded 30.5C and stayed that way through August!
0 likes
Personal Forecast Disclaimer:
The posts in this forum are NOT official forecasts and should not be used as such. They are just the opinion of the poster and may or may not be backed by sound meteorological data. They are NOT endorsed by any professional institution or storm2k.org. For official information, please refer to the NHC and NWS products.
The posts in this forum are NOT official forecasts and should not be used as such. They are just the opinion of the poster and may or may not be backed by sound meteorological data. They are NOT endorsed by any professional institution or storm2k.org. For official information, please refer to the NHC and NWS products.
Re: 2024 Indicators: SST's, MSLP, Shear, SAL, Steering, Instability (Day 16+ Climate Models)
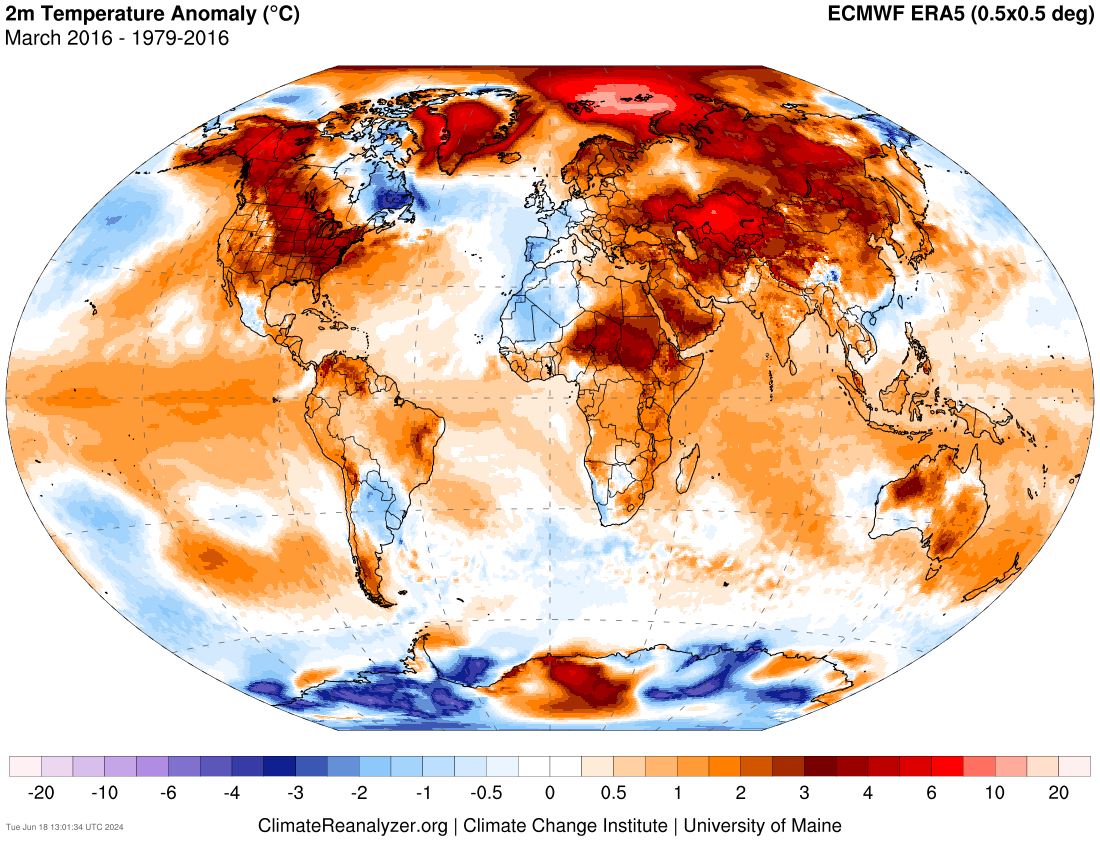
LarryWx wrote: Does anyone know why the MDR anomalies cooled so much between April and peak time in 1983, especially considering no storms there?

Stronger than normal subtropical high in spring-summer 1983 cooled the MDR.
Storms are on synoptic scale, they can't do much to the overall weather pattern like a stronger subtropical ridge since that's on planetary scale.
Last edited by zzzh on Sat May 18, 2024 11:28 am, edited 1 time in total.
1 likes
Re: 2024 Indicators: SST's, MSLP, Shear, SAL, Steering, Instability (Day 16+ Climate Models)
zzzh wrote:LarryWx wrote: Does anyone know why the MDR anomalies cooled so much between April and peak time in 1983, especially considering no storms there?
https://climatereanalyzer.org/research_tools/monthly_maps/output_png/era5-0p5deg_21.png
Stronger than normal subtropical high in spring-summer 1983 cooled the MDR.
Storms are on synoptic scale, they can't do much to the overall weather pattern like a stronger subtropical ridge since that's on planetary scale.
Thanks. Do you have a map showing precip anomalies for the same period?
0 likes
Personal Forecast Disclaimer:
The posts in this forum are NOT official forecasts and should not be used as such. They are just the opinion of the poster and may or may not be backed by sound meteorological data. They are NOT endorsed by any professional institution or storm2k.org. For official information, please refer to the NHC and NWS products.
The posts in this forum are NOT official forecasts and should not be used as such. They are just the opinion of the poster and may or may not be backed by sound meteorological data. They are NOT endorsed by any professional institution or storm2k.org. For official information, please refer to the NHC and NWS products.
Who is online
Users browsing this forum: Google Adsense [Bot], zzzh and 45 guests