2025 Indicators: SST's, MSLP, Shear, SAL, Steering, Instability (Day 16+ Climate Models)

This is the general tropical discussion area. Anyone can take their shot at predicting a storms path.

Moderator: S2k Moderators

Forum rules

The posts in this forum are NOT official forecasts and should not be used as such. They are just the opinion of the poster and may or may not be backed by sound meteorological data. They are NOT endorsed by any professional institution or STORM2K. For official information, please refer to products from the National Hurricane Center and National Weather Service.

Help Support Storm2K
Message
Author
User avatar
Teban54
Category 5
Category 5
Posts: 3204
Joined: Sat May 19, 2018 1:19 pm

Re: 2025 Indicators: SST's, MSLP, Shear, SAL, Steering, Instability (Day 16+ Climate Models)

#401 Postby Teban54 » Fri Jul 11, 2025 1:51 pm

There were a lot of discussions last season, particularly during the anomalously quiet September, about the ITCZ position being too far north. To recap, this is how 2024 looked like. Red is west region (10W to 10E), and Blue is east region (20E to 35E).

Image
Image

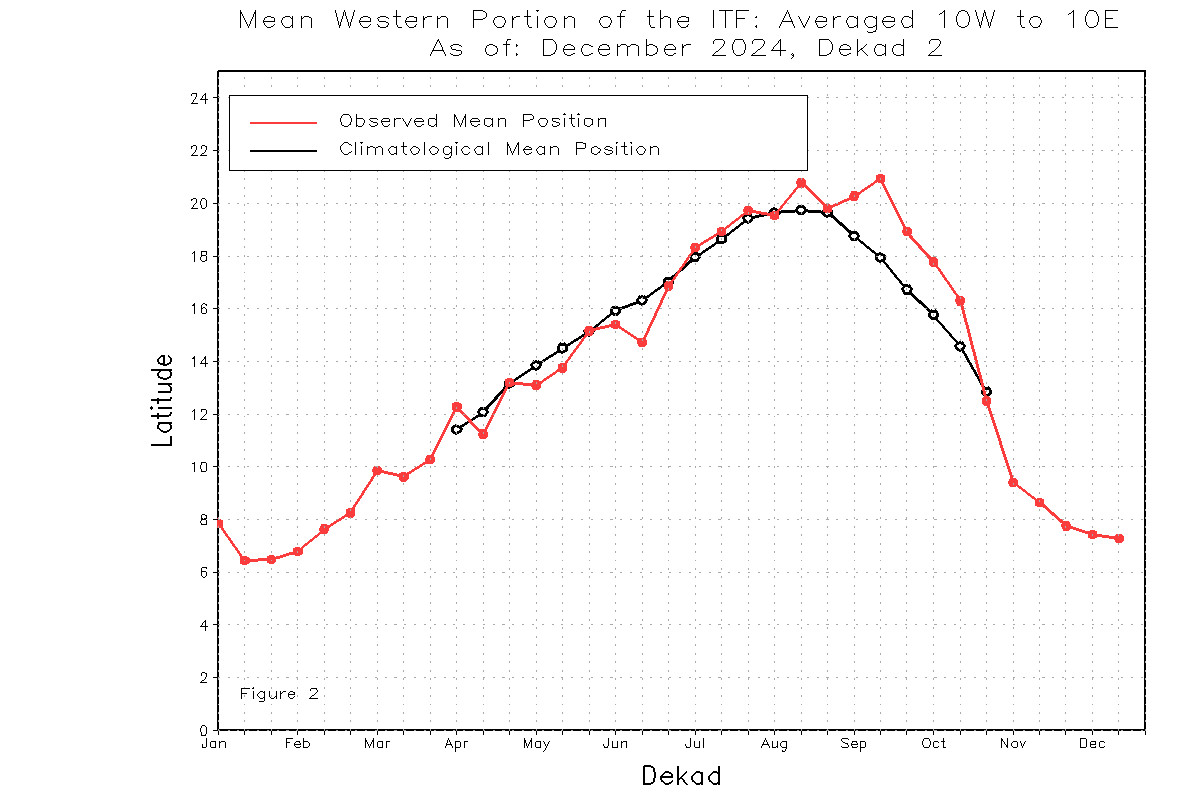
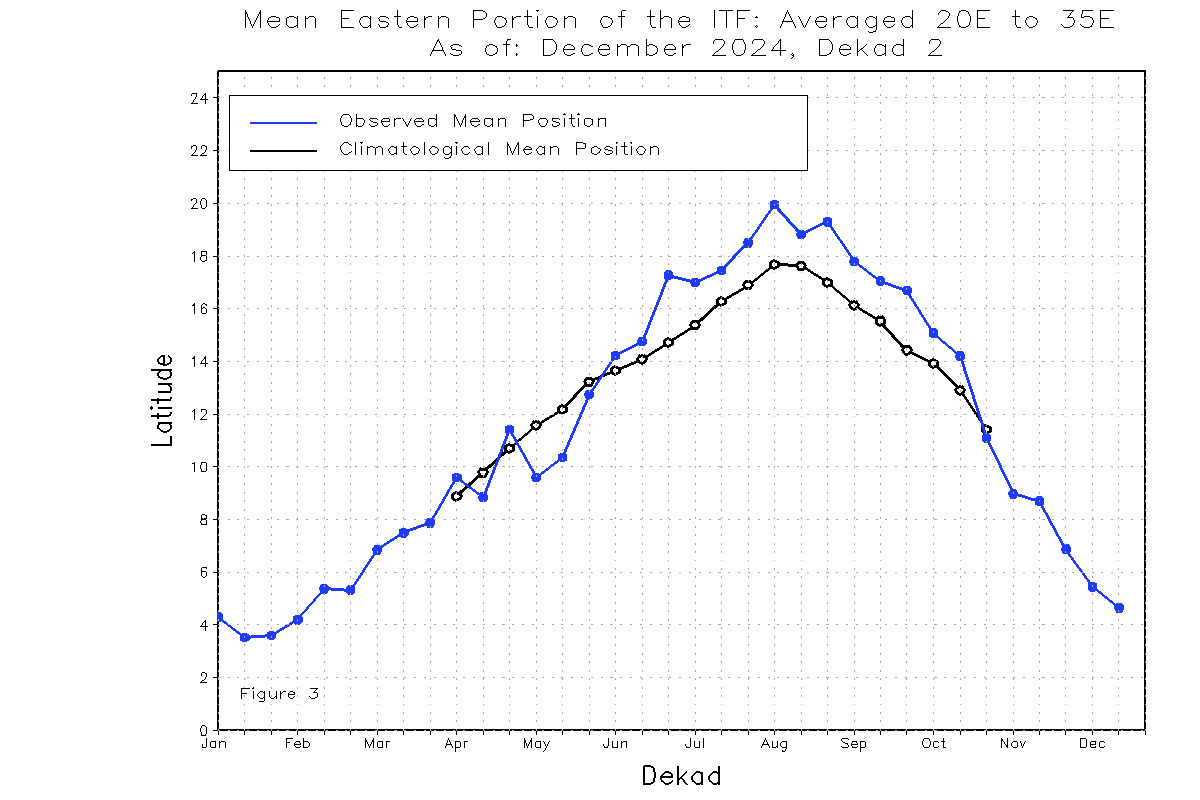
2024's eastern ITCZ started running significantly north of average in late June, which persisted during the entire hurricane season. The western ITCZ was also northward-displaced during September and October, the peak MDR season.

While this northward-displaced ITCZ resulted in anomalously early and late MDR hurricanes (Beryl, Kirk, Leslie), it was generally believed to have contributed to a surprisingly quiet peak season: waves were too far north when entering the Atlantic, and entrenched too much dry air from the Sahara even while still in Africa.

So how does 2025 look?

Image

Image

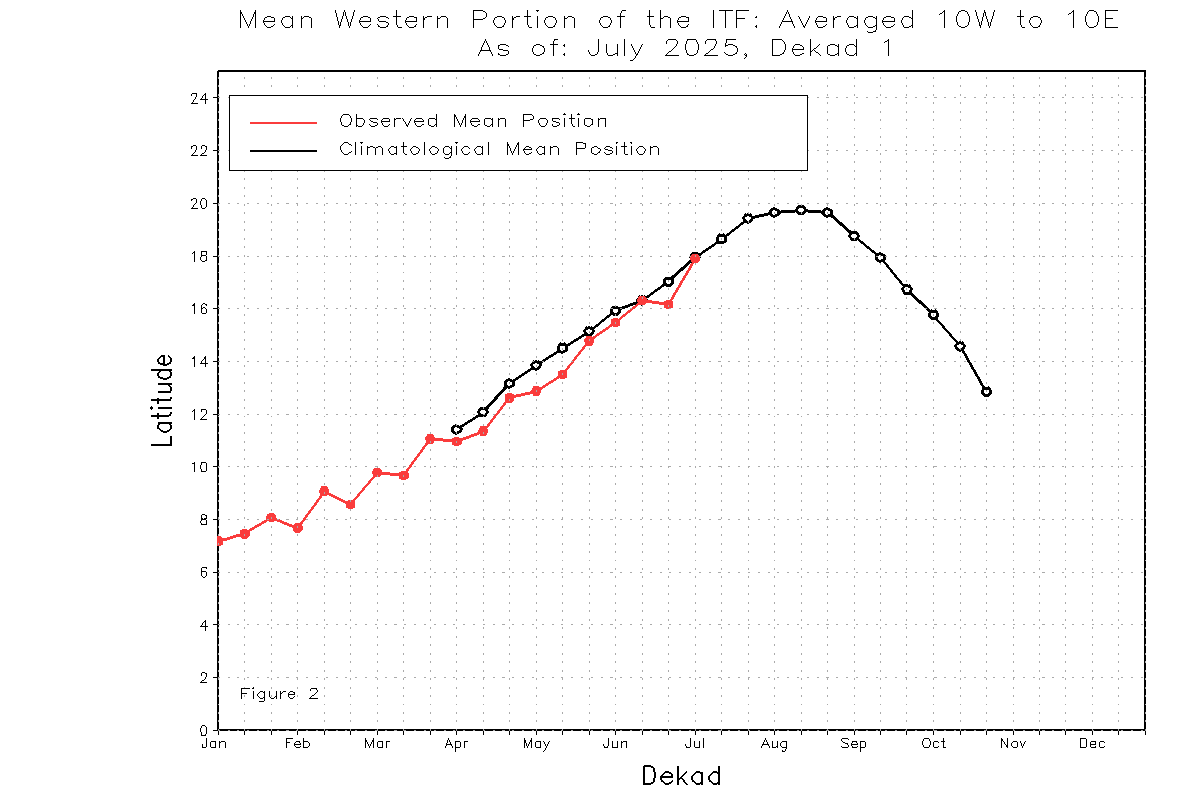
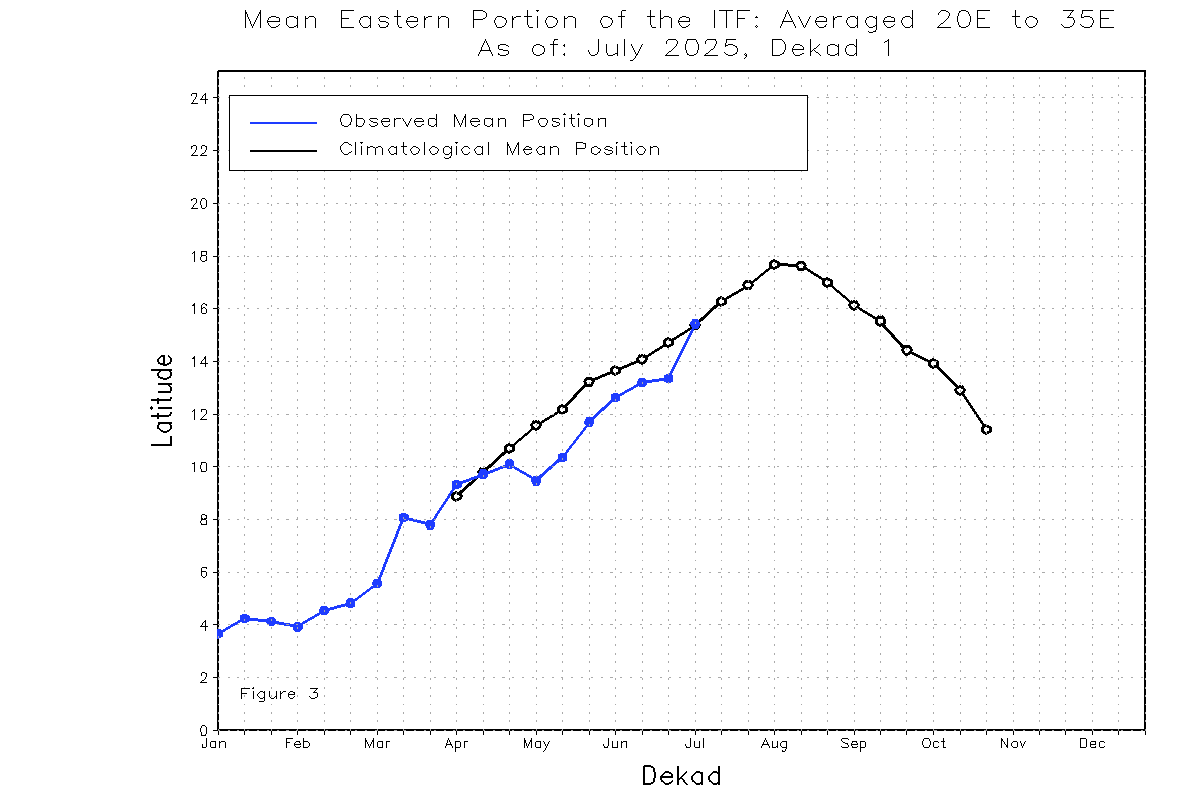
Curiously, while the eastern ITCZ had been south of normal earlier this year, it rose to climo latitude during the first 10 days of July. (The western ITCZ has been mostly near-normal, but IIRC, people thought that the eastern ITCZ was more impactful.)

Note that ITCZ position itself isn't the sole contributor of wave position, dry air and "wave-breaking":
  • 2022: North displaced during September, but largely normal during the storm-free August.
  • 2021 (table only): The season had notable MDR activity (Larry, Sam), much beyond what SSTAs and other indicators would predict, which is often attributed to a strong Atlantic Nino. ITCZ data is hard to read, but looks like the western and eastern halves were south-displaced at different times of the peak season. This may have contributed to storms consistently forming at low latitudes during most of it (Fred, Grace,
  • 2020: Another "odd" hyperactive year with many MDR storms struggling (other than Teddy). ITCZ was very north-displaced in August, possibly resulting in Laura cutting right through the Greater Antilles. But it was fairly normal (with western ITCZ even south of climo) in mid-September when the CV parade happened, yet the storms still formed too far north. So ITCZ isn't the main culprit.
As for what the future holds, I don't know.
4 likes   

LarryWx
S2K Supporter
S2K Supporter
Posts: 6299
Joined: Sun Sep 07, 2003 2:04 pm
Location: GA

Re: 2025 Indicators: SST's, MSLP, Shear, SAL, Steering, Instability (Day 16+ Climate Models)

#402 Postby LarryWx » Sat Jul 12, 2025 1:34 pm

-2025’s 1.46 is 52nd of the last 75 seasons ACEwise as of July 12th

-The last season with 7/12 ACE lower was 2009’s 0

-But 2004, 1998, 1985, 1969, and 1955 also had 0 in addition to 11 others

-The predictive value of 7/12 ACE for the remainder of season’s ACE is virtually 0

-Here’s the 7/12 ACE position out of 74 for seasons with 150+ ACE remainder of season: 2nd, 6th, 14th, 17th, 18th, 24th, 31st, 34th, 59th-61st, 66th

-So, avg 7/12 position of seasons with 150+ ACE to follow: 33rd of 74
3 likes   
Personal Forecast Disclaimer:
The posts in this forum are NOT official forecasts and should not be used as such. They are just the opinion of the poster and may or may not be backed by sound meteorological data. They are NOT endorsed by any professional institution or storm2k.org. For official information, please refer to the NHC and NWS products.

User avatar
cycloneye
Admin
Admin
Posts: 145264
Age: 68
Joined: Thu Oct 10, 2002 10:54 am
Location: San Juan, Puerto Rico

Re: 2025 Indicators: SST's, MSLP, Shear, SAL, Steering, Instability (Day 16+ Climate Models)

#403 Postby cycloneye » Sun Jul 13, 2025 5:48 am

0 likes   
Visit the Caribbean-Central America Weather Thread where you can find at first post web cams,radars
and observations from Caribbean basin members Click Here

WeatherBoy2000
Category 1
Category 1
Posts: 345
Joined: Mon Apr 10, 2023 9:29 am

Re: 2025 Indicators: SST's, MSLP, Shear, SAL, Steering, Instability (Day 16+ Climate Models)

#404 Postby WeatherBoy2000 » Sun Jul 13, 2025 10:56 am


Eric Webb is still skeptical about an active Atlantic hurricane season, despite the recent warming and predicted weakening shear:

 https://x.com/webberweather/status/1944403735431577730


 https://x.com/webberweather/status/1944420258518876668


He points out that the climate models have done poorly in seeing the high shear in the tropical Atlantic so far and thinks that will largely continue, despite some temporary reprieves. Imo whether he ends up mostly right or wrong is going to be down to if the tropical Atlantic stops warming and that the enso doesn't notably cool off as predicted. It would be one thing to be more confident in this prediction if there were an actual el nino in place, but there isn't, so the overall shear pattern is probably more susceptible to change.
5 likes   

User avatar
Category5Kaiju
Category 5
Category 5
Posts: 4095
Joined: Thu Dec 24, 2020 12:45 pm
Location: Seattle

Re: 2025 Indicators: SST's, MSLP, Shear, SAL, Steering, Instability (Day 16+ Climate Models)

#405 Postby Category5Kaiju » Sun Jul 13, 2025 11:10 am

WeatherBoy2000 wrote:


Eric Webb is still skeptical about an active Atlantic hurricane season, despite the recent warming and predicted weakening shear:

 https://x.com/webberweather/status/1944403735431577730


 https://x.com/webberweather/status/1944420258518876668


He points out that the climate models have done poorly in seeing the high shear in the tropical Atlantic so far and thinks that will largely continue, despite some temporary reprieves. Imo whether he ends up mostly right or wrong is going to be down to if the tropical Atlantic stops warming and that the enso doesn't notably cool off as predicted. It would be one thing to be more confident in this prediction if there were an actual el nino in place, but there isn't, so the overall shear pattern is probably more susceptible to change.


Don't get me wrong. I love Eric Webb's analyses and really respect him as a scientist. However, I do think that in this particular case, he might leaning a *little* bit too much into extrapolating what has happened recently to what will happen months down the line. I'd love to know how these models fared in recent years, as that may give us a good barometer for what to expect and what has transpired before.

Wind shear, wind shear, wind shear. Great for tornadoes, bad for hurricanes. If there's anything about wind shear that I think is worth hammering down, it's that it's extremely volatile. Who knew that Delta would've been knocked down just after RIing into a Category 4 because of shear? Oh yeah, and remember that time when we saw the forecast for elevated shear across the Atlantic on August 31, 2019, based on model outputs on August 1, 2019? Danny may be right here, sometimes the broader picture (lowering of wind shear, no El Nino) may be the better answer to our questions.
11 likes   
Unless explicitly stated, all info in my posts is based on my own opinions and observations. Tropical storms and hurricanes can be extremely dangerous. Do not think you can beat Mother Nature. Refer to an accredited weather research agency or meteorologist if you need to make serious decisions regarding an approaching storm.

User avatar
weeniepatrol
Category 5
Category 5
Posts: 1273
Joined: Sat Aug 22, 2020 5:30 pm
Location: WA State

Re: 2025 Indicators: SST's, MSLP, Shear, SAL, Steering, Instability (Day 16+ Climate Models)

#406 Postby weeniepatrol » Mon Jul 14, 2025 1:52 pm

Agreed… we know vertical shear will become more favorable because the TUTT and easterly trades weaken through August. I’m not convinced. Maybe the broader area-averaged mean of the entire tropics exhibits above average shear, but it seems likely that at least a couple systems are going to find a window of “good enough” to develop.
0 likes   

User avatar
weeniepatrol
Category 5
Category 5
Posts: 1273
Joined: Sat Aug 22, 2020 5:30 pm
Location: WA State

Re: 2025 Indicators: SST's, MSLP, Shear, SAL, Steering, Instability (Day 16+ Climate Models)

#407 Postby weeniepatrol » Mon Jul 14, 2025 1:55 pm

Speaking of TUTT, check out this well-defined, textbook example of one.


You can even readily see the upper convergence at the base of the trough through the void on water vapor.
2 likes   

User avatar
cycloneye
Admin
Admin
Posts: 145264
Age: 68
Joined: Thu Oct 10, 2002 10:54 am
Location: San Juan, Puerto Rico

Re: 2025 Indicators: SST's, MSLP, Shear, SAL, Steering, Instability (Day 16+ Climate Models)

#408 Postby cycloneye » Tue Jul 15, 2025 7:37 pm

Andy is not too optimist about this season being above average.

 https://x.com/AndyHazelton/status/1945268797205569717

0 likes   
Visit the Caribbean-Central America Weather Thread where you can find at first post web cams,radars
and observations from Caribbean basin members Click Here

User avatar
Category5Kaiju
Category 5
Category 5
Posts: 4095
Joined: Thu Dec 24, 2020 12:45 pm
Location: Seattle

Re: 2025 Indicators: SST's, MSLP, Shear, SAL, Steering, Instability (Day 16+ Climate Models)

#409 Postby Category5Kaiju » Tue Jul 15, 2025 9:27 pm

cycloneye wrote:Andy is not too optimist about this season being above average.

 https://x.com/AndyHazelton/status/1945268797205569717


Interesting post there by Andy I will say.

However....I'm going to go out on a limb here and say that I have some questions sort to speak, about this methodology of gaging future hurricane activity.

For one, we're looking at May-June patterns, so while I'd understand if we were to look at something like July-August or August-September patterns, how does looking at a certain pattern or set of patterns that early in the hurricane season tell us what will happen in August-November, when the bulk of hurricane action usually occurs?

The other point I want to make is, all of those years share more differences than similarities. I understand that Andy is going for a more qualitative comparison and measurement here, but if you look at the individual ACE scores of each season (as well as such combined with hurricane count, major hurricane count, etc.), you're going to get quite the vast array of results.

Let's take out, as he said, 2002, 2023, and 1986 because of El Nino (which we know tangibly impacts hurricane activity in the Atlantic and which we also know is very unlikely to be applicable this year). 2002 had 67 ACE but two destructive major hurricanes. 1986 was a nothingburger of a season with 36 ACE and no major hurricanes. 2023 had 146 ACE, three major hurricanes (one Category 5), and ended up as the most active traditional El Nino year on record for the Atlantic.

Now we should probably take out 1985 and 1990 because they occurred during a -AMO period with very cool sst anomalies and a dry Sahel region. Obviously that skews activity toward the more inactive end of things (mind you, for its time, 1985 was quite an active season, with 3 major hurricanes).

That leaves us with 2001, 2004, 2012, and 2013. If you look at the exact nature of activity in each of those seasons, you'll see that they are so different that you might as well ask if a zebra is the same thing as a penny. But more importantly, I don't think that 2001 and 2012 are good comparisons for this year because they occurred more than 2 years after the preceeding El Nino (if we go by the 2022 hypothesis that being far out from an El Nino brings in some unfavorable factors that somehow cap a season's potential). And even so, they were both near to above average seasons that delivered major, destructive hurricanes. And then there's 2013. Which...I don't think I need to explain why I think it's a horrible comparison, let alone to any year that'll happen anytime soon. I don't want to beat a dead horse. :lol:

My point here is, it's interesting to read about this analysis. I won't lie, it's quite fascinating. But I think in terms of general activity level expectations, there are probably bigger, better known and more reliable mechanisms and factors worth looking at that also are known to have impacts on Atlantic activity, for more or less.
4 likes   
Unless explicitly stated, all info in my posts is based on my own opinions and observations. Tropical storms and hurricanes can be extremely dangerous. Do not think you can beat Mother Nature. Refer to an accredited weather research agency or meteorologist if you need to make serious decisions regarding an approaching storm.


Return to “Talkin' Tropics”

Who is online

Users browsing this forum: abajan, Google Adsense [Bot] and 14 guests