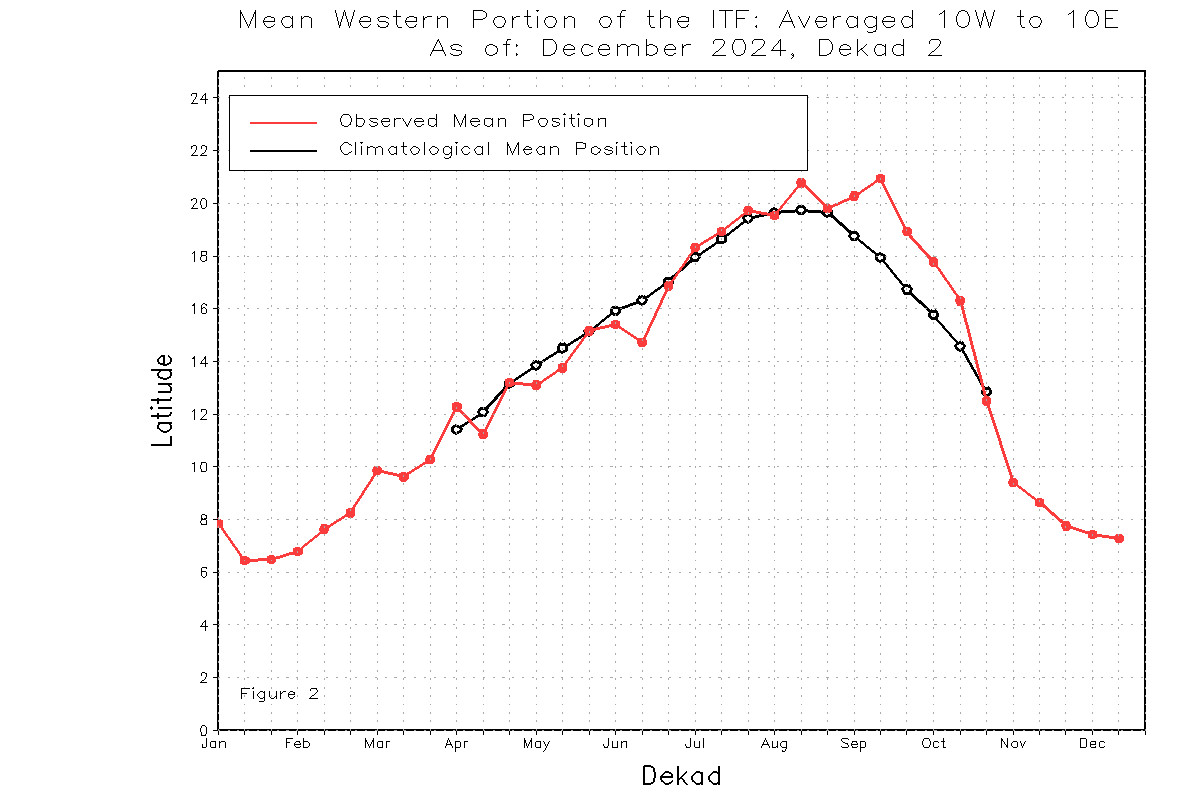
Teban54 wrote:There were a lot of discussions last season, particularly during the anomalously quiet September, about the ITCZ position being too far north. To recap,
this is how 2024 looked like. Red is west region (10W to 10E), and
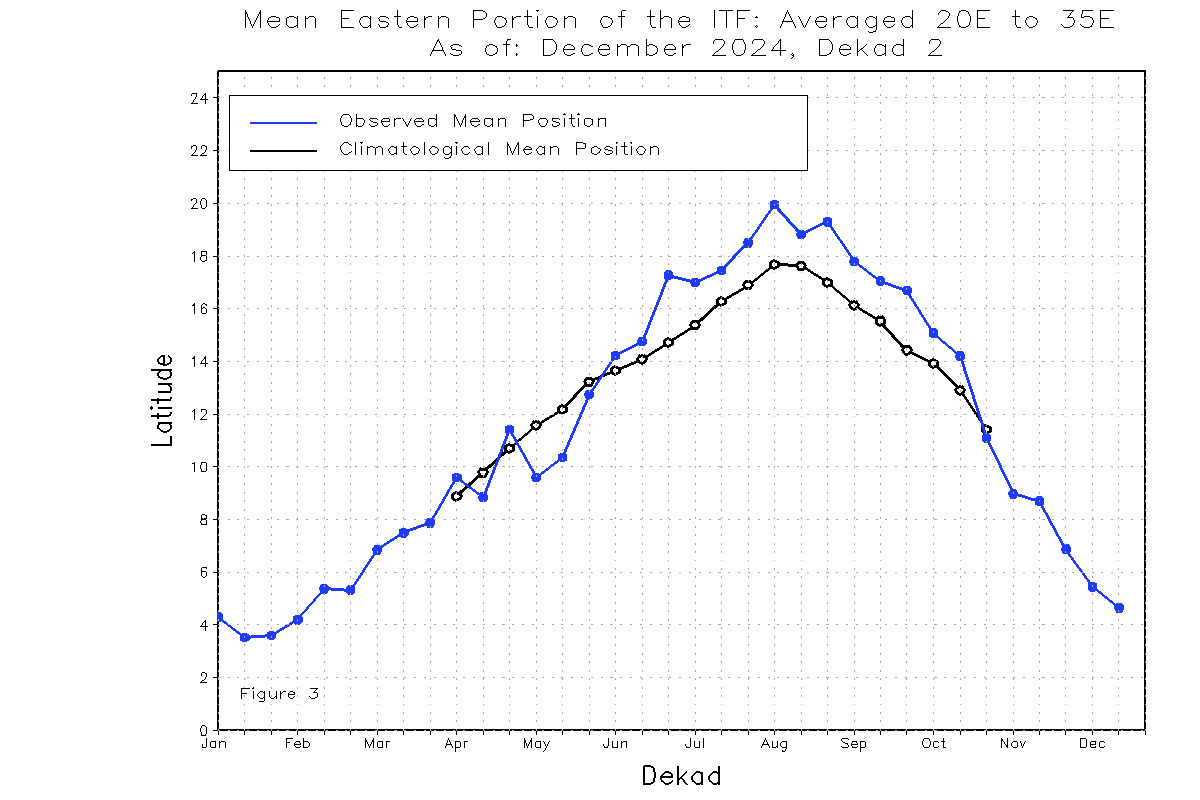
Blue is east region (20E to 35E).[url]https://i.postimg.cc/qRjVh5ns/west.png [/url]
[url]https://i.postimg.cc/4yyCzQbr/east.png [/url]
2024's eastern ITCZ started running significantly north of average in late June, which persisted during the entire hurricane season. The
western ITCZ was also northward-displaced during September and October, the peak MDR season.
While this northward-displaced ITCZ resulted in anomalously early and late MDR hurricanes (Beryl, Kirk, Leslie), it was generally believed to have contributed to a surprisingly quiet peak season: waves were too far north when entering the Atlantic, and entrenched too much dry air from the Sahara even while still in Africa.
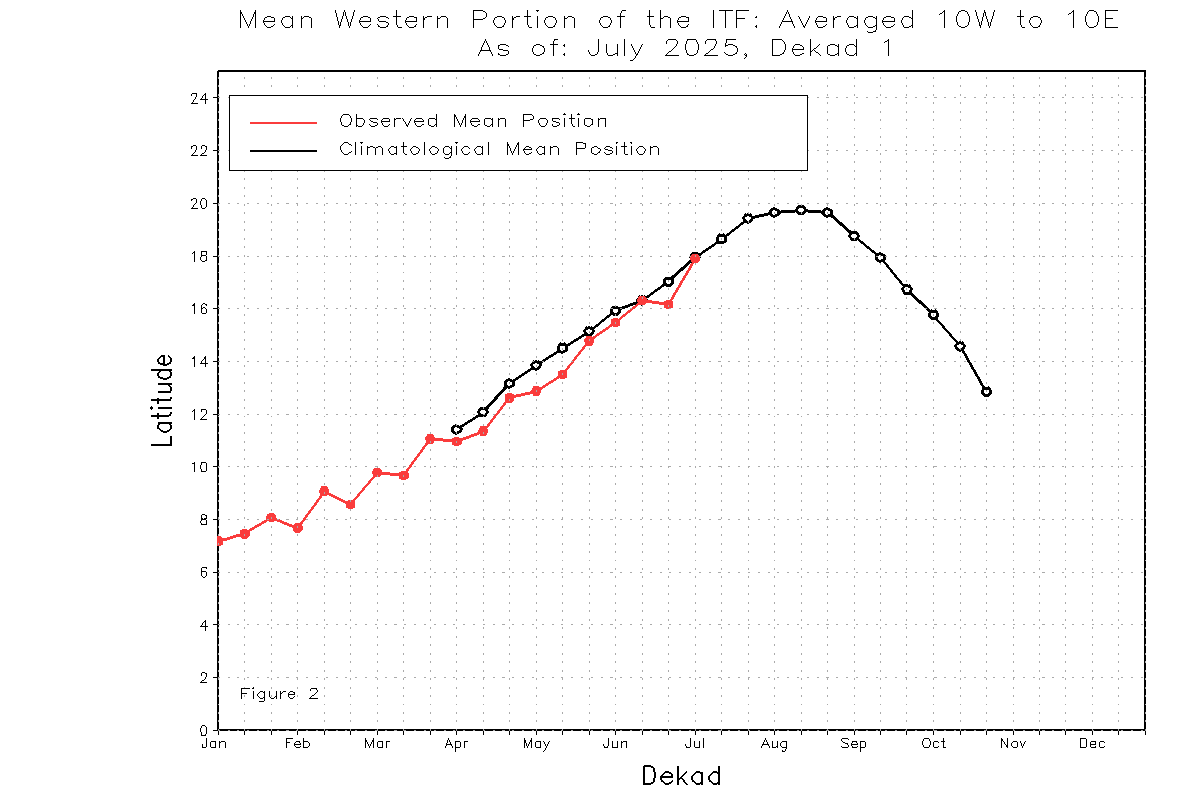
So how does
2025 look?
[url]https://i.postimg.cc/Y0s58Ldj/west.png [/url]
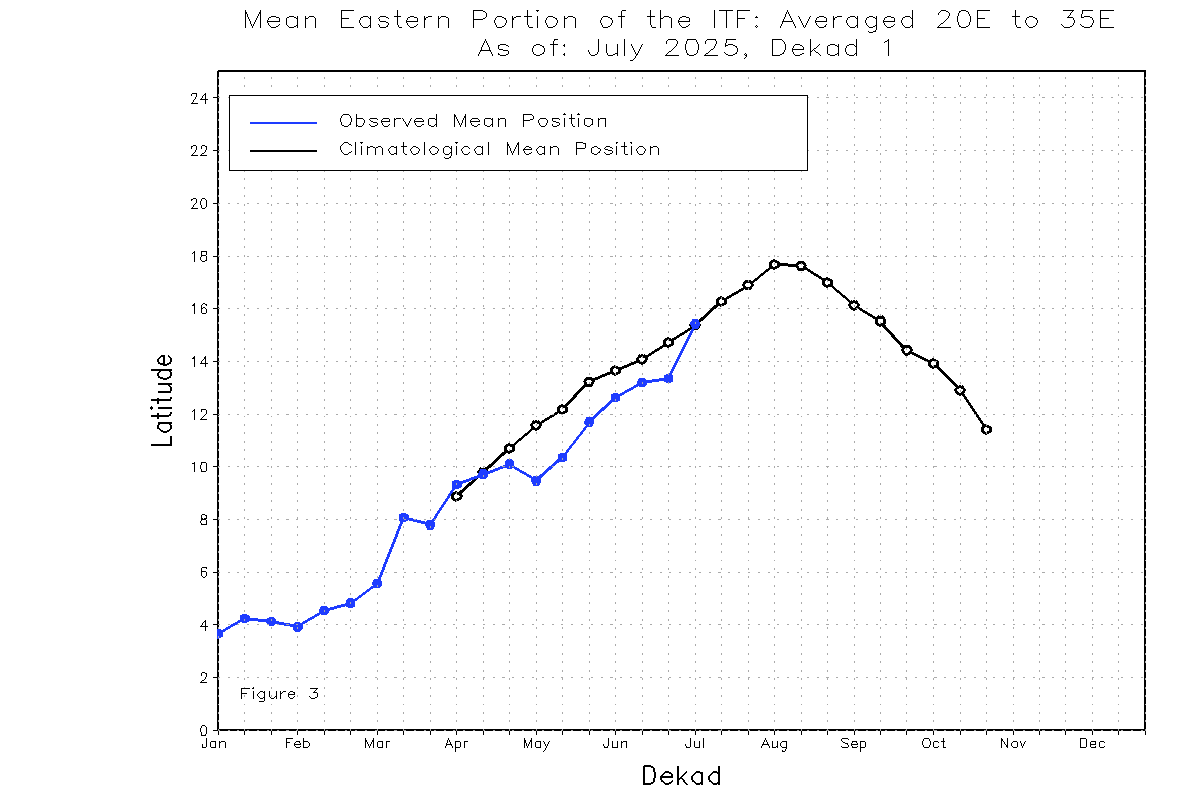
[url]https://i.postimg.cc/ncsbrTLm/east.png [/url]
Curiously, while the
eastern ITCZ had been
south of normal earlier this year, it rose to climo latitude during the first 10 days of July. (The
western ITCZ has been mostly near-normal, but IIRC, people thought that the
eastern ITCZ was more impactful.)
Note that
ITCZ position itself isn't the sole contributor of wave position, dry air and "wave-breaking":
- 2022: North displaced during September, but largely normal during the storm-free August.
- 2021 (table only): The season had notable MDR activity (Larry, Sam), much beyond what SSTAs and other indicators would predict, which is often attributed to a strong Atlantic Nino. ITCZ data is hard to read, but looks like the western and eastern halves were south-displaced at different times of the peak season. This may have contributed to storms consistently forming at low latitudes during most of it (Fred, Grace,
- 2020: Another "odd" hyperactive year with many MDR storms struggling (other than Teddy). ITCZ was very north-displaced in August, possibly resulting in Laura cutting right through the Greater Antilles. But it was fairly normal (with western ITCZ even south of climo) in mid-September when the CV parade happened, yet the storms still formed too far north. So ITCZ isn't the main culprit.
As for what the future holds, I don't know.
Great post, a lot of good points here. I think AEWs are super fascinating and a lot of current research has/is currently being done on this topic (
If I wasn't pathologically obsessed with hurricanes and rapid intensification events I would totally have picked this as my grad research). I'll iterate on some of your points and build on the topic for those who are less familiar (while also including more technical tidbits for those further interested in this topic).
What even is an African Easterly 'Wave' (AEW)?At its very core, an AEW (or tropical wave/easterly wave when they reach the Atlantic) is just a trough or disturbance that is initially embedded within the ITF/ITCZ. They exhibit an oscillating pattern in the atmosphere (
just like Rossby waves, but in the mid-troposphere), hence why we refer to them as waves.
Why are they important?On average, AEWs contribute 20% of the overall genesis of tropical cyclones in the North Atlantic (but it can be much higher than this). If you want to look more into this topic, one of the pioneers in this research is Dr. Thorncroft (current professor at Albany,
quite literally spent most of his life studying this topic). He did a study of the 2004 hurricane season, and found that nearly half (45% to be exact) of the tropical cyclones that formed that year originated from AEWs.
What does an AEW/tropical wave actually look like?This section is a bit more technical, but if you really want to see the nuts and bolts, I created a diagram below of an idealized tropical wave at 700mb:

The
wave axis is essentially the symmetrical axis of the trough of low pressure. It is typically oriented north -> south (but can tilt towards the east or west) and marks the region of the lowest atmospheric pressure within the wave.
The
isobars associated with a tropical wave tilt upward with height, which is a hallmark of a baroclinic system (a system with temperature gradients that influence pressure and wind fields). This tilt is primarily westward with height, meaning the trough axis at higher altitudes is displaced to the west of the surface trough. This westward tilt influences the vertical structure of the wave, affecting where
convergence and
divergence occur and how the wave interacts with the surrounding atmosphere.
East of the
wave axis,
winds are generally northeasterly or easterly, as the trade winds are deflected by the low-pressure trough. The flow is slightly poleward (toward the north in the Northern Hemisphere) due to the cyclonic curvature of the
isobars. This is why we originally see more convective activity behind the wave axis, as this region is typically associated with
convergence, leading to rising air, cloud formation, and precipitation.
West of the
wave axis,
winds are southeasterly or easterly, with a more equatorward component (toward the south in the Northern Hemisphere) due to the anticyclonic curvature on the western side of the trough. This region is typically associated with
divergence and sinking air.
How does it originate?This is where things get exciting, because a lot of research is still being done on what the actual ‘trigger’ is for an AEW. First, we need to establish some terms and then do a little geographical journey together through Africa and look at the topographical features.
The main mechanism is driven by instabilities in the
African Easterly Jet (AEJ). Essentially, this is a mid-level wind maximum over primarily West Africa at around ~700 hPa, centered around 10-15N latitude. This is essentially the ‘highway’ that these AEW disturbances travel on as they move westward towards the Atlantic.
In fact, Africa has a total of four jets (pictured below with seasonal positions). We see a northern propagation of these jets in Boreal summer (due to the solar zenith angle) when the Northern Hemisphere dominates in warmth, and a southern propagation that reaches a maximum around January (when the Southern Hemisphere dominates the warmth gradient):
 https://www.researchgate.net/publication/227235890_Understanding_the_Large_Scale_Driving_Mechanisms_of_Rainfall_Variability_over_Central_Africa
The main takeaway here is that it’s this temperature contrast (particularly between the warm, moist air over the Guinea Coast and the hot, dry air over the desert Sahara) that creates a baroclinic zone (a region with strong temperature gradients), leading to winds changing speed or direction with height (i.e., vertical wind shear). This is the main mechanism that destabilizes the flow, causing these perturbations to grow into waves.
So we covered what amplifies these waves and ‘feeds’ them, but we introduced a new word, perturbations. What are these and where do these perturbations actually start at? We need three ingredients here: instability (covered above), lift, and moisture. This is where we have to look at topography for answers:

Current thinking is (and why the eastern ITF position is more relevant), that the oscillating energy/perturbation (or where our wave first originates) is in far Eastern Africa. Essentially, temperature gradients, convective potential, and most importantly orographic lift is critical here.
In our idealized path outlined in white in the diagram above, starting at (1) and (2) in eastern Africa, this is where we have significant orographic lift due to the mountainous terrain in eastern Africa. In fact, we have this wind tunnel positioned near the Ethiopian Highlands/Uganda. This gives us the necessary lift for our air parcels and spawns an initial mesoscale convective system (MCS).
When we get to (3) near the Darfur Mountains, we have this acceleration of winds again and the potential for additional orographic lift, which we again can experience at (4).
But where does the moisture come from? Our blue/teal arrows in the diagram above (both from the fertile regions located over Africa and the Atlantic Ocean) provide this moisture. While Florida is commonly referred to as the ‘lightning capital of the world’, if we look at per km, Africa actually exhibits more lightning strikes per year:
 How do we apply this in the real world?
Now the fun part, we can go use all this knowledge to track AEWs over Africa! Here is a satellite image of Africa (
https://view.eumetsat.int/productviewer?v=default) from today and we can now roughly outline these features: