This is the wave most likely to watch:

Moderator: S2k Moderators


USTropics wrote:The CFS has shown a long tracker the past 5 runs, with varying degrees of intensity each run the last week of July/beginning of August. Track seems to be through the Bahamas/Caribbean:
https://i.ibb.co/wgsD2Mv/Webp-net-gifmaker-4.gif
This is the wave most likely to watch:
https://i.imgur.com/2On4Yzo.png


gatorcane wrote:All of these models and fancy graphics, tweets, etc might look ominous but let’s face it, there is just little skill in long-range forecasting of tropical cyclones. That’s why all of the “indicators” should be taken with a grain of salt. The main signal it could be active in the Atlantic is because of the above normal SSTs across the Atlantic in the MDR and lack of El Niño. It should be active and above normal but just wouldn’t be too quick to say that it equates to active landfall season. The other thing is that there is no sign in the models for any WPAC activity. It is early but as we head into July would expect to see something. There could easily be something else we can’t see yet that helps suppress global cyclone activity more than expected including the Atlantic.


toad strangler wrote:gatorcane wrote:All of these models and fancy graphics, tweets, etc might look ominous but let’s face it, there is just little skill in long-range forecasting of tropical cyclones. That’s why all of the “indicators” should be taken with a grain of salt. The main signal it could be active in the Atlantic is because of the above normal SSTs across the Atlantic in the MDR and lack of El Niño. It should be active and above normal but just wouldn’t be too quick to say that it equates to active landfall season. The other thing is that there is no sign in the models for any WPAC activity. It is early but as we head into July would expect to see something. There could easily be something else we can’t see yet that helps suppress global cyclone activity more than expected including the Atlantic.
Well if all the indicators should be taken like a grain of salt that would mean this entire thread should be.And I would say this thread is the backbone of this forum.


Shell Mound wrote:https://twitter.com/webberweather/status/1280581682068946944
https://pbs.twimg.com/media/EcWJ5wJXkAEJ1qs?format=jpg&name=medium
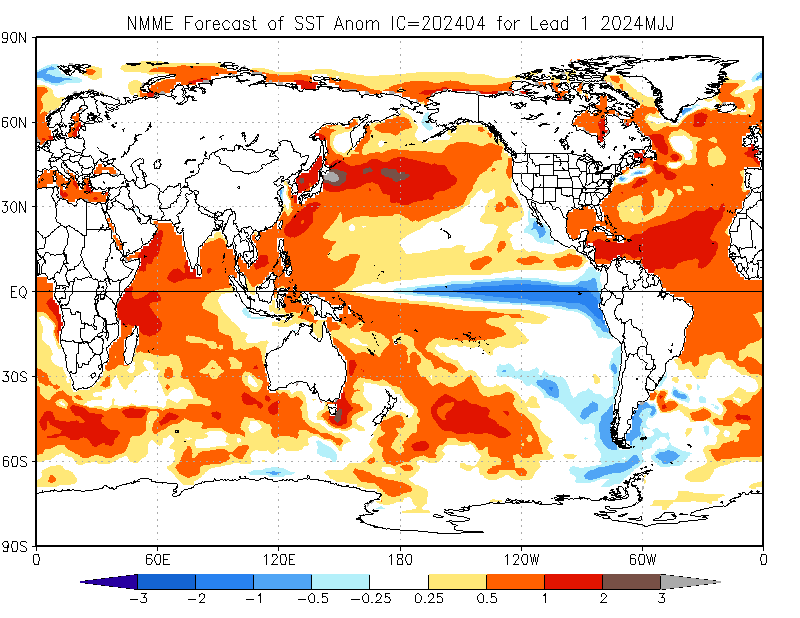
https://www.cpc.ncep.noaa.gov/products/NMME/current/images/NMME_ensemble_tmpsfc_season1.png
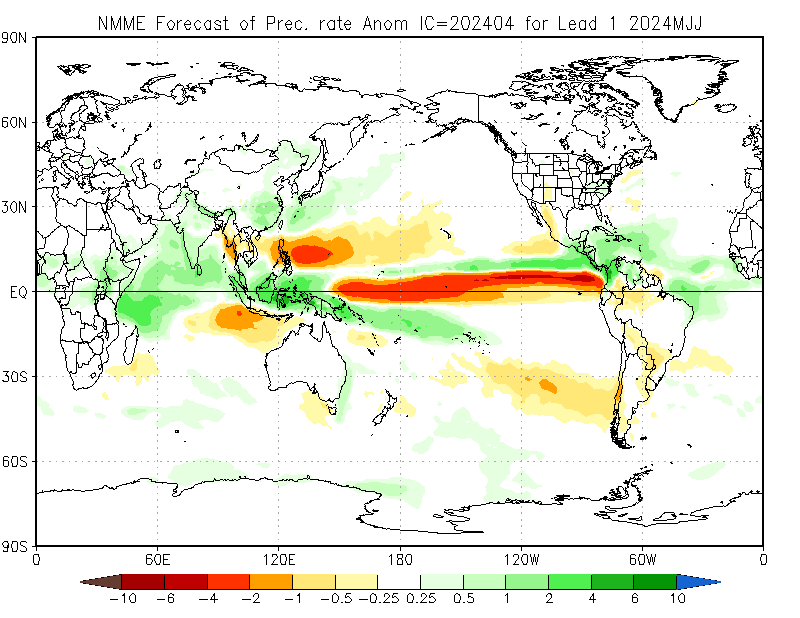
https://www.cpc.ncep.noaa.gov/products/NMME/current/images/NMME_ensemble_prate_season1.png
https://www.tropicaltidbits.com/analysis/models/cfs-mon/2020070818/cfs-mon_01_ashear_atl_1.png
https://www.tropicaltidbits.com/analysis/models/cfs-mon/2020070818/cfs-mon_01_ssta_atl_1.png
Does anyone know why the latest NMME shows drier conditions over the northern MDR, southwestern Atlantic, western Caribbean, and most of the Gulf of Mexico compared to its previous run? Is this related to the fact that the latest CFSv2, one of the models used in compiling the NMME, is showing a very strong TUTT over most of the basin during the month of August? The CFSv2 shows El Niño-like VWS during the month of August, while the E/CPAC is actually rather favourable. What could be causing that? Note that the CFSv2, like the NMME, also shows a very pronounced warm pool over the subtropical northwestern Atlantic, despite an otherwise favourable setup with cool neutral ENSO/weak La Niña, weak -IOD, -PDO, +AMO (in the deep tropics), and strong WAM/AEJ? (Notably, the latest NMME really strengthens La Niña and the rising branch over the MC during ASO.)
AutoPenalti wrote:That's a lot of shear for August... what MDR system is going to survive that trek?


Shell Mound wrote:AutoPenalti wrote:That's a lot of shear for August... what MDR system is going to survive that trek?
What’s even more surprising is that no one is really mentioning it, much less probing for causes. The shear even shows at 200 mb over the western MDR:
https://www.tropicaltidbits.com/analysis/models/cfs-mon/2020070900/cfs-mon_01_u200a_atl_1.png
https://www.tropicaltidbits.com/analysis/models/cfs-mon/2020070900/cfs-mon_01_ashear_atl_1.png

Shell Mound wrote:https://twitter.com/webberweather/status/1280581682068946944
https://pbs.twimg.com/media/EcWJ5wJXkAEJ1qs?format=jpg&name=medium
https://www.cpc.ncep.noaa.gov/products/NMME/current/images/NMME_ensemble_tmpsfc_season1.png
https://www.cpc.ncep.noaa.gov/products/NMME/current/images/NMME_ensemble_prate_season1.png
https://www.tropicaltidbits.com/analysis/models/cfs-mon/2020070818/cfs-mon_01_ashear_atl_1.png
https://www.tropicaltidbits.com/analysis/models/cfs-mon/2020070818/cfs-mon_01_ssta_atl_1.png
Does anyone know why the latest NMME shows drier conditions over the northern MDR, southwestern Atlantic, western Caribbean, and most of the Gulf of Mexico compared to its previous run? Is this related to the fact that the latest CFSv2, one of the models used in compiling the NMME, is showing a very strong TUTT over most of the basin during the month of August? The CFSv2 shows El Niño-like VWS during the month of August, while the E/CPAC is actually rather favourable. What could be causing that? Note that the CFSv2, like the NMME, also shows a very pronounced warm pool over the subtropical northwestern Atlantic, despite an otherwise favourable setup with cool neutral ENSO/weak La Niña, weak -IOD, -PDO, +AMO (in the deep tropics), and strong WAM/AEJ? (Notably, the latest NMME really strengthens La Niña and the rising branch over the MC during ASO.)
cycloneye wrote:https://twitter.com/AndyHazelton/status/1281308278593642497
Hammy wrote:Any clue as to what's causing the nonstop lack of instability/dryness in the Atlantic? This seems like an ongoing factor since 2011.
Users browsing this forum: Google Adsense [Bot] and 86 guests