A lull of activity is not a bellwether for activity later on in the season. Every season, even the hyperactive seasons, have lulls of activity in which there is little to no tropical activity. These lulls are caused by intraseasonal variation.
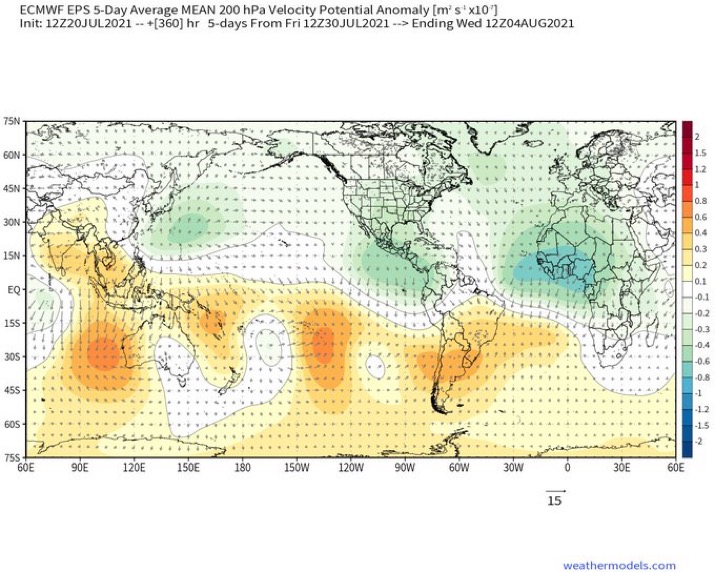
The Madden-Julian Oscillation is a wave that runs across the equator multiple times a year. The Madden-Julian Oscillation has active and suppressed phases. Throughout the course of a hurricane season, a basin will experience multiple active and suppressed phases. During an active phase, there is rising air over a basin, leading to lower wind shear and higher SSTs. During a suppressed phase, there is sinking air over a basin, leading to higher wind shear and lower SSTs. The MJO always does it course, no matter if a season is hyperactive or inactive.
2005 had a lull of activity in early August; to have thought that such a lull would have meant an inactive season would have been dangerous, for over three thousand people died during that season. 2010 had a lull of activity in late July; however, the season was one of the most active of all time in terms of storms and hurricanes. 2017 had a lull of activity in late July, yet the season had Hurricanes Harvey, Irma, Maria, and Nate. 2020 had a lull of activity in early August, and everyone on this forum knows how active that season was. At the moment, there is a lull of activity in the Atlantic, but that in no way means those in hurricane-prone areas should be laughing too hard.
Hopefully, this post will end the "season cancelled" posts once and for all.