

WiscoWx02 wrote:LarryWx wrote:ScottNAtlanta wrote:Accuweather is going all in September
https://youtu.be/ywHWLaf5o9Q?si=WTv5KQbY1nvd73yR
In this Bernie Rayno says due to the ITCZ being down at 10N, the MDR waves are currently having difficulty developing. He said that normally the ITCZ is up at 15N at this time of year. He implied it will later go up to 15N and then allow AEWs to develop again.
This sounds like the reverse of what I’m reading here. Here I’m reading that waves are coming off Africa so far N (20N) that they’re too dry to develop due to having traveled over desert.
So these two things sound contradictory/inconsistent: ITCZ S of normal (10N) and AEWs N of normal (20N). Are both of these true? If so, how/why?
So, Danny Morris refers to the “northern displaced ITCZ” in here:
https://x.com/dmorris9661/status/182709 ... _&ref_url=
And Bernie Rayno at 2:55-3:10 of this says ITCZ is 5 degrees S of normal (10N instead of 15N):
https://m.youtube.com/watch?v=ywHWLaf5o9Q
So, what’s the truth?
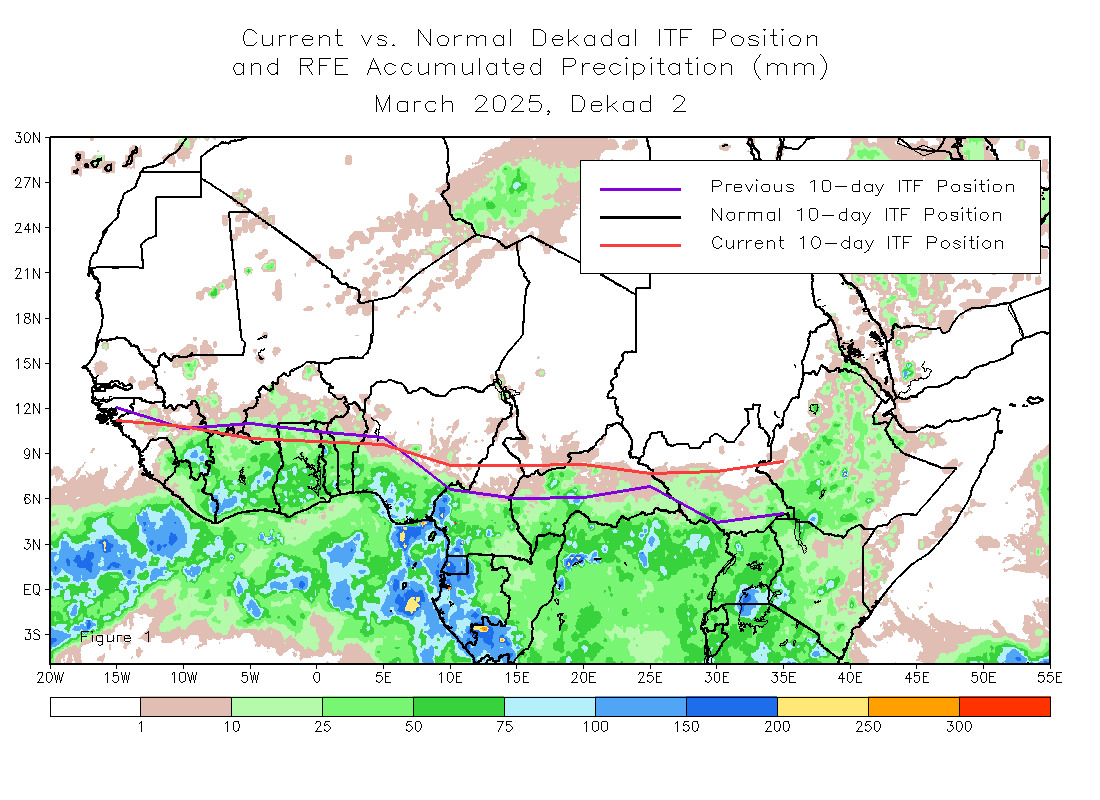
I included the current ITCZ tracker from the CPC to help bring clarity here below...
https://www.cpc.ncep.noaa.gov/products/international/itf/itcz.jpg
Danny Morris has it correct, while accuweather goofed here. The ITCZ is and has been anomalously far north for the last few weeks. Because of this, tropical waves are tracking across Africa further north. The result of tropical waves tracking further north is that they tend to pick up more dust and dry air that stabilizes the atmosphere and are sending it out over the Atlantic ahead and behind them. This is why tropical cyclone formation has been a hard feat to achieve out over the Atlantic as of late and may very well continue to be an issue through peak season unless we see the ITCZ shift southward and ridging over Europe (which is also helping pump dry air out over the Atlantic) collapses.
Thanks very much for your reply. Are you saying that when Bernie Rayno pointed to the “white and blue” as the ITCZ that he was totally wrong? Did you see that part of the video? How can he, a pro met. for several decades be so wrong on something basic like that?


