2024 Indicators: SST's, MSLP, Shear, SAL, Steering, Instability (Day 16+ Climate Models)

This is the general tropical discussion area. Anyone can take their shot at predicting a storms path.

Moderator: S2k Moderators

Forum rules

The posts in this forum are NOT official forecasts and should not be used as such. They are just the opinion of the poster and may or may not be backed by sound meteorological data. They are NOT endorsed by any professional institution or STORM2K. For official information, please refer to products from the National Hurricane Center and National Weather Service.

Help Support Storm2K
Message
Author
User avatar
ScottNAtlanta
Category 5
Category 5
Posts: 2360
Joined: Sat May 25, 2013 3:11 pm
Location: Atlanta, GA

Re: 2024 Indicators: SST's, MSLP, Shear, SAL, Steering, Instability (Day 16+ Climate Models)

#2141 Postby ScottNAtlanta » Sun Aug 25, 2024 2:59 pm

WiscoWx02 wrote:
LarryWx wrote:
WiscoWx02 wrote:
I did indeed...we all make mistakes as meteorologists, be it terminology, pointing at the wrong thing...it happens :lol: I certainly wouldn't judge him too heavily for that.


Fair enough. I’ll let it slide. :lol:
I looked at the ITCZ map. I see that it is 2-3 degrees N of normal over E half of Africa but then it is right at normal over the W half. Is that enough N to make a big difference in how dry the AEWs are? And with it at its normal position over the W half of Africa, why would AEWs be coming off Africa N of normal position?


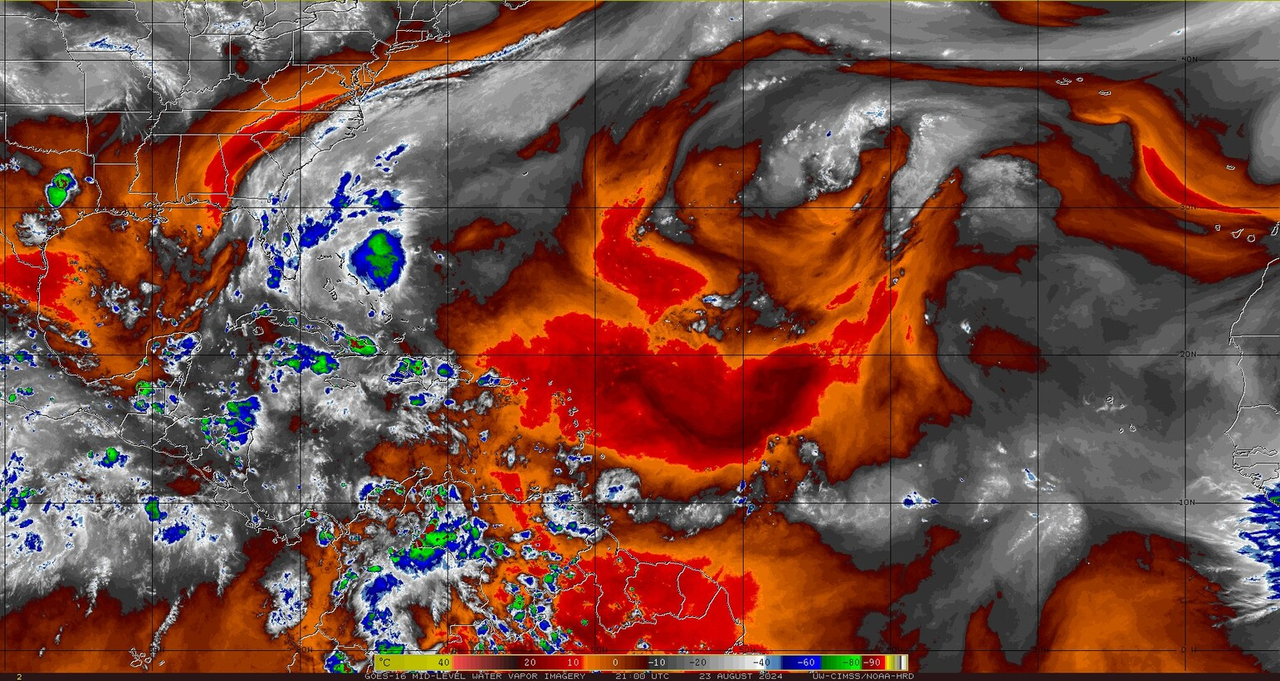
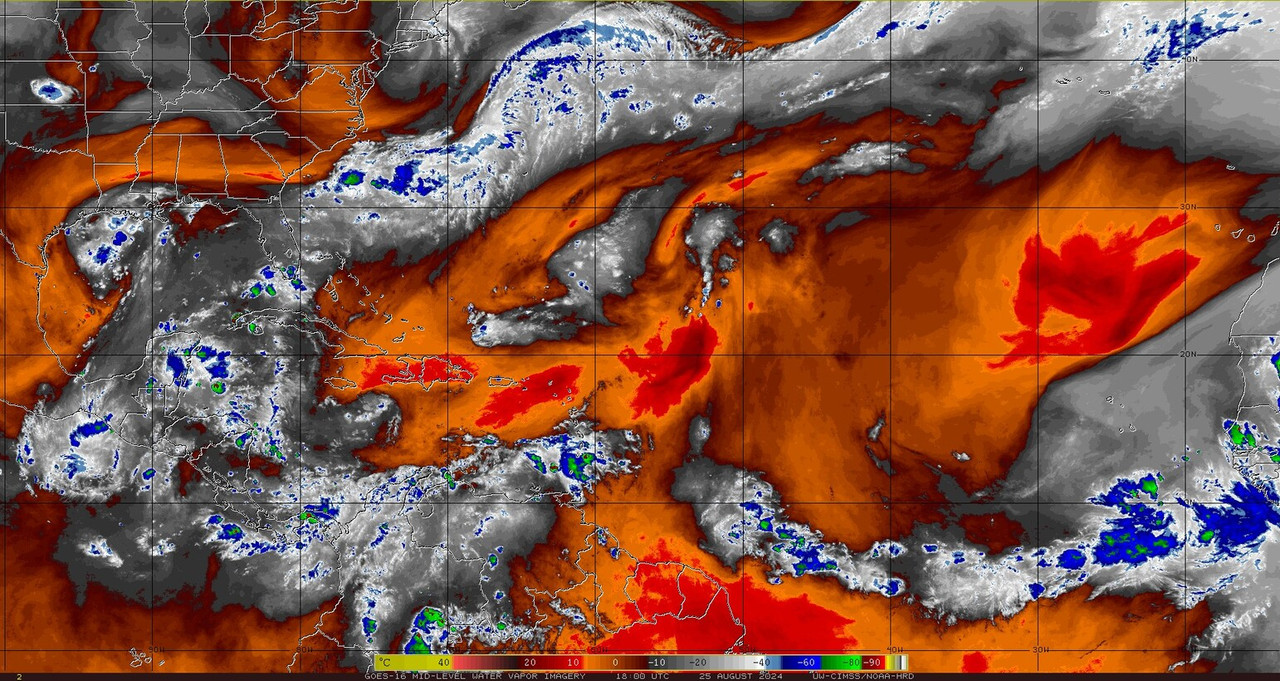
If I remember correctly, the source region for a majority of Saharan Dust is this little basin in Sudan or Chad...where the ITCZ has been further than north as of late. I can't remember for the life of me what the basin/depression is called but I remember discussion of it either on here or Twitter a couple of years ago. One would surmise that a further north displaced ITCZ would bring stronger easterly winds to the basin, stirring up more dust which can then hitch a ride with the screaming AEJ. I won't pretend I know that as 100% fact, but that is my thought process behind it. Again though, this isn't the only reason dry air has been flooding the Atlantic basin and killing off most of the tropical waves that have attempted to exit Africa...ridging over Europe plays a major part in that too...if you look at 700-300mb relative humidity model runs, dry air coming down from the north in the eastern Atlantic is a big killer as well. This is because you have blocking over Europe that doesn't allow things to progress, so you are stuck with the same atmosphere pattern that is pushing dry air into the deep tropics from the north for weeks at a time...that high needs to break down and allow things to move along from my understanding for things to really get going again.

That would be the Bodélé Depression

https://www.google.com/search?sca_esv=1 ... 62&bih=938
0 likes   
The posts in this forum are NOT official forecast and should not be used as such. They are just the opinion of the poster and may or may not be backed by sound meteorological data. They are NOT endorsed by any professional institution or storm2k.org. For official information, please refer to the NHC and NWS products.

User avatar
Hammy
Category 5
Category 5
Posts: 5849
Age: 41
Joined: Fri May 25, 2012 5:25 pm
Contact:

Re: 2024 Indicators: SST's, MSLP, Shear, SAL, Steering, Instability (Day 16+ Climate Models)

#2142 Postby Hammy » Sun Aug 25, 2024 3:14 pm

Some interesting historical context, 2000 and 01 were about the same place as this year (though 2024's ACE is spades higher) and here's 2001 through September 5, and 2000 through September 10.

Image
Image
2 likes   
The above post is not official and should not be used as such. It is the opinion of the poster and may or may not be backed by sound meteorological data. It is not endorsed by any professional institution or storm2k.org. For official information, please refer to the NHC and NWS products.

User avatar
weeniepatrol
Category 5
Category 5
Posts: 1252
Joined: Sat Aug 22, 2020 5:30 pm
Location: WA State

Re: 2024 Indicators: SST's, MSLP, Shear, SAL, Steering, Instability (Day 16+ Climate Models)

#2143 Postby weeniepatrol » Sun Aug 25, 2024 3:21 pm

CyclonicFury wrote:I have long been a skeptic of the common theory that the MDR has become more stable in recent years, but this graph does seem to show that, at least for the months of June and July. MDR SSTs at the surface have been warmer than ever, but it does seem as if 200mb temperatures in the MDR have significantly warmed over the last 2 decades or so.


It IS consistent with Hadley cell expansion. Geopotential heights are rising on decadal timescales. Pretty easy to imagine warming aloft due to this.

Image
1 likes   

User avatar
Teban54
Category 5
Category 5
Posts: 3168
Joined: Sat May 19, 2018 1:19 pm

Re: 2024 Indicators: SST's, MSLP, Shear, SAL, Steering, Instability (Day 16+ Climate Models)

#2144 Postby Teban54 » Sun Aug 25, 2024 3:40 pm

At the risk of sounding like an idiot... How certain are we that 2024's dry air issues are anomalously below average (i.e. much worse than climo), instead of just (it seems dry)?

I've been playing around with the NCEP/NCAR Reanalysis visualizations, trying to quantify how dry August 2024 was. Yet, as seen from the GIF below, the August 1-23 period had relative humidity values at most levels that are at worse near average (1991-2020 climo), and at best significantly below average. Only 300mb is a notable exception, but that's very high up. Additionally, at 500-700mb, there's a notable wet plume centered at 20N, just above the deep tropics.

(All GIFs in this comment, either embedded or linked, cycle across the following levels: 925mb, 850mb, 700mb, 600mb, 500mb, 400mb, 300mb.)

Image

You may argue that the first half of August was more favorable, and/or skewed by Debby and Ernesto. In that case, I also produced a GIF for the one-week period of August 17-23, which shows largely similar conclusions. If anything, the wet anomalies in Eastern Atlantic and Africa have only gotten more extreme during the second half of August, not less.

Image.

I also produced the same GIFs for 2022, 2017 and 2010 (August 1-23, for an apple-to-apple comparison). Except 700-850mb, August 2022 definitely looks anomalously dry across the tropical Atlantic, more so than 2024. If I really had to pick one, I'd even say 2017 resembles 2024's patterns to date much more than 2022; in fact, 2017 looks drier at 850-925mb. (This is not necessarily saying this season will resemble 2017 in overall activity.)

So my honest question is: Why does everyone seem to agree that the Atlantic is currently apocalyptically dry (from an activity perspective, not impact), when the data above doesn't seem to suggest that? Is there something terribly wrong with my methodology and analysis? Or is it that the Atlantic has mostly been following climo in terms of humidity -- in which case, is something else causing the inactivity?

After all, the following happened on September 5, 2018, when Florence became a Cat 4 just north of a huge plume of mid-level dry air that seems similar to 2 days ago:
Image

And here's August 25, 2019, when newly formed Tropical Storm Dorian was struggling with dry air that had reached all the way across the Caribbean, about as extensively as today:
Image

Again, if there's something wrong or naive with my comment, please please do point them out to me. I'm a bit of a data nerd, but I don't have nearly as much domain expertise in tropical cyclones as many of you do (even as an enthusiast), and there are many things I'm still learning.
5 likes   

User avatar
Hammy
Category 5
Category 5
Posts: 5849
Age: 41
Joined: Fri May 25, 2012 5:25 pm
Contact:

Re: 2024 Indicators: SST's, MSLP, Shear, SAL, Steering, Instability (Day 16+ Climate Models)

#2145 Postby Hammy » Sun Aug 25, 2024 3:41 pm

Seems like today's a day of change with the models, 12z CFS (on Pivotal's western-basin map, worth noting this only goes through September 25 and is still likely an under-estimate) only has two clear-cut storms and only a couple of disturbances beyond that--vs six in most recent runs--while having quite an active East Pacific. It's just one run but if we keep seeing this over the next consecutive runs, then something has gone very wrong with this season and the models are only starting to see whatever these signs are.

I'm still expecting a backloaded season but the writing is on the wall that, at least in the next week or so, we're in for little to nothing.

Teban54 wrote:So my honest question is: Why does everyone seem to agree that the Atlantic is currently apocalyptically dry (from an activity perspective, not impact), when the data above doesn't seem to suggest that? Is there something terribly wrong with my methodology and analysis? Or is it that the Atlantic has mostly been following climo in terms of humidity -- in which case, is something else causing the inactivity?


This is one of the points people are trying to make that I haven't really understood--the subtropics are usually very dry by their nature, that's literally where most of the world's deserts are at. Unless you have a well organized system there, or a strong front (during colder months) you don't often see large amounts of moisture there. And even absent development, the models still show significant wet precipitable water anomalies across most of the basin.

Image
1 likes   
The above post is not official and should not be used as such. It is the opinion of the poster and may or may not be backed by sound meteorological data. It is not endorsed by any professional institution or storm2k.org. For official information, please refer to the NHC and NWS products.

MarioProtVI
Category 4
Category 4
Posts: 932
Age: 23
Joined: Sun Sep 29, 2019 7:33 pm
Location: New Jersey

Re: 2024 Indicators: SST's, MSLP, Shear, SAL, Steering, Instability (Day 16+ Climate Models)

#2146 Postby MarioProtVI » Sun Aug 25, 2024 4:18 pm

Hammy wrote:Seems like today's a day of change with the models, 12z CFS (on Pivotal's western-basin map, worth noting this only goes through September 25 and is still likely an under-estimate) only has two clear-cut storms and only a couple of disturbances beyond that--vs six in most recent runs--while having quite an active East Pacific. It's just one run but if we keep seeing this over the next consecutive runs, then something has gone very wrong with this season and the models are only starting to see whatever these signs are.

I'm still expecting a backloaded season but the writing is on the wall that, at least in the next week or so, we're in for little to nothing.

Teban54 wrote:So my honest question is: Why does everyone seem to agree that the Atlantic is currently apocalyptically dry (from an activity perspective, not impact), when the data above doesn't seem to suggest that? Is there something terribly wrong with my methodology and analysis? Or is it that the Atlantic has mostly been following climo in terms of humidity -- in which case, is something else causing the inactivity?


This is one of the points people are trying to make that I haven't really understood--the subtropics are usually very dry by their nature, that's literally where most of the world's deserts are at. Unless you have a well organized system there, or a strong front (during colder months) you don't often see large amounts of moisture there. And even absent development, the models still show significant wet precipitable water anomalies across most of the basin.

https://i.imgur.com/w8UWn3s.png


I counted at least 3-4 and for the disturbances I would add 2 just to account for its underestimating due to the very low res (some “disturbances” can still be strong TSs or C1s on the CFS). That’s why I’m not too worried.
1 likes   

LarryWx
Category 5
Category 5
Posts: 6246
Joined: Sun Sep 07, 2003 2:04 pm
Location: GA

Re: 2024 Indicators: SST's, MSLP, Shear, SAL, Steering, Instability (Day 16+ Climate Models)

#2147 Postby LarryWx » Sun Aug 25, 2024 4:29 pm

Teban54 wrote:
LarryWx wrote:Is it possible that the fact that the equatorial Atlantic has cooled at record pace from a Nino to Niña is the main reason for the current MDR quiet?

“After over a year of record-high global sea temperatures, the equatorial Atlantic is cooling off more quickly than ever recorded, which could impact weather around the world. Over the past three months, the shift from hot to cool temperatures in the equatorial Atlantic Ocean has happened at record speed.

Then further down is a graph. Focus on the far right, where 2024 equat. Atlantic is shown with a rapid cooling of anomalies from ~+1.15C in Mar to ~-0.5C in July or an anom. cooling of ~1.65C in just 4 months, the fastest cooling since at least 1982.

Article with graph: https://archive.ph/2024.08.20-103704/ht ... knows-why/

Could this in combination with the current record warm subtropical E Atlantic (see link below) be the main reason for the E MDR being so stable? Keep in mind that the main reason hurricanes exist is to transport “excess warmth” from the tropics northward. With the equator cooling so rapidly while the middle latitudes of the N Atlantic are at record warmth, is there currently the normal level of “excess warmth” in the tropics? Assuming not, does the normal forcing that leads to ATL hurricanes in the MDR E of the Car currently exist?

Link showing extreme warm anomalies 30N to 40+N (E of 60W)?
https://kouya.has.arizona.edu/tropics/l ... mo-max.png

While I think its a really interesting point, what immediately raised my skepticism is the bolded part, for a single reason: People said the exact same thing in 2023.

Last year's entire Atlantic was also anomalously warm, not just the tropics. I distinctly remember one tweet in August (quite possibly late August just before Franklin and Idalia became majors). It was essentially saying... "Hurricanes exist to transfer energy from the tropics into the subtropics, but with the Atlantic so warm, do they have a reason to exist?"

Obviously, that didn't age well as 2023 was above-average by every metric.


1) I’m thinking about the current MDR’s stability. In 2023 Franklin and Idalia didn’t become Hs until moving N of the MDR. Also, the MDR struggled in 2023 overall with only 2Hs out of the 13 MDR NS meaning it had a lot of NS but with relative weaklings dominating. The 1st MDR H wasn’t until Sep 6th (Lee). The next one wasn’t til Oct 20th!

So, despite 2023 also having a near record warm MDR, it was unimpressive as regards Hs in the MDR. So, how can it be known that the 2023 MDR potential wasn’t hurt by the high latitude warmth?

https://www.nhc.noaa.gov/data/tracks/tracks-at-2023.png

2) What about the record fast cooling (back to 1982) to an Atlantic Niña as an additional possible MDR stabilizing factor to consider for 2024?
1 likes   
Personal Forecast Disclaimer:
The posts in this forum are NOT official forecasts and should not be used as such. They are just the opinion of the poster and may or may not be backed by sound meteorological data. They are NOT endorsed by any professional institution or storm2k.org. For official information, please refer to the NHC and NWS products.

User avatar
Teban54
Category 5
Category 5
Posts: 3168
Joined: Sat May 19, 2018 1:19 pm

Re: 2024 Indicators: SST's, MSLP, Shear, SAL, Steering, Instability (Day 16+ Climate Models)

#2148 Postby Teban54 » Sun Aug 25, 2024 4:37 pm

LarryWx wrote:1) I’m thinking about the current MDR’s stability. In 2023 Franklin and Idalia didn’t become Hs until moving N of the MDR. Also, the MDR struggled in 2023 overall with only 2Hs out of the 13 MDR NS meaning it had a lot of NS but with relative weaklings dominating. The 1st MDR H wasn’t until Sep 6th (Lee). The next one wasn’t til Oct 20th!

So, despite 2023 also having a near record warm MDR and mid latitude SSTs, it was unimpressive as regards Hs in the MDR. So, how can it be known that the 2023 MDR potential wasn’t hurt by the high latitude warmth?

https://www.nhc.noaa.gov/data/tracks/tracks-at-2023.png

While this isn't exactly the MDR, I happened to be looking at some air temperature data just moments before -- and these are the 200mb and 1000mb air temperature anomalies during August 20-30, in which Franklin and Idalia became Cat 4s, in addition to numerous storm formations elsewhere:

(Both charts remained the general pattern for the 8/20 - 9/30 period.)

Image

Image

Despite extremely warm upper air in the NW Atlantic east of the Bahamas, Franklin bombed out there anyway. The eastern Gulf, where Idalia RI'ed, also seems to have slightly higher upper air temperature anomalies than the surface (albeit much less extreme than NW Atlantic).

So my current impression is... I don't think that's a necessary factor.
1 likes   

User avatar
Hammy
Category 5
Category 5
Posts: 5849
Age: 41
Joined: Fri May 25, 2012 5:25 pm
Contact:

Re: 2024 Indicators: SST's, MSLP, Shear, SAL, Steering, Instability (Day 16+ Climate Models)

#2149 Postby Hammy » Sun Aug 25, 2024 4:40 pm

Teban54 wrote:
LarryWx wrote:1) I’m thinking about the current MDR’s stability. In 2023 Franklin and Idalia didn’t become Hs until moving N of the MDR. Also, the MDR struggled in 2023 overall with only 2Hs out of the 13 MDR NS meaning it had a lot of NS but with relative weaklings dominating. The 1st MDR H wasn’t until Sep 6th (Lee). The next one wasn’t til Oct 20th!

So, despite 2023 also having a near record warm MDR and mid latitude SSTs, it was unimpressive as regards Hs in the MDR. So, how can it be known that the 2023 MDR potential wasn’t hurt by the high latitude warmth?

https://www.nhc.noaa.gov/data/tracks/tracks-at-2023.png

While this isn't exactly the MDR, I happened to be looking at some air temperature data just moments before -- and these are the 200mb and 1000mb air temperature anomalies during August 20-30, in which Franklin and Idalia became Cat 4s, in addition to numerous storm formations elsewhere:

(Both charts remained the general pattern for the 8/20 - 9/30 period.)

https://i.postimg.cc/zXf6t3nc/image.png

https://i.postimg.cc/jSw9T936/image.png

Despite extremely warm upper air in the NW Atlantic east of the Bahamas, Franklin bombed out there anyway. The eastern Gulf, where Idalia RI'ed, also seems to have slightly higher upper air temperature anomalies than the surface (albeit much less extreme than NW Atlantic).

So my current impression is... I don't think that's a necessary factor.


Putting all this together seems like the most prominent issue seems like a combination of, most of the waves (particularly the low pressure cores) are simply exiting Africa too far north and being sent over cooler water, and being too much interaction with the (heavily amplified) monsoon--the lower-latitude wave that's out there now, most of the models have it actually getting sucked back into the westerly flow. Why this is happening is anybody's guess and I'm pretty sure everybody would have their own explanation, but this seems like the most clear cut issue at the moment.
6 likes   
The above post is not official and should not be used as such. It is the opinion of the poster and may or may not be backed by sound meteorological data. It is not endorsed by any professional institution or storm2k.org. For official information, please refer to the NHC and NWS products.

User avatar
aspen
Category 5
Category 5
Posts: 8812
Joined: Sat Oct 12, 2019 7:10 pm
Location: Connecticut, USA

Re: 2024 Indicators: SST's, MSLP, Shear, SAL, Steering, Instability (Day 16+ Climate Models)

#2150 Postby aspen » Sun Aug 25, 2024 4:45 pm

I just realized: since the current lull and AEJ issues mean we’re not hitting 20+ NS this year, the last two La Niña hurricane seasons (2022 and 2024) will have been beaten out in NS by an El Nino year (2023), which is wild to see.
0 likes   
Irene '11 Sandy '12 Hermine '16 5/15/2018 Derecho Fay '20 Isaias '20 Elsa '21 Henri '21 Ida '21

I am only a meteorology enthusiast who knows a decent amount about tropical cyclones. Look to the professional mets, the NHC, or your local weather office for the best information.

User avatar
Category5Kaiju
Category 5
Category 5
Posts: 4051
Joined: Thu Dec 24, 2020 12:45 pm
Location: Seattle

Re: 2024 Indicators: SST's, MSLP, Shear, SAL, Steering, Instability (Day 16+ Climate Models)

#2151 Postby Category5Kaiju » Sun Aug 25, 2024 4:46 pm

Hammy wrote:
Teban54 wrote:
LarryWx wrote:1) I’m thinking about the current MDR’s stability. In 2023 Franklin and Idalia didn’t become Hs until moving N of the MDR. Also, the MDR struggled in 2023 overall with only 2Hs out of the 13 MDR NS meaning it had a lot of NS but with relative weaklings dominating. The 1st MDR H wasn’t until Sep 6th (Lee). The next one wasn’t til Oct 20th!

So, despite 2023 also having a near record warm MDR and mid latitude SSTs, it was unimpressive as regards Hs in the MDR. So, how can it be known that the 2023 MDR potential wasn’t hurt by the high latitude warmth?

https://www.nhc.noaa.gov/data/tracks/tracks-at-2023.png

While this isn't exactly the MDR, I happened to be looking at some air temperature data just moments before -- and these are the 200mb and 1000mb air temperature anomalies during August 20-30, in which Franklin and Idalia became Cat 4s, in addition to numerous storm formations elsewhere:

(Both charts remained the general pattern for the 8/20 - 9/30 period.)

https://i.postimg.cc/zXf6t3nc/image.png

https://i.postimg.cc/jSw9T936/image.png

Despite extremely warm upper air in the NW Atlantic east of the Bahamas, Franklin bombed out there anyway. The eastern Gulf, where Idalia RI'ed, also seems to have slightly higher upper air temperature anomalies than the surface (albeit much less extreme than NW Atlantic).

So my current impression is... I don't think that's a necessary factor.


Putting all this together seems like the most prominent issue seems like a combination of, most of the waves (particularly the low pressure cores) are simply exiting Africa too far north and being sent over cooler water, and being too much interaction with the (heavily amplified) monsoon--the lower-latitude wave that's out there now, most of the models have it actually getting sucked back into the westerly flow. Why this is happening is anybody's guess and I'm pretty sure everybody would have their own explanation, but this seems like the most clear cut issue at the moment.


Honestly, I think this is probably the best explanation so far. Even though I've seen "wavebreaking" being thrown around a bit on social media, the maps shared by other Storm2k members earlier seem to suggest that mid-level humidity isn't an issue like it was in 2022. It also doesn't explain why we were able to get two August storms (if wavebreaking really was at play here, then I doubt we would've even gotten those). I just don't think we're getting the necessary seedlings for deep tropical formation at the moment. And considering this year isn't really producing shorties and systems in the subtropics, it just makes everything *seem* more inactive and unfavorable when in reality the current dearth of activity may be simply because the waves that could spawn storms are too high in latitude.
1 likes   
Unless explicitly stated, all info in my posts is based on my own opinions and observations. Tropical storms and hurricanes can be extremely dangerous. Do not think you can beat Mother Nature. Refer to an accredited weather research agency or meteorologist if you need to make serious decisions regarding an approaching storm.

User avatar
cycloneye
Admin
Admin
Posts: 143867
Age: 68
Joined: Thu Oct 10, 2002 10:54 am
Location: San Juan, Puerto Rico

Re: 2024 Indicators: SST's, MSLP, Shear, SAL, Steering, Instability (Day 16+ Climate Models)

#2152 Postby cycloneye » Sun Aug 25, 2024 4:51 pm

I always look closely at his posts as he is very knowleagble on these topics.

 https://x.com/TylerJStanfield/status/1827821131493216334


2 likes   
Visit the Caribbean-Central America Weather Thread where you can find at first post web cams,radars
and observations from Caribbean basin members Click Here

User avatar
weeniepatrol
Category 5
Category 5
Posts: 1252
Joined: Sat Aug 22, 2020 5:30 pm
Location: WA State

Re: 2024 Indicators: SST's, MSLP, Shear, SAL, Steering, Instability (Day 16+ Climate Models)

#2153 Postby weeniepatrol » Sun Aug 25, 2024 5:04 pm

Probably worth diddly squat, but the easterly vertical shear south of Cabo Verde has relaxed from 50 kt to 20 kt. Easterly shear out east in general has decreased significantly.

Image
4 likes   

MarioProtVI
Category 4
Category 4
Posts: 932
Age: 23
Joined: Sun Sep 29, 2019 7:33 pm
Location: New Jersey

Re: 2024 Indicators: SST's, MSLP, Shear, SAL, Steering, Instability (Day 16+ Climate Models)

#2154 Postby MarioProtVI » Sun Aug 25, 2024 5:28 pm

weeniepatrol wrote:Probably worth diddly squat, but the easterly vertical shear south of Cabo Verde has relaxed from 50 kt to 20 kt. Easterly shear out east in general has decreased significantly.

https://i.imgur.com/wWMwJil.png

IIRC, part of the issue is/was a very strong AEJ. If shear’s decreasing significantly near there, probably a sign it is weakening.
0 likes   

LarryWx
Category 5
Category 5
Posts: 6246
Joined: Sun Sep 07, 2003 2:04 pm
Location: GA

Re: 2024 Indicators: SST's, MSLP, Shear, SAL, Steering, Instability (Day 16+ Climate Models)

#2155 Postby LarryWx » Sun Aug 25, 2024 5:58 pm

Teban54 wrote:
LarryWx wrote:1) I’m thinking about the current MDR’s stability. In 2023 Franklin and Idalia didn’t become Hs until moving N of the MDR. Also, the MDR struggled in 2023 overall with only 2Hs out of the 13 MDR NS meaning it had a lot of NS but with relative weaklings dominating. The 1st MDR H wasn’t until Sep 6th (Lee). The next one wasn’t til Oct 20th!

So, despite 2023 also having a near record warm MDR and mid latitude SSTs, it was unimpressive as regards Hs in the MDR. So, how can it be known that the 2023 MDR potential wasn’t hurt by the high latitude warmth?

https://www.nhc.noaa.gov/data/tracks/tracks-at-2023.png

While this isn't exactly the MDR, I happened to be looking at some air temperature data just moments before -- and these are the 200mb and 1000mb air temperature anomalies during August 20-30, in which Franklin and Idalia became Cat 4s, in addition to numerous storm formations elsewhere:

(Both charts remained the general pattern for the 8/20 - 9/30 period.)

https://i.postimg.cc/zXf6t3nc/image.png

https://i.postimg.cc/jSw9T936/image.png

Despite extremely warm upper air in the NW Atlantic east of the Bahamas, Franklin bombed out there anyway. The eastern Gulf, where Idalia RI'ed, also seems to have slightly higher upper air temperature anomalies than the surface (albeit much less extreme than NW Atlantic).

So my current impression is... I don't think that's a necessary factor.


1. Thanks, Teban, for your reply about 2023. I’m really enjoying the discussion. It seems to me that the jury for the main cause(s) is still out on this difficult puzzle to solve based on the myriad of possible explanations and disagreement even among pro mets.

2. What about the record fast drop to an Atlantic La Niña as a possible contributing factor keeping the MDR quiet for now?
0 likes   
Personal Forecast Disclaimer:
The posts in this forum are NOT official forecasts and should not be used as such. They are just the opinion of the poster and may or may not be backed by sound meteorological data. They are NOT endorsed by any professional institution or storm2k.org. For official information, please refer to the NHC and NWS products.

User avatar
weeniepatrol
Category 5
Category 5
Posts: 1252
Joined: Sat Aug 22, 2020 5:30 pm
Location: WA State

Re: 2024 Indicators: SST's, MSLP, Shear, SAL, Steering, Instability (Day 16+ Climate Models)

#2156 Postby weeniepatrol » Sun Aug 25, 2024 6:48 pm

Gonna pull my hair out.

Image

No Nina
0 likes   

User avatar
weeniepatrol
Category 5
Category 5
Posts: 1252
Joined: Sat Aug 22, 2020 5:30 pm
Location: WA State

Re: 2024 Indicators: SST's, MSLP, Shear, SAL, Steering, Instability (Day 16+ Climate Models)

#2157 Postby weeniepatrol » Sun Aug 25, 2024 6:51 pm

weeniepatrol wrote:Gonna pull my hair out.

https://i.imgur.com/bfld6mz.png

No Nina


Now, to be fair, Jun to July did have the look.

Image

But the Equator has warmed significantly in August.
3 likes   

User avatar
Woofde
Category 1
Category 1
Posts: 475
Joined: Tue Jul 06, 2021 11:33 am

Re: 2024 Indicators: SST's, MSLP, Shear, SAL, Steering, Instability (Day 16+ Climate Models)

#2158 Postby Woofde » Sun Aug 25, 2024 7:06 pm

LarryWx wrote:
Teban54 wrote:
LarryWx wrote:1) I’m thinking about the current MDR’s stability. In 2023 Franklin and Idalia didn’t become Hs until moving N of the MDR. Also, the MDR struggled in 2023 overall with only 2Hs out of the 13 MDR NS meaning it had a lot of NS but with relative weaklings dominating. The 1st MDR H wasn’t until Sep 6th (Lee). The next one wasn’t til Oct 20th!

So, despite 2023 also having a near record warm MDR and mid latitude SSTs, it was unimpressive as regards Hs in the MDR. So, how can it be known that the 2023 MDR potential wasn’t hurt by the high latitude warmth?

https://www.nhc.noaa.gov/data/tracks/tracks-at-2023.png

While this isn't exactly the MDR, I happened to be looking at some air temperature data just moments before -- and these are the 200mb and 1000mb air temperature anomalies during August 20-30, in which Franklin and Idalia became Cat 4s, in addition to numerous storm formations elsewhere:

(Both charts remained the general pattern for the 8/20 - 9/30 period.)

https://i.postimg.cc/zXf6t3nc/image.png

https://i.postimg.cc/jSw9T936/image.png

Despite extremely warm upper air in the NW Atlantic east of the Bahamas, Franklin bombed out there anyway. The eastern Gulf, where Idalia RI'ed, also seems to have slightly higher upper air temperature anomalies than the surface (albeit much less extreme than NW Atlantic).

So my current impression is... I don't think that's a necessary factor.


1. Thanks, Teban, for your reply about 2023. I’m really enjoying the discussion. It seems to me that the jury for the main cause(s) is still out on this difficult puzzle to solve based on the myriad of possible explanations and disagreement even among pro mets.

2. What about the record fast drop to an Atlantic La Niña as a possible contributing factor keeping the MDR quiet for now?
Theres just very little consolidation anywhere. Its visible on the general satellite view and also on vorticity maps. Until the shenanigans over Africa stop the seasons at a pause. The basin itself is plenty favorable right now, low shear, dry air has started coming down, plenty of heat, but without some healthy seeds from Africa nothing is going to get going.
2 likes   

User avatar
WaveBreaking
Category 2
Category 2
Posts: 562
Joined: Sun Jun 30, 2024 11:33 am
Location: US

Re: 2024 Indicators: SST's, MSLP, Shear, SAL, Steering, Instability (Day 16+ Climate Models)

#2159 Postby WaveBreaking » Sun Aug 25, 2024 7:13 pm

weeniepatrol wrote:
weeniepatrol wrote:Gonna pull my hair out.

https://i.imgur.com/bfld6mz.png

No Nina


Now, to be fair, Jun to July did have the look.

https://i.imgur.com/5SJzqrm.png

But the Equator has warmed significantly in August.


This could mean that there is a bit of lag when it comes to Atlantic "ENSO" phase changes and their effects on the ITCZ's position. If we go by this, then the ITCZ should start to get yanked further south about the same time frame it took for the Atlantic Niña to push the ITCZ north (not sure how long this took tho).
0 likes   
I am NOT a professional meteorologist, so take all of my posts with a grain of salt. My opinions are mine and mine alone.

User avatar
Teban54
Category 5
Category 5
Posts: 3168
Joined: Sat May 19, 2018 1:19 pm

Re: 2024 Indicators: SST's, MSLP, Shear, SAL, Steering, Instability (Day 16+ Climate Models)

#2160 Postby Teban54 » Sun Aug 25, 2024 7:28 pm


I was certainly intrigued by Richard Dixon's plot here, but it only used June and July (during which we had Cat 5 Beryl). So I went ahead and plotted August and September by myself (after a few hours of dealing with atmospheric data in Python for the first time):

(The August chart for 2024 uses all available data, up to August 23 I believe. The September chart doesn't have 2024.)

Image

Image

Impressions:
  • 2024 is anomalous in terms of a warm tropopause. Specifically, in all 3 months of the hurricane season, the upper levels are anomalously warmer than air at the sea level, much more so than any other year in the dataset (that starts in 1979).
  • However, several years with a comparably large delta did feature significant activity. In the +AMO era, the years trailing 2024 in August deltas are: 2020, 1995, 1998, 1996, 2015. Four of the five had hyperactive ACE, and several of them had significant MDR activity in August, particularly 1995 and 1996. Even 2015 was notable for being more active than expected for a Super Nino year (and it produced an MDR major in August).
  • Additionally, 2010 had a warm tropopause in September (2nd highest delta in the +AMO era) and a near-average one in August. Yet, that year had more MDR activity in September than August (though that's also in line with climo).
  • Despite the talks of August 2022 having a stable atmosphere, that year was actually slightly below 0 in anomaly delta. Thus, even though some have argued that 2024's current SSTA configuration resembles 2022 (particularly warm anomalies north of 40W or so), I suspect the underlying effects of the SSTAs for 2024 vs. 2022 are very different, as are the actual inhibiting factors.
Ultimately, I feel this may be a similar story as the strong AEJ-induced shear: Even though 2024 is highly anomalous in that regard, it's not clear if that's actually a detrimental factor for seasonal activity.

I was thinking of analyzing the correlation between the tropopause deltas and ACE (either seasonal or within MDR). It will take some more work that I'm not familiar with, but do let me know if you're interested. I can also generate these charts for other regions if there's demand.
7 likes   


Return to “Talkin' Tropics”

Who is online

Users browsing this forum: Google Adsense [Bot] and 212 guests