
Still pretty dry pattern except the waves do a little better convection wise in the ITCZ.
Waves can't close off there without gaining latitude so that might raise the chance of a low latitude runner in August.
2022 Indicators (SSTs/SAL/MSLP/Shear/Steering/Instability) and >Day 16 Models
Moderator: S2k Moderators
Forum rules

The posts in this forum are NOT official forecasts and should not be used as such. They are just the opinion of the poster and may or may not be backed by sound meteorological data. They are NOT endorsed by any professional institution or STORM2K. For official information, please refer to products from the National Hurricane Center and National Weather Service.
-
skyline385

- Category 5

- Posts: 2728
- Age: 35
- Joined: Wed Aug 26, 2020 11:15 pm
- Location: Houston TX
Re: 2022 Indicators (SSTs/SAL/MSLP/Shear/Steering/Instability) and >Day 16 Models
ElectricStorm wrote:
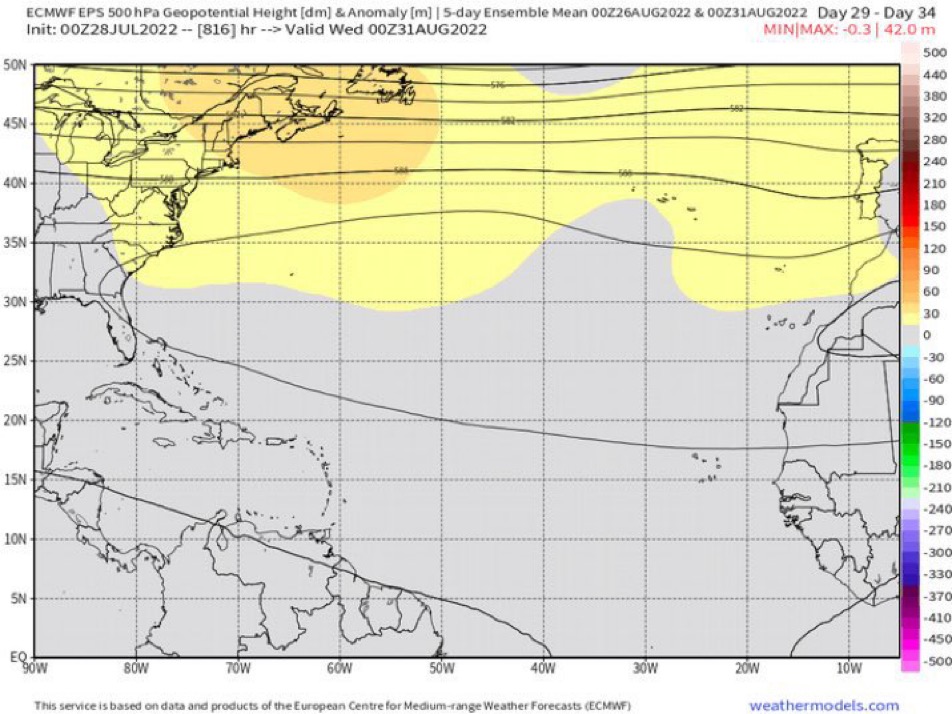
816 hours out
Also, for whatever reason, the EPS 500Z Anomaly breaks at the end of each weekly run. Solutions like these happen at the end for all its runs

1 likes
-
Category5Kaiju

- Category 5
- Posts: 4331
- Joined: Thu Dec 24, 2020 12:45 pm
- Location: Seattle and Phoenix
Re: 2022 Indicators (SSTs/SAL/MSLP/Shear/Steering/Instability) and >Day 16 Models
So I have been looking at some past historical information and S2K season indicator threads recently, and one relatively loose but interesting pattern I have seen is how historically speaking, the Atlantic sometimes has a scary tendency to generate very nasty, powerful storms suddenly after a prolonged period of quiet. Several examples of this include 1980 and 1992, when the first named storms of the seasons, Allen and Andrew, did not occur until late July and late August respectively. We all know how those turned out. 2004 also featured something similar, where there was basically nothing until Cat 3 Alex and devastating Cat 4 Charley occurred in early August. Even years like 1999, 2007, and 2019 to an extent had this "nasty surprise element," with storms like Bret, Dean, and Dorian all happening after a notable period of relatively little or no NS activity in the basin. Judging by the 2019 indicators thread in particular, many trackers, even experienced ones, seemed legitimately surprised at how the basin was dead silent and unfavorable, only to spawn a 185-mph leviathan within the span of merely a week or so.
It remains to be seen what activity will look like next month, but if certain historical seasons are to be looked at, then this long period of quiet that we are seeing (even to the point that no NSs have formed since the July 4 timeframe) is, in a way, potentially and arguably not a welcome long-term sign. I guess one could see it as the basin receiving an opportunity to slowly "charge up," or warm up both in ssts as well as uohc; with the absence of NSs or flurries of such disturbing the waters, all of this "latent fuel" per se builds and builds. The next thing you know, when the basin encounters a period of favorable upper level conditions aloft, you are greeted with a powerful major hurricane bearing down on land.
Now like I said, every season is different, and this pattern of the basin producing a powerhouse system that ends a long period of nothingness isn't seen in every busy hurricane season. However, it definitely caught my attention to see how a handful of recent historic seasons at least exhibited this kind of behavior, and with the off the charts uohc in the W. Atlantic and the warming MDR, it certainly is something to be mindful about imho. Will 2022 behave like some of the years I have mentioned in being dead quiet and then all of a sudden sending a major hurricane toward land in mid to late August in the form of Danielle or Earl? That remains to be seen. It could happen, or it could not. But the former possibility definitely catches my attention, at least
4 likes
Unless explicitly stated, all info in my posts is based on my own opinions and observations. Tropical storms and hurricanes can be extremely dangerous. Refer to an accredited weather research agency or meteorologist if you need to make serious decisions regarding an approaching storm.
-
jconsor
- Professional-Met

- Posts: 580
- Joined: Mon Jun 30, 2008 9:31 pm
- Location: Jerusalem, Israel
- Contact:
Re: 2022 Indicators (SSTs/SAL/MSLP/Shear/Steering/Instability) and >Day 16 Models
Thread on SST evolution and analogs:
https://twitter.com/yconsor/status/1552971227211436032
https://twitter.com/yconsor/status/1552973797980082177
https://twitter.com/yconsor/status/1552979764398415872
https://twitter.com/yconsor/status/1552981009066508290
https://twitter.com/yconsor/status/1552983323273838596
https://twitter.com/yconsor/status/1552984269722615811
2 likes
-
Deshaunrob17
- Tropical Storm

- Posts: 211
- Joined: Tue Aug 18, 2020 7:49 am
Re: 2022 Indicators (SSTs/SAL/MSLP/Shear/Steering/Instability) and >Day 16 Models
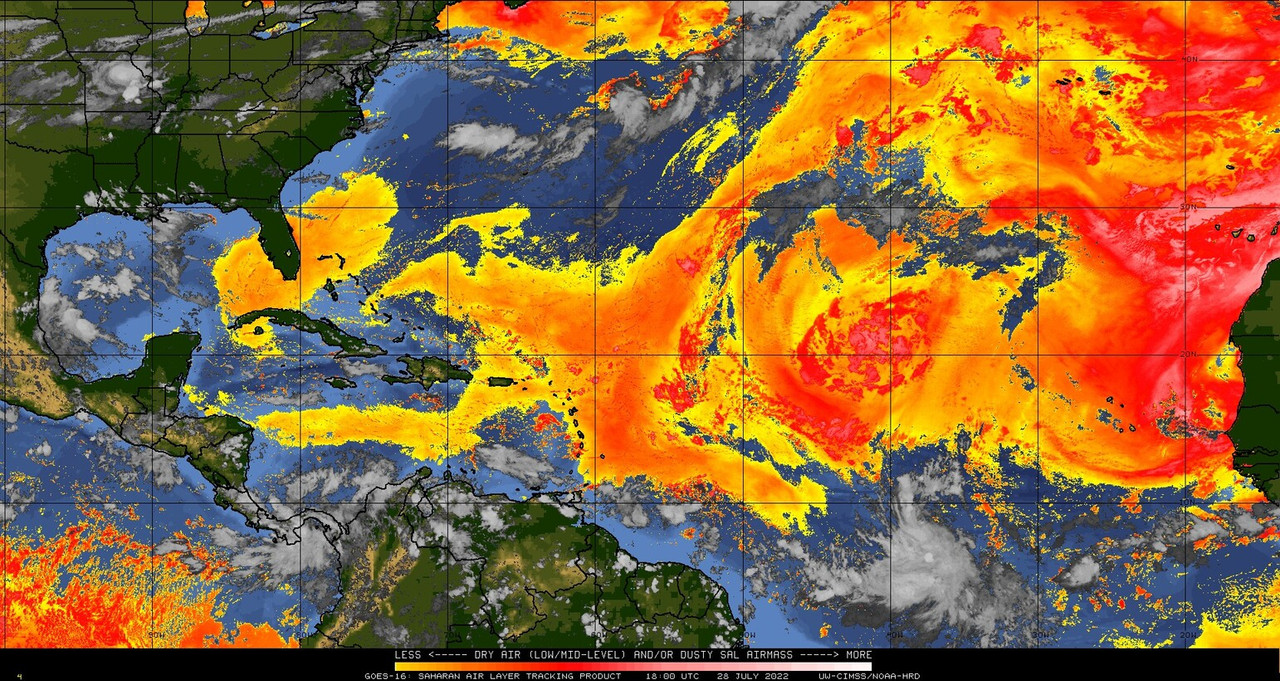
gatorcane wrote:It doesn’t take a sophisticated model to know why the global models are not showing any development anytime soon. That is quite a SAL surge.Looks like nowhere in Florida has more than a 10% rain chance today which is unusual. But it is likely not going to look like that come one month from now so enjoy the quiet time while it lasts

https://i.postimg.cc/SK7g4QFs/g16split.jpg
The NW Caribbean and Florida usually have drier than normal conditions during la nina years. So this is no surprise
0 likes


Re: 2022 Indicators (SSTs/SAL/MSLP/Shear/Steering/Instability) and >Day 16 Models
Average windshear across the Caribbean so far this month of July has been the highest among La Nina years during the past 27 years, while conditions were fairly favorable across the EPAC.
This is definitely why it has been slower so far than 2021 & 2020.
But noticed how unfavorable it was also in 2017 before things changed in late August, but conditions were more favorable east of the Lesser Antilles that year.
2016 was also similar, so was 2000.

This is definitely why it has been slower so far than 2021 & 2020.
But noticed how unfavorable it was also in 2017 before things changed in late August, but conditions were more favorable east of the Lesser Antilles that year.
2016 was also similar, so was 2000.
3 likes
-
Deshaunrob17
- Tropical Storm
- Posts: 211
- Joined: Tue Aug 18, 2020 7:49 am
Re: 2022 Indicators (SSTs/SAL/MSLP/Shear/Steering/Instability) and >Day 16 Models
Teban54 wrote:zzh wrote:I thought SST means nothing to some people
The point is that warmer MDR SSTAs are usually correlated with active seasons, but the lack of MDR warmth doesn't preclude one. Many years that met the hyperactive ACE threshold did not have crazy MDR SSTs, and likewise many years with warm SSTs underperformed.
MDR SSTA is a factor, but just one piece of the puzzle and not the sole factor for hyping or cancelling a season. Other factors, even those that deal with SSTs directly like the overall SSTA configuration and the tropopause, also matter.
In 2020 and 2021, when we had warmer SSTAs, people were using the subtropical warm pool to cancel the seasons. This year, when the subtropics is cool, people now cherrypick on MDR SSTs. Hmm.
This is why I feel we need to be specific and more vivid with describing hurricane seasons. Some people will flat out say Sub tropical warm pool will cancel the season but it's better say that it may cause some instability issues which may cause storms to struggle about in the MDR.
0 likes
-
tolakram
- Admin

- Posts: 20179
- Age: 62
- Joined: Sun Aug 27, 2006 8:23 pm
- Location: Florence, KY (name is Mark)
Re: 2022 Indicators (SSTs/SAL/MSLP/Shear/Steering/Instability) and >Day 16 Models
NDG wrote:Average windshear across the Caribbean so far this month of July has been the highest among La Nina years during the past 27 years, while conditions were fairly favorable across the EPAC.
This is definitely why it has been slower so far than 2021 & 2020.
But noticed how unfavorable it was also in 2017 before things changed in late August, but conditions were more favorable east of the Lesser Antilles that year.
2016 was also similar, so was 2000.
https://i.imgur.com/A5ZhB7l.gif
No static ULL's. If you look at the 200 frame water vapor you can see features moving creating periods of unfavorability.
https://weather.cod.edu/satrad/?parms=global-halfdiskeastnorth-08-200-0-100-1&checked=map&colorbar=undefined
1 likes
M a r k
- - - - -
Join us in chat: Storm2K Chatroom Invite. Android and IOS apps also available.
The posts in this forum are NOT official forecasts and should not be used as such. Posts are NOT endorsed by any professional institution or STORM2K.org. For official information and forecasts, please refer to NHC and NWS products.
-
skyline385
- Category 5
- Posts: 2728
- Age: 35
- Joined: Wed Aug 26, 2020 11:15 pm
- Location: Houston TX
Re: 2022 Indicators (SSTs/SAL/MSLP/Shear/Steering/Instability) and >Day 16 Models
Probably the most aggressive weekly we have seen this season, nothing much going on in August but lights up for September

5 likes
-
Category5Kaiju
- Category 5
- Posts: 4331
- Joined: Thu Dec 24, 2020 12:45 pm
- Location: Seattle and Phoenix
Re: 2022 Indicators (SSTs/SAL/MSLP/Shear/Steering/Instability) and >Day 16 Models
https://twitter.com/AndyHazelton/status/1553024997429583872
Hmm, so this is interesting. It looks like there are some thoughts that what we're seeing now in terms of inactivity is not because of the SAL per se but mid-level dry air. In fact, it seems like SAL is not as much of a detriment as mid-level dry air is. Now, interestingly, Andy points out that the last season that featured a legitimate problem with mid-level dry air intrusions was..yup, 2013.
However, I personally have to wonder how truly big of an issue this would be in the peak season, considering there are vast differences from where we are now than where we were in 2013 (genuine La Nina, active EPAC and dead WPAC being some examples of major differences between 2013 and now, the La Nina being the main factor imho that would favor activity on the Atlantic end eventually)
0 likes
Unless explicitly stated, all info in my posts is based on my own opinions and observations. Tropical storms and hurricanes can be extremely dangerous. Refer to an accredited weather research agency or meteorologist if you need to make serious decisions regarding an approaching storm.

Re: 2022 Indicators (SSTs/SAL/MSLP/Shear/Steering/Instability) and >Day 16 Models
skyline385 wrote:Probably the most aggressive weekly we have seen this season, nothing much going on in August but lights up for September
https://uploads.tapatalk-cdn.com/20220729/0a5d2e0e136c5ef81c524f59da64b6ef.jpg
Is there a key index that describes or defines the color rating for each system? Trying to learn this. Thanks.
0 likes
Personal Forecast Disclaimer:
The posts in this forum are NOT official forecast and should not be used as such. They are just the opinion of the poster and may or may not be backed by sound meteorological data. They are NOT endorsed by any professional institution or storm2k.org. For official information, please refer to the NHC and NWS products.
The posts in this forum are NOT official forecast and should not be used as such. They are just the opinion of the poster and may or may not be backed by sound meteorological data. They are NOT endorsed by any professional institution or storm2k.org. For official information, please refer to the NHC and NWS products.
Re: 2022 Indicators (SSTs/SAL/MSLP/Shear/Steering/Instability) and >Day 16 Models
tolakram wrote:NDG wrote:Average windshear across the Caribbean so far this month of July has been the highest among La Nina years during the past 27 years, while conditions were fairly favorable across the EPAC.
This is definitely why it has been slower so far than 2021 & 2020.
But noticed how unfavorable it was also in 2017 before things changed in late August, but conditions were more favorable east of the Lesser Antilles that year.
2016 was also similar, so was 2000.
https://i.imgur.com/A5ZhB7l.gif
No static ULL's. If you look at the 200 frame water vapor you can see features moving creating periods of unfavorability.
https://weather.cod.edu/satrad/?parms=global-halfdiskeastnorth-08-200-0-100-1&checked=map&colorbar=undefined
No static ULLs but continuing track of ULLs north of the Caribbean has definitely made the Caribbean & GOM unfavorable for development during the last 3 weeks.
Last 20 days WV loop:

0 likes
-
skyline385
- Category 5
- Posts: 2728
- Age: 35
- Joined: Wed Aug 26, 2020 11:15 pm
- Location: Houston TX
Re: 2022 Indicators (SSTs/SAL/MSLP/Shear/Steering/Instability) and >Day 16 Models
SoupBone wrote:skyline385 wrote:Probably the most aggressive weekly we have seen this season, nothing much going on in August but lights up for September
https://uploads.tapatalk-cdn.com/20220729/0a5d2e0e136c5ef81c524f59da64b6ef.jpg
Is there a key index that describes or defines the color rating for each system? Trying to learn this. Thanks.
It’s on the top right corner, it’s a measure of the intensity although i would not focus too much on it but instead just the activity based on number of members.
2 likes
-
hurricane2025
- Category 1

- Posts: 254
- Joined: Thu Apr 08, 2021 10:36 am
Re: 2022 Indicators (SSTs/SAL/MSLP/Shear/Steering/Instability) and >Day 16 Models
July usually is quiet & so 1-2 weeks of august
Climatology tells us: june - early august can have too much dry air, shear & not a active monsoon season
Just comes down to basic tropical meteorology,
Same issue every seasons
But 2005…. 2020 you can have a little more activity (hyper active years) 2020 they also named everything first couple months…
But typically every late July early August dry air/ dust, shear is a main issue
0 likes
Re: 2022 Indicators (SSTs/SAL/MSLP/Shear/Steering/Instability) and >Day 16 Models
Category5Kaiju wrote:https://twitter.com/AndyHazelton/status/1553024997429583872?cxt=HHwWgIC9sbiAuo0rAAAA
Hmm, so this is interesting. It looks like there are some thoughts that what we're seeing now in terms of inactivity is not because of the SAL per se but mid-level dry air. In fact, it seems like SAL is not as much of a detriment as mid-level dry air is. Now, interestingly, Andy points out that the last season that featured a legitimate problem with mid-level dry air intrusions was..yup, 2013.
However, I personally have to wonder how truly big of an issue this would be in the peak season, considering there are vast differences from where we are now than where we were in 2013 (genuine La Nina, active EPAC and dead WPAC being some examples of major differences between 2013 and now, the La Nina being the main factor imho that would favor activity on the Atlantic end eventually)
Definitely lots of mid level dry air coming down from mid latitudes into the MDR.
https://twitter.com/NDGMETCHEF/status/1553051016299438081
0 likes
-
skyline385
- Category 5
- Posts: 2728
- Age: 35
- Joined: Wed Aug 26, 2020 11:15 pm
- Location: Houston TX
2022 Indicators (SSTs/SAL/MSLP/Shear/Steering/Instability) and >Day 16 Models
NDG wrote:Category5Kaiju wrote:https://twitter.com/AndyHazelton/status/1553024997429583872?cxt=HHwWgIC9sbiAuo0rAAAA
Hmm, so this is interesting. It looks like there are some thoughts that what we're seeing now in terms of inactivity is not because of the SAL per se but mid-level dry air. In fact, it seems like SAL is not as much of a detriment as mid-level dry air is. Now, interestingly, Andy points out that the last season that featured a legitimate problem with mid-level dry air intrusions was..yup, 2013.
However, I personally have to wonder how truly big of an issue this would be in the peak season, considering there are vast differences from where we are now than where we were in 2013 (genuine La Nina, active EPAC and dead WPAC being some examples of major differences between 2013 and now, the La Nina being the main factor imho that would favor activity on the Atlantic end eventually)
Definitely lots of mid level dry air coming down from mid latitudes into the MDR.
https://twitter.com/NDGMETCHEF/status/1553051016299438081
Yea this has been ongoing for a couple of weeks now. I posted a run from the NASA dust model (comparing to the GFS humidity plots) some pages back to show how most of the dry air is not from SAL.
2 likes
-
skyline385
- Category 5
- Posts: 2728
- Age: 35
- Joined: Wed Aug 26, 2020 11:15 pm
- Location: Houston TX
Re: 2022 Indicators (SSTs/SAL/MSLP/Shear/Steering/Instability) and >Day 16 Models
The 53rd is getting bored from lack of activity 
https://twitter.com/53rdwrs/status/1553022196888502274
https://twitter.com/53rdwrs/status/1553022196888502274
0 likes
-
cycloneye

- Admin
- Posts: 149286
- Age: 69
- Joined: Thu Oct 10, 2002 10:54 am
- Location: San Juan, Puerto Rico
Re: 2022 Indicators (SSTs/SAL/MSLP/Shear/Steering/Instability) and >Day 16 Models
Analog years for this include 1999, 2000 and 2009.
https://twitter.com/philklotzbach/status/1553073944164323329
https://twitter.com/philklotzbach/status/1553073944164323329
0 likes
Visit the Caribbean-Central America Weather Thread where you can find at first post web cams,radars
and observations from Caribbean basin members Click Here
and observations from Caribbean basin members Click Here
-
MHC Tracking
- Tropical Storm
- Posts: 203
- Joined: Mon Mar 15, 2021 10:05 am
Re: 2022 Indicators (SSTs/SAL/MSLP/Shear/Steering/Instability) and >Day 16 Models
Long-range GFS 500mb setup is a fairly close match with the significant East Coast landfall composite.


0 likes


Re: 2022 Indicators (SSTs/SAL/MSLP/Shear/Steering/Instability) and >Day 16 Models
Just an observation but 2000 seems to be popping up on list after list. I bet if you were gather all the tweets, experts, posts, etc 2000 is the most pinged. Curious if that analog works out, fits the background state and 3rd year -ENSO.
3 likes
The above post and any post by Ntxw is NOT an official forecast and should not be used as such. It is just the opinion of the poster and may or may not be backed by sound meteorological data. It is NOT endorsed by any professional institution including Storm2k. For official information, please refer to NWS products.
Help support Storm2K!
Who is online
Users browsing this forum: gib, weeniepatrol and 114 guests