2022 Indicators (SSTs/SAL/MSLP/Shear/Steering/Instability) and >Day 16 Models

This is the general tropical discussion area. Anyone can take their shot at predicting a storms path.

Moderator: S2k Moderators

Forum rules

The posts in this forum are NOT official forecasts and should not be used as such. They are just the opinion of the poster and may or may not be backed by sound meteorological data. They are NOT endorsed by any professional institution or STORM2K. For official information, please refer to products from the National Hurricane Center and National Weather Service.

Help Support Storm2K
Message
Author
MHC Tracking
Tropical Storm
Tropical Storm
Posts: 195
Joined: Mon Mar 15, 2021 10:05 am

Re: 2022 Indicators (SSTs/SAL/MSLP/Shear/Steering/Instability) and >Day 16 Models

#2321 Postby MHC Tracking » Sun Jul 31, 2022 11:31 am

skyline385 wrote:
SFLcane wrote:I honestly don’t expect much reduction in Phil K’s numbers on Tuesday the sst profile is still rather similar to his last outlook and though not perfect has the look of an active season.

https://i.postimg.cc/1Xhrj5b5/82135422-5042-4-BF1-8-B7-E-910-EFADBC5-A8.png

https://i.postimg.cc/cCRByGN7/0612-F1-B1-7-FC8-40-DA-9381-68-BD4-AB53-DAF.png


That plot was Phil's correlation with SSTs at the beginning of July, the August correlation is slightly different. Phil also uses a 14-day SSTa average in his forecasts so here's a composite comparing August correlation to 14-day SSTa, its not all ideal (also usual disclaimer that SSTs aren't everything).
Also, wxman lowered his numbers by 3/1/1 and said its likely Phil will lower his numbers as well.

https://i.imgur.com/NHbNeJY.png

Not sure why you'd drop a major, one wasn't expected by now anyway. Plus, the outlook for peak season hasn't really changed much since the last update - personally would keep that MH and drop by 3 NS and 1 HU
2 likes   

User avatar
skyline385
Category 5
Category 5
Posts: 2728
Age: 35
Joined: Wed Aug 26, 2020 11:15 pm
Location: Houston TX

Re: 2022 Indicators (SSTs/SAL/MSLP/Shear/Steering/Instability) and >Day 16 Models

#2322 Postby skyline385 » Sun Jul 31, 2022 11:49 am

MHC Tracking wrote:
skyline385 wrote:
SFLcane wrote:I honestly don’t expect much reduction in Phil K’s numbers on Tuesday the sst profile is still rather similar to his last outlook and though not perfect has the look of an active season.

https://i.postimg.cc/1Xhrj5b5/82135422-5042-4-BF1-8-B7-E-910-EFADBC5-A8.png

https://i.postimg.cc/cCRByGN7/0612-F1-B1-7-FC8-40-DA-9381-68-BD4-AB53-DAF.png


That plot was Phil's correlation with SSTs at the beginning of July, the August correlation is slightly different. Phil also uses a 14-day SSTa average in his forecasts so here's a composite comparing August correlation to 14-day SSTa, its not all ideal (also usual disclaimer that SSTs aren't everything).
Also, wxman lowered his numbers by 3/1/1 and said its likely Phil will lower his numbers as well.

https://i.imgur.com/NHbNeJY.png

Not sure why you'd drop a major, one wasn't expected by now anyway. Plus, the outlook for peak season hasn't really changed much since the last update - personally would keep that MH and drop by 3 NS and 1 HU


Probably cause seasons like 2010 where you can churn out 5 majors after mid-August are an anomaly and not the norm. 2010 also had a ridiculously warm MDR and 4/5 majors (all Cat 4 systems) were CV storms.
Last edited by skyline385 on Sun Jul 31, 2022 11:55 am, edited 1 time in total.
2 likes   

User avatar
wxman57
Moderator-Pro Met
Moderator-Pro Met
Posts: 22980
Age: 67
Joined: Sat Jun 21, 2003 8:06 pm
Location: Houston, TX (southwest)

Re: 2022 Indicators (SSTs/SAL/MSLP/Shear/Steering/Instability) and >Day 16 Models

#2323 Postby wxman57 » Sun Jul 31, 2022 11:52 am

It takes more than warm water in the MDR to make a major hurricane. Waves are struggling in the MDR so far. Something isn't right.
3 likes   

User avatar
Category5Kaiju
Category 5
Category 5
Posts: 4103
Joined: Thu Dec 24, 2020 12:45 pm
Location: Seattle

Re: 2022 Indicators (SSTs/SAL/MSLP/Shear/Steering/Instability) and >Day 16 Models

#2324 Postby Category5Kaiju » Sun Jul 31, 2022 11:56 am

wxman57 wrote:It takes more than warm water in the MDR to make a major hurricane. Waves are struggling in the MDR so far. Something isn't right.


But don't waves normally struggle out there this early in the season (like, June/July early?) Also, if I recall correctly, the end of June had a decently convectively active MDR
4 likes   
Unless explicitly stated, all info in my posts is based on my own opinions and observations. Tropical storms and hurricanes can be extremely dangerous. Do not think you can beat Mother Nature. Refer to an accredited weather research agency or meteorologist if you need to make serious decisions regarding an approaching storm.

zzh
Category 1
Category 1
Posts: 375
Joined: Fri Aug 27, 2021 2:18 pm

Re: 2022 Indicators (SSTs/SAL/MSLP/Shear/Steering/Instability) and >Day 16 Models

#2325 Postby zzh » Sun Jul 31, 2022 12:05 pm

Image
Cold Canary Current + Atlantic Nina = well below average instability in eastern MDR + struggling waves.
1 likes   

User avatar
Emmett_Brown
Category 5
Category 5
Posts: 1432
Joined: Wed Aug 24, 2005 9:10 pm
Location: Sarasota FL

Re: 2022 Indicators (SSTs/SAL/MSLP/Shear/Steering/Instability) and >Day 16 Models

#2326 Postby Emmett_Brown » Sun Jul 31, 2022 12:10 pm

recency bias
3 likes   

User avatar
Category5Kaiju
Category 5
Category 5
Posts: 4103
Joined: Thu Dec 24, 2020 12:45 pm
Location: Seattle

Re: 2022 Indicators (SSTs/SAL/MSLP/Shear/Steering/Instability) and >Day 16 Models

#2327 Postby Category5Kaiju » Sun Jul 31, 2022 2:17 pm

Ok, so let's take a step back and ask ourselves what is happening right now.

Yes, there is talk of a bust for this season considering the models are not showing much for the next weeks or so, with this wave-breaking thing also being a big buzz on wx social media. But again, it's late July. If we were in September, then that's a different story. But we are not. How many times in the past have we seen the Atlantic spring to action within even merely days, especially in late August? The switch flip is very real, and it can be very sudden as well. Anyhow, I would also like to point out that speculations of a bust as of now are primarily contingent on models, and it also does not help that the Euro and GFS have two radically different ideas on what could happen going forward. Furthermore, as we have seen in recent years like 2017, 2019, and 2021, dry mid-level air like this at summer's end can really be a false alarm for a bust, considering how it typically ends going into August. As of now, there's nothing about this that strikes me as especially odd; in fact, the overall tracker sentiment and conditions seem a lot like 2019.

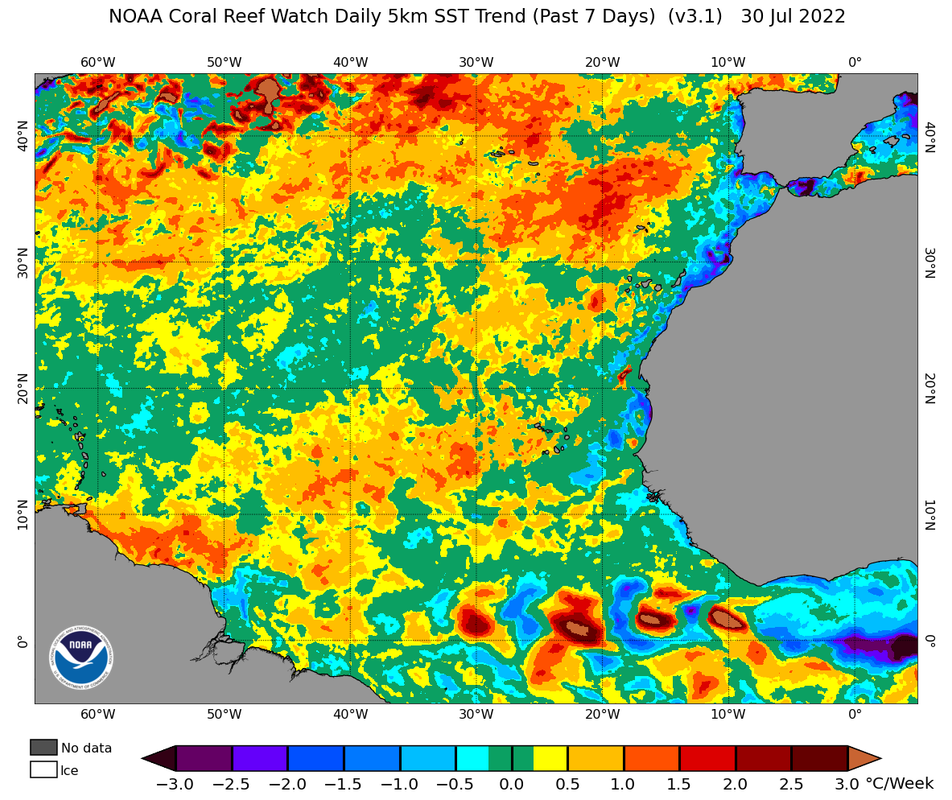
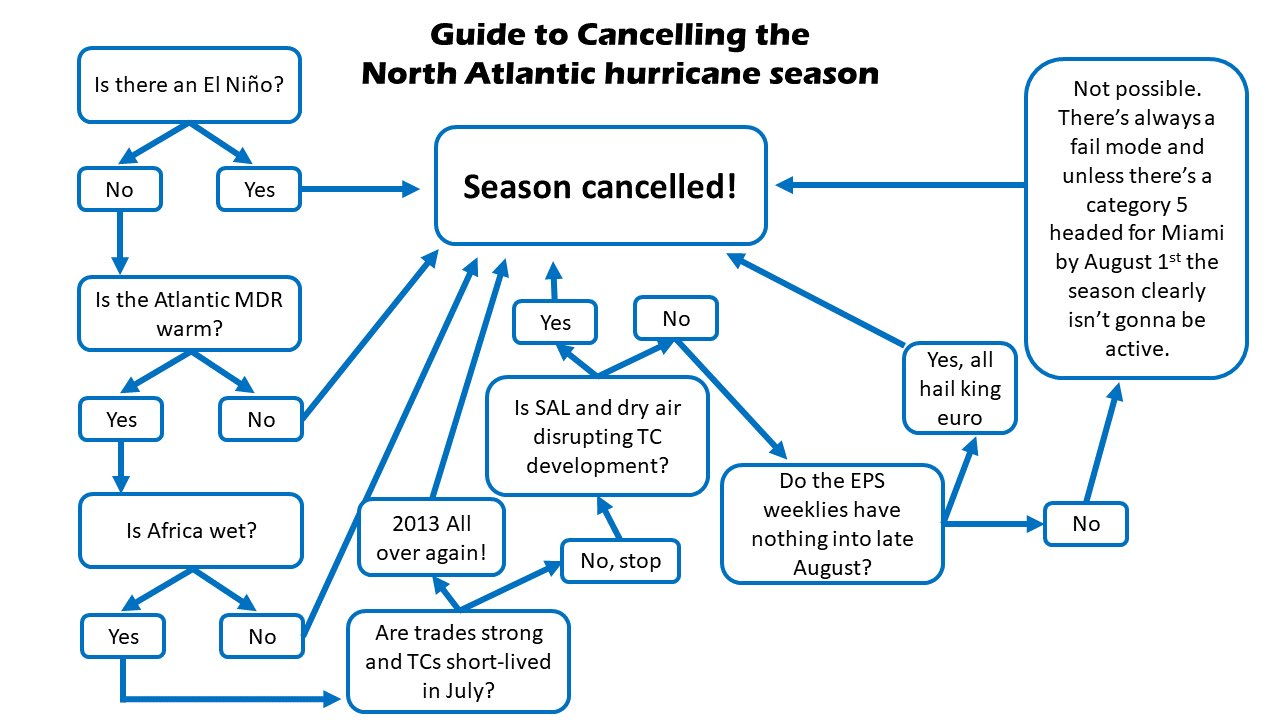
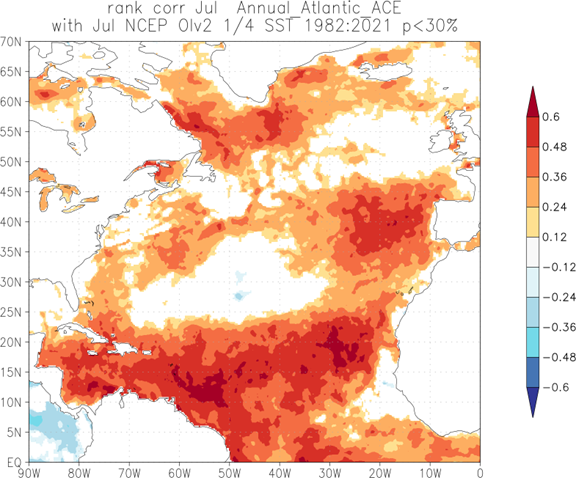
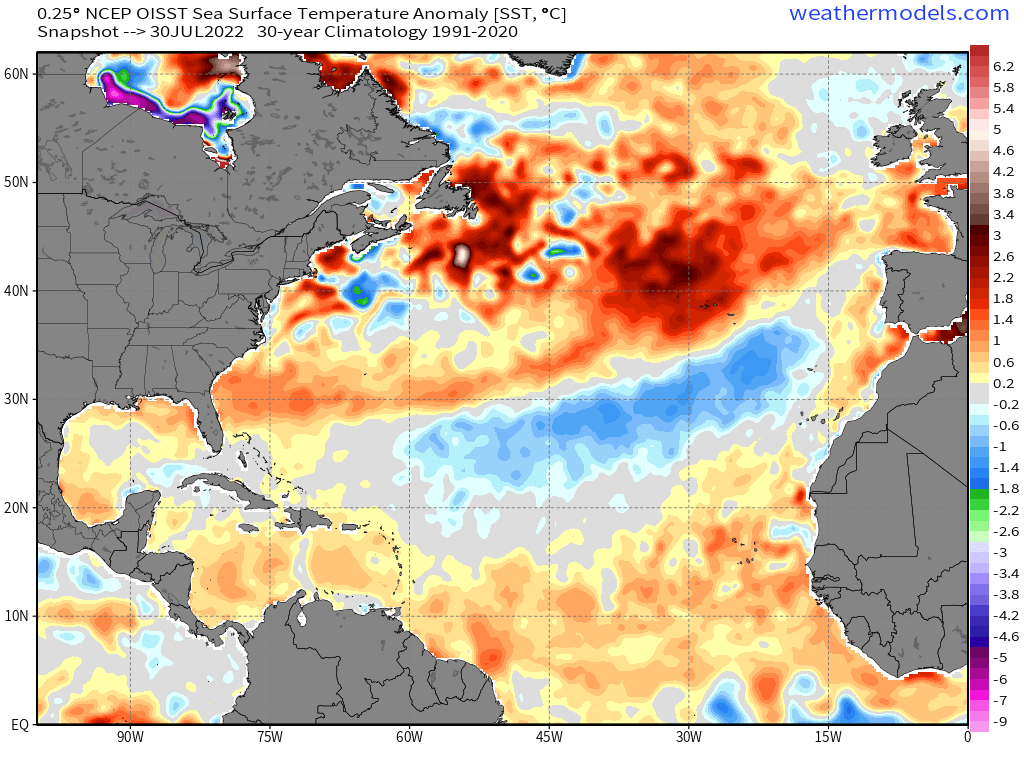
I'd now like to shift focus to the wave-breaking/mid-level dry air phenomenon that we are seeing now. It is true that this kind of event was prevalent in 2013, and in that sense, sure, I guess? 2022 is like 2013? Then again, 2013 was a totally different year compared to this year in many aspects, and considering things like us having a true La Nina in place, a warmer than subtropics MDR sst anomalies, a robust THC with above average ocean salinity, and a polar opposite WPAC/EPAC activity level pattern (EPAC does not seem to be having any issues with decent storms this early in the season, much unlike 2013), I still am not sure if comparing this season to one of the most extreme spectacles of the 21st century at this point in time is a sound argument to make. Let's face it, each season is different, and no two hurricane seasons are carbon copies of one another. It would be statistically mind-numbing to see 2022 pull off a 2013, considering how extreme that season was and how this year, we have warm MDR sst anomalies and a true La Nina in place, both of which are historically proven and known to be strong factors that favor an active Atlantic hurricane season. At least since 1995, every La Nina year that "underperformed" to a certain extent did so for tangible reasons; for example, 2007 featured a rather cool MDR and overall basin with a look that was very similar to a -AMO, while years such as 2000 and 2011 featured a warm but not impressively warm MDR. At least as of currently, the MDR has been warming very nicely, and there are regions of it that are close to or above +1 C. There's hardly anything that would suggest that this MDR warmth will plummet in the coming months, and the WAM should only help with it, or at least that's what I would assume.

My point here is, at this point in time, I am still not convinced that this dry air problem is going to be a seasonal detriment, especially how there are factors in place now (the La Nina and the warm MDR sst anomalies) that we did not see in 2013, and with these factors being historically (and strongly) correlated with decent Atlantic activity. In fact, I personally would be very curious to see how anomalously dry it is out there compared to some of our past seasons at this point in time, particularly years like 1998, 1999, and 2019 that were also snoozing as of now.

And if this season does underperform tremendously...then I think it would be safe to assume that future indicators are seriously going to need to undergo an overhaul, and wave-breaking/mid-level dry air intrusions may really need to be elevated in terms of how important their evaluations are for a season's potential. In fact, I would argue that given such strong signals otherwise, a 2022 bust would be even more confusing and head-scratching than 2013 itself.
6 likes   
Unless explicitly stated, all info in my posts is based on my own opinions and observations. Tropical storms and hurricanes can be extremely dangerous. Do not think you can beat Mother Nature. Refer to an accredited weather research agency or meteorologist if you need to make serious decisions regarding an approaching storm.

User avatar
FireRat
Category 5
Category 5
Posts: 1246
Age: 38
Joined: Sun Sep 26, 2010 11:38 pm
Location: North Carolina

Re: 2022 Indicators (SSTs/SAL/MSLP/Shear/Steering/Instability) and >Day 16 Models

#2328 Postby FireRat » Sun Jul 31, 2022 2:36 pm

Interesting points from you guys above, it does seem like something isn't right, yet, as wxman57 alluded, and Cat5 you have a good point too!

I think what we may have is a late bloomer of a season. Several of the analogs, like 1998, 1999, and even 2000 were late bloomers, with 2 of those seasons having very active Septembers, Octobers and 1 November. This season could very well be one that started off slowly even into August before things go wild between September and October and possibly be active even into November! Who knows, maybe the switch flips in September this year...
2 likes   
Georges '98, Irene '99, Frances '04, Jeanne '04, Katrina '05, Wilma '05, Gustav '08, Isaac '12, Matthew '16, Florence '18, Michael '18, Ian '22

User avatar
AnnularCane
S2K Supporter
S2K Supporter
Posts: 2864
Joined: Thu Jun 08, 2006 9:18 am
Location: Wytheville, VA

Re: 2022 Indicators (SSTs/SAL/MSLP/Shear/Steering/Instability) and >Day 16 Models

#2329 Postby AnnularCane » Sun Jul 31, 2022 2:43 pm

What exactly is "wave breaking" anyway?
0 likes   
"But it never rained rain. It never snowed snow. And it never blew just wind. It rained things like soup and juice. It snowed mashed potatoes and green peas. And sometimes the wind blew in storms of hamburgers." -- Judi Barrett, Cloudy with a Chance of Meatballs

User avatar
cycloneye
Admin
Admin
Posts: 145484
Age: 68
Joined: Thu Oct 10, 2002 10:54 am
Location: San Juan, Puerto Rico

Re: 2022 Indicators (SSTs/SAL/MSLP/Shear/Steering/Instability) and >Day 16 Models

#2330 Postby cycloneye » Sun Jul 31, 2022 2:51 pm

AnnularCane wrote:What exactly is "wave breaking" anyway?


Is very long this document about Rossby wave breaking.

An excerpt:
RWB events are identified in the upper troposphere but affect the flow at all tropospheric levels and play an important role in the meridional transport of both tropical and subtropical air masses [Homeyer and Bowman, 2013]. At the surface, AWB drives a positive sea level pressure (SLP) anomaly to the South of the breaking and a negative anomaly to the North, while the converse holds for CWB [Strong and Magnusdottir, 2008a]. A midlatitude AWB (CWB) is therefore associated with an enhanced (reduced) SLP dipole over the Atlantic and a more northerly (southerly) jet than usual [Riviere and Orlanski, 2007]. Strong and Magnusdottir [2008a] found the relationship between RWB and the NAO to be strongly dependent on the meridional location of RWB, with AWB (CWB) centered around 50°N associated with the positive (negative) phase of the NAO, in agreement with previous studies [e.g., Benedict et al., 2004]. RWB events shifted 20° to the north or south were found to drive the opposite NAO polarity.


https://agupubs.onlinelibrary.wiley.com ... 15JD023854
3 likes   
Visit the Caribbean-Central America Weather Thread where you can find at first post web cams,radars
and observations from Caribbean basin members Click Here

User avatar
cycloneye
Admin
Admin
Posts: 145484
Age: 68
Joined: Thu Oct 10, 2002 10:54 am
Location: San Juan, Puerto Rico

Re: 2022 Indicators (SSTs/SAL/MSLP/Shear/Steering/Instability) and >Day 16 Models

#2331 Postby cycloneye » Sun Jul 31, 2022 3:00 pm

I have a new theory about why the North Atlantic is very quiet and the models are not showing anything forming thru mid August. I go with the intense heat in Europe that sends dry air to the SW into the Atlantic. What do the members think about this?

 https://twitter.com/extremetemps/status/1553809567317999616


0 likes   
Visit the Caribbean-Central America Weather Thread where you can find at first post web cams,radars
and observations from Caribbean basin members Click Here

User avatar
SFLcane
S2K Supporter
S2K Supporter
Posts: 10163
Age: 47
Joined: Sat Jun 05, 2010 1:44 pm
Location: Lake Worth Florida

Re: 2022 Indicators (SSTs/SAL/MSLP/Shear/Steering/Instability) and >Day 16 Models

#2332 Postby SFLcane » Sun Jul 31, 2022 3:01 pm

skyline385 wrote:
SFLcane wrote:I honestly don’t expect much reduction in Phil K’s numbers on Tuesday the sst profile is still rather similar to his last outlook and though not perfect has the look of an active season.

https://i.postimg.cc/1Xhrj5b5/82135422-5042-4-BF1-8-B7-E-910-EFADBC5-A8.png

https://i.postimg.cc/cCRByGN7/0612-F1-B1-7-FC8-40-DA-9381-68-BD4-AB53-DAF.png


That plot was Phil's correlation with SSTs at the beginning of July, the August correlation is slightly different. Phil also uses a 14-day SSTa average in his forecasts so here's a composite comparing August correlation to 14-day SSTa, its not all ideal (also usual disclaimer that SSTs aren't everything).
Also, wxman lowered his numbers by 3/1/1 and said its likely Phil will lower his numbers as well.

https://i.imgur.com/NHbNeJY.png


Lower numbers sure but to what 18/8/4 I heard ace near 160-170 that’s still a huge season. The Mdr is warming and should continue i see no reason to drastically lower them.
The first hurricane does not typically form till second week of August. The season is behaving just like it should in my opinion. July to me is just another extension of June still unfavorable. It will be fun to look back at all this as usual when there’s 2 hurricanes in the Atlantic August 27th.

Image
0 likes   

User avatar
SFLcane
S2K Supporter
S2K Supporter
Posts: 10163
Age: 47
Joined: Sat Jun 05, 2010 1:44 pm
Location: Lake Worth Florida

Re: 2022 Indicators (SSTs/SAL/MSLP/Shear/Steering/Instability) and >Day 16 Models

#2333 Postby SFLcane » Sun Jul 31, 2022 3:08 pm

They should pin this during hurricane season.

Image
10 likes   

LarryWx
S2K Supporter
S2K Supporter
Posts: 6326
Joined: Sun Sep 07, 2003 2:04 pm
Location: GA

Re: 2022 Indicators (SSTs/SAL/MSLP/Shear/Steering/Instability) and >Day 16 Models

#2334 Postby LarryWx » Sun Jul 31, 2022 3:12 pm

 Based on my memory, the quietness often (though not always of course) suddenly ends before models have a good handle. I remember a number of times when after a long quiet period a storm pops up with no or at most 2-3 days of a signal even on the ensembles and then sometimes followed soon by a series of storms.

 Even this year, I recall Colin having hardly any model support. But I'm talking even much stronger and larger storms than Colin being practically totally missed along with more soon after. I'm not predicting this will happen, but I wouldn't at all be surprised if that's what occurs when we switch from quiet to active based on history whenever that is.
4 likes   
Personal Forecast Disclaimer:
The posts in this forum are NOT official forecasts and should not be used as such. They are just the opinion of the poster and may or may not be backed by sound meteorological data. They are NOT endorsed by any professional institution or storm2k.org. For official information, please refer to the NHC and NWS products.

LarryWx
S2K Supporter
S2K Supporter
Posts: 6326
Joined: Sun Sep 07, 2003 2:04 pm
Location: GA

Re: 2022 Indicators (SSTs/SAL/MSLP/Shear/Steering/Instability) and >Day 16 Models

#2335 Postby LarryWx » Sun Jul 31, 2022 3:19 pm

Category5Kaiju wrote:
wxman57 wrote:It takes more than warm water in the MDR to make a major hurricane. Waves are struggling in the MDR so far. Something isn't right.


But don't waves normally struggle out there this early in the season (like, June/July early?) Also, if I recall correctly, the end of June had a decently convectively active MDR


I agree with both of your points. Regarding your 2nd point, indeed, Bonnie came from a very strong MDR wave and, as a matter of fact, was one of the strongest June MDR waves ever. Related to this and other waves then, many were in awe of how active the E MDR looked so early, saying the typical "if it is this active now, then look out later", etc... Just like we've had a drastic change to drier in the MDR since Bonnie/late June, things will change again as we get closer to the meat of the season, even based on 3rd year La Niña/cold neutral analogs. There's no way it will stay anywhere near this quiet.
3 likes   
Personal Forecast Disclaimer:
The posts in this forum are NOT official forecasts and should not be used as such. They are just the opinion of the poster and may or may not be backed by sound meteorological data. They are NOT endorsed by any professional institution or storm2k.org. For official information, please refer to the NHC and NWS products.

User avatar
skyline385
Category 5
Category 5
Posts: 2728
Age: 35
Joined: Wed Aug 26, 2020 11:15 pm
Location: Houston TX

Re: 2022 Indicators (SSTs/SAL/MSLP/Shear/Steering/Instability) and >Day 16 Models

#2336 Postby skyline385 » Sun Jul 31, 2022 3:24 pm

SFLcane wrote:
skyline385 wrote:
SFLcane wrote:I honestly don’t expect much reduction in Phil K’s numbers on Tuesday the sst profile is still rather similar to his last outlook and though not perfect has the look of an active season.

https://i.postimg.cc/1Xhrj5b5/82135422-5042-4-BF1-8-B7-E-910-EFADBC5-A8.png

https://i.postimg.cc/cCRByGN7/0612-F1-B1-7-FC8-40-DA-9381-68-BD4-AB53-DAF.png


That plot was Phil's correlation with SSTs at the beginning of July, the August correlation is slightly different. Phil also uses a 14-day SSTa average in his forecasts so here's a composite comparing August correlation to 14-day SSTa, its not all ideal (also usual disclaimer that SSTs aren't everything).
Also, wxman lowered his numbers by 3/1/1 and said its likely Phil will lower his numbers as well.

https://i.imgur.com/NHbNeJY.png


Lower numbers sure but to what 18/8/4 I heard ace near 160-170 that’s still a huge season. The Mdr is warming and should continue i see no reason to drastically lower them.
The first hurricane does not typically form till second week of August. The season is behaving just like it should in my opinion. July to me is just another extension of June still unfavorable. It will be fun to look back at all this as usual when there’s 2 hurricanes in the Atlantic August 27th.

https://i.postimg.cc/pTMvg584/50-A543-D0-C477-4-D17-AEF7-4-FCA1-F17-EB84.png


But no one is denying that lol. The average storm count in the S2K poll was 20/10/5. The average ACE in the recent poll which ended yesterday is 154. This suggest that a majority of the folks here are expecting an above-average to hyperactive season so everyone is on the same page here :D

And even though I sound bearish at times, I went with 22/13/5 at the beginning of the season (which I now feel was overly bullish) and went with 150-175 ACE in the recent poll as I now expect an ACE of 140-160.
1 likes   

LarryWx
S2K Supporter
S2K Supporter
Posts: 6326
Joined: Sun Sep 07, 2003 2:04 pm
Location: GA

Re: 2022 Indicators (SSTs/SAL/MSLP/Shear/Steering/Instability) and >Day 16 Models

#2337 Postby LarryWx » Sun Jul 31, 2022 3:35 pm

cycloneye wrote:I have a new theory about why the North Atlantic is very quiet and the models are not showing anything forming thru mid August. I go with the intense heat in Europe that sends dry air to the SW into the Atlantic. What do the members think about this?

https://twitter.com/extremetemps/status/1553809567317999616


Luis,
Interesting theory. One would need to look at when in the past there was intense, widespread, and long enough lasting August Europe heat events and see how the Atlantic was then and soon after to try to get a better feel for whether or not there could be something to this theory. But there'd also need to be enough examples of past intense heat to give us a big enough sample to analyze this idea. I mean only one or two would be too small. I'd want to see something like 7-10 to allow for some statistical significance.
0 likes   
Personal Forecast Disclaimer:
The posts in this forum are NOT official forecasts and should not be used as such. They are just the opinion of the poster and may or may not be backed by sound meteorological data. They are NOT endorsed by any professional institution or storm2k.org. For official information, please refer to the NHC and NWS products.

User avatar
Category5Kaiju
Category 5
Category 5
Posts: 4103
Joined: Thu Dec 24, 2020 12:45 pm
Location: Seattle

Re: 2022 Indicators (SSTs/SAL/MSLP/Shear/Steering/Instability) and >Day 16 Models

#2338 Postby Category5Kaiju » Sun Jul 31, 2022 3:38 pm

SFLcane, that is not specific enough :roll: . I have modified it to make it more reflective of the newly found discovery of "wave-breaking," a term that even I have never heard of or thought was possible or a thing until like 2 days ago :D

Image
5 likes   
Unless explicitly stated, all info in my posts is based on my own opinions and observations. Tropical storms and hurricanes can be extremely dangerous. Do not think you can beat Mother Nature. Refer to an accredited weather research agency or meteorologist if you need to make serious decisions regarding an approaching storm.

User avatar
skyline385
Category 5
Category 5
Posts: 2728
Age: 35
Joined: Wed Aug 26, 2020 11:15 pm
Location: Houston TX

Re: 2022 Indicators (SSTs/SAL/MSLP/Shear/Steering/Instability) and >Day 16 Models

#2339 Postby skyline385 » Sun Jul 31, 2022 3:38 pm

LarryWx wrote:
cycloneye wrote:I have a new theory about why the North Atlantic is very quiet and the models are not showing anything forming thru mid August. I go with the intense heat in Europe that sends dry air to the SW into the Atlantic. What do the members think about this?

https://twitter.com/extremetemps/status/1553809567317999616


Luis,
Interesting theory. One would need to look at when in the past there was intense, widespread, and long enough lasting August Europe heat events and see how the Atlantic was then and soon after to try to get a better feel for whether or not there could be something to this theory. But there'd also need to be enough examples of past intense heat to give us a big enough sample to analyze this idea. I mean only one or two would be too small. I'd want to see something like 7-10 to allow for some statistical significance.


Not sure if you remember but I also brought up the possibility of a correlation between the Europe heatwave and Atlantic activity a few weeks back and the historical years you mentioned for previous heatwaves would suggest that it could be potentially associated with above average activity.

LarryWx wrote:
skyline385 wrote:Anyone here knows if there is any correlation between the extreme heat wave in the Europe this year and tropical activity? UK in particular is just completely wrecking records and I would be interested in seeing if there is any connection to it.


This is, indeed, absolutely insane heat! The all time W. Europe records now being broken or at least threatened were last set on these dates:

7/21/2021, 7/25/2019, 6/25/2019, 7/13/2017, 8/7/2015, 7/5/2015, 8/10/2012, 7/16/2005, 9/8/2003, 8/12/2003, 8/2/1990

So, one could look at 2021, 2019, 2017, 2015, 2012, 2005, 2003, and 1990 to see if there's a pattern.

Together with this heatwave, the Mediterranean, Bay of Biscay, and English Channel, among other waters, are significantly warmer than normal. Also, note that 5 of the last 8 summers have had record heat. So, obviously AGW is playing a significant part in all of this (several degrees in all likelihood).
4 likes   

User avatar
AnnularCane
S2K Supporter
S2K Supporter
Posts: 2864
Joined: Thu Jun 08, 2006 9:18 am
Location: Wytheville, VA

Re: 2022 Indicators (SSTs/SAL/MSLP/Shear/Steering/Instability) and >Day 16 Models

#2340 Postby AnnularCane » Sun Jul 31, 2022 3:39 pm

cycloneye wrote:
AnnularCane wrote:What exactly is "wave breaking" anyway?


Is very long this document about Rossby wave breaking.

An excerpt:
RWB events are identified in the upper troposphere but affect the flow at all tropospheric levels and play an important role in the meridional transport of both tropical and subtropical air masses [Homeyer and Bowman, 2013]. At the surface, AWB drives a positive sea level pressure (SLP) anomaly to the South of the breaking and a negative anomaly to the North, while the converse holds for CWB [Strong and Magnusdottir, 2008a]. A midlatitude AWB (CWB) is therefore associated with an enhanced (reduced) SLP dipole over the Atlantic and a more northerly (southerly) jet than usual [Riviere and Orlanski, 2007]. Strong and Magnusdottir [2008a] found the relationship between RWB and the NAO to be strongly dependent on the meridional location of RWB, with AWB (CWB) centered around 50°N associated with the positive (negative) phase of the NAO, in agreement with previous studies [e.g., Benedict et al., 2004]. RWB events shifted 20° to the north or south were found to drive the opposite NAO polarity.


https://agupubs.onlinelibrary.wiley.com ... 15JD023854


Thanks...but I probably should have told you to explain it like I'm five years old. :lol:
0 likes   
"But it never rained rain. It never snowed snow. And it never blew just wind. It rained things like soup and juice. It snowed mashed potatoes and green peas. And sometimes the wind blew in storms of hamburgers." -- Judi Barrett, Cloudy with a Chance of Meatballs


Return to “Talkin' Tropics”

Who is online

Users browsing this forum: Blown Away, Bobbyh83, ed, psyclone, Sciencerocks and 49 guests