2024 Indicators: SST's, MSLP, Shear, SAL, Steering, Instability (Day 16+ Climate Models)

This is the general tropical discussion area. Anyone can take their shot at predicting a storms path.

Moderator: S2k Moderators

Forum rules

The posts in this forum are NOT official forecasts and should not be used as such. They are just the opinion of the poster and may or may not be backed by sound meteorological data. They are NOT endorsed by any professional institution or STORM2K. For official information, please refer to products from the National Hurricane Center and National Weather Service.

Help Support Storm2K
Message
Author
User avatar
aspen
Category 5
Category 5
Posts: 8812
Joined: Sat Oct 12, 2019 7:10 pm
Location: Connecticut, USA

Re: 2024 Indicators: SST's, MSLP, Shear, SAL, Steering, Instability (Day 16+ Climate Models)

#2461 Postby aspen » Fri Sep 13, 2024 6:09 am

al78 wrote:Given the very quiet Pacific, little activity on the horizon for the Atlantic over the next few days apart from TD7 which will likely generate minimal amounts of ACE, and the Atlantic basin has now dropped below the 1991-2020 climatology to-date, I'm thinking this year could be close to a record low for tropical cyclone activity across the northern hemisphere this year assuming we only include the satellite era.

I’m guessing that would suggest whatever’s holding the Atlantic back is a global-scale issue, which would support the speculation that we’re seeing the impacts of the Tonga water vapor plume and/or upper atmosphere heating from this year’s elevated solar activity. Piggybacking on USTropic’s questions, do you think either of these are likely explanations for the TCG shutdown this year?
2 likes   
Irene '11 Sandy '12 Hermine '16 5/15/2018 Derecho Fay '20 Isaias '20 Elsa '21 Henri '21 Ida '21

I am only a meteorology enthusiast who knows a decent amount about tropical cyclones. Look to the professional mets, the NHC, or your local weather office for the best information.

User avatar
Category5Kaiju
Category 5
Category 5
Posts: 4051
Joined: Thu Dec 24, 2020 12:45 pm
Location: Seattle

Re: 2024 Indicators: SST's, MSLP, Shear, SAL, Steering, Instability (Day 16+ Climate Models)

#2462 Postby Category5Kaiju » Fri Sep 13, 2024 6:44 am

aspen wrote:
al78 wrote:Given the very quiet Pacific, little activity on the horizon for the Atlantic over the next few days apart from TD7 which will likely generate minimal amounts of ACE, and the Atlantic basin has now dropped below the 1991-2020 climatology to-date, I'm thinking this year could be close to a record low for tropical cyclone activity across the northern hemisphere this year assuming we only include the satellite era.

I’m guessing that would suggest whatever’s holding the Atlantic back is a global-scale issue, which would support the speculation that we’re seeing the impacts of the Tonga water vapor plume and/or upper atmosphere heating from this year’s elevated solar activity. Piggybacking on USTropic’s questions, do you think either of these are likely explanations for the TCG shutdown this year?


If the Tonga eruption were to be still relevant, then why was last year so active though? Especially with Category 5-strength storms happening in every single basin?
4 likes   
Unless explicitly stated, all info in my posts is based on my own opinions and observations. Tropical storms and hurricanes can be extremely dangerous. Do not think you can beat Mother Nature. Refer to an accredited weather research agency or meteorologist if you need to make serious decisions regarding an approaching storm.

TomballEd
Category 2
Category 2
Posts: 585
Age: 61
Joined: Wed Aug 16, 2023 4:52 pm
Location: Spring/Klein area, not Tomball

Re: 2024 Indicators: SST's, MSLP, Shear, SAL, Steering, Instability (Day 16+ Climate Models)

#2463 Postby TomballEd » Fri Sep 13, 2024 7:02 am

SFLcane wrote:
SFLcane wrote:Really feel we could be in for one heck of an Oct in the caribbean as it continues to be illustrated by the very long gefs. We shall see!

https://i.postimg.cc/KjG2qyxn/gs.png


Look at the NW caribbean. :eek: Lets hope nothing gets going down there.

https://i.postimg.cc/kgknvZZ5/nnn.jpg


There is still a decent signal from EPS and GEFS the W. Caribbean could get active at the end of the month. With water that warm and OHC that high, the season might get a decent ACE boost from one or two Caribbean storms, although it seems unlikely the season will surpass average, and may fall short. Gordon should be named today, which gets us to 7 NS. No way the average 14 or 15 NS happens.
0 likes   

USTropics
Category 5
Category 5
Posts: 2636
Joined: Sun Aug 12, 2007 3:45 am
Location: Florida State University

Re: 2024 Indicators: SST's, MSLP, Shear, SAL, Steering, Instability (Day 16+ Climate Models)

#2464 Postby USTropics » Fri Sep 13, 2024 7:46 am

Category5Kaiju wrote:
aspen wrote:
al78 wrote:Given the very quiet Pacific, little activity on the horizon for the Atlantic over the next few days apart from TD7 which will likely generate minimal amounts of ACE, and the Atlantic basin has now dropped below the 1991-2020 climatology to-date, I'm thinking this year could be close to a record low for tropical cyclone activity across the northern hemisphere this year assuming we only include the satellite era.

I’m guessing that would suggest whatever’s holding the Atlantic back is a global-scale issue, which would support the speculation that we’re seeing the impacts of the Tonga water vapor plume and/or upper atmosphere heating from this year’s elevated solar activity. Piggybacking on USTropic’s questions, do you think either of these are likely explanations for the TCG shutdown this year?


If the Tonga eruption were to be still relevant, then why was last year so active though? Especially with Category 5-strength storms happening in every single basin?


There has been an issue since before 2022 that I will outline below (before the Tonga eruption). First, I'll point out why the ACE metric is flawed as the only parameter to measure with. Currently the Northern Hemisphere (NH) has an ACE Of 203.8 (average climo for this date is 327, so 124 ACE below climo). Lets be generous and say we get the climatological normal ACE from this point onward in the NH (~210), that puts us at ~415 ACE for the year in the NH. That would mean 2022 and 2024 both placed in the bottom ten of the past ~50 years of total ACE. The monkey in the wrench here is that 2023 had 636 ACE (12th most ACE for any year).

Here is the caveat to 2023, both seasons (2022, 2023) had below the average number of hurricanes compared to the 50 year average (31 and 32, respectively; 50 year average was 34). It just so happens that of the 32 hurricanes in 2023, an astonishing 22 of those reached major hurricane status (a ratio of ~1.4, the second best mark behind only 2015 in terms of the ratio of hurricanes that became major hurricanes). For this season, the NH is currently at 13 hurricanes (climo average is ~20, so nearly 7 hurricanes less than climo). Again, generously if we achieve the climatological normal number of hurricanes from this point onwards (14 more hurricanes), that puts us at 27 hurricanes on the season. Here is a graph I've plotted of hurricanes and major hurricanes in the NH since 1977, and if 2024 does indeed come in around ~27/28 hurricanes, we can see there has been an issue before 2022 that is causing a reduced number of hurricanes imo:

Image
3 likes   

User avatar
REDHurricane
Category 1
Category 1
Posts: 394
Age: 27
Joined: Sun Jul 03, 2022 2:36 pm
Location: Northeast Pacific Ocean

Re: 2024 Indicators: SST's, MSLP, Shear, SAL, Steering, Instability (Day 16+ Climate Models)

#2465 Postby REDHurricane » Fri Sep 13, 2024 8:08 am

USTropics wrote:
Category5Kaiju wrote:
aspen wrote:I’m guessing that would suggest whatever’s holding the Atlantic back is a global-scale issue, which would support the speculation that we’re seeing the impacts of the Tonga water vapor plume and/or upper atmosphere heating from this year’s elevated solar activity. Piggybacking on USTropic’s questions, do you think either of these are likely explanations for the TCG shutdown this year?


If the Tonga eruption were to be still relevant, then why was last year so active though? Especially with Category 5-strength storms happening in every single basin?


There has been an issue since before 2022 that I will outline below (before the Tonga eruption). First, I'll point out why the ACE metric is flawed as the only parameter to measure with. Currently the Northern Hemisphere (NH) has an ACE Of 203.8 (average climo for this date is 327, so 124 ACE below climo). Lets be generous and say we get the climatological normal ACE from this point onward in the NH (~210), that puts us at ~415 ACE for the year in the NH. That would mean 2022 and 2024 both placed in the bottom ten of the past ~50 years of total ACE. The monkey in the wrench here is that 2023 had 636 ACE (12th most ACE for any year).

Here is the caveat to 2023, both seasons (2022, 2023) had below the average number of hurricanes compared to the 50 year average (31 and 32, respectively; 50 year average was 34). It just so happens that of the 32 hurricanes in 2023, an astonishing 22 of those reached major hurricane status (a ratio of ~1.4, the second best mark behind only 2015 in terms of the ratio of hurricanes that became major hurricanes). For this season, the NH is currently at 13 hurricanes (climo average is ~20, so nearly 7 hurricanes less than climo). Again, generously if we achieve the climatological normal number of hurricanes from this point onwards (14 more hurricanes), that puts us at 27 hurricanes on the season. Here is a graph I've plotted of hurricanes and major hurricanes in the NH since 1977, and if 2024 does indeed come in around ~27/28 hurricanes, we can see there has been an issue before 2022 that is causing a reduced number of hurricanes imo:

https://i.imgur.com/LrqTx8i.png


This interesting study published a few months ago about the influence of ENSO state on future Atlantic tropical activity concludes that going forward, the average Atlantic hurricane season will likely produce fewer TCs, more ACE per TC, and slightly diminished ACE overall as a result of a gradual shift towards more El Niño-like conditions -- plus significantly elevated SSTs of course -- throughout the Atlantic and Pacific basins: https://journals.ametsoc.org/view/journals/clim/37/15/JCLI-D-23-0286.1.xml

Image

Image
2 likes   

User avatar
Ubuntwo
Category 5
Category 5
Posts: 1401
Age: 31
Joined: Thu Oct 05, 2017 10:41 pm

Re: 2024 Indicators: SST's, MSLP, Shear, SAL, Steering, Instability (Day 16+ Climate Models)

#2466 Postby Ubuntwo » Fri Sep 13, 2024 8:18 am

Troughing in the east Atlantic looks to return over the next week. This will yank the next wave so far north it won’t even get a chance to make it to the western basin. This weak Azores high has also been partially responsible for 07L’s (Gordon’s?) woes, the quick latitude gain in the eastern Atlantic is now causing it to move into a less favorable environment. For long trackers a weak Bermuda high isn’t an issue, but if there is no Azores high the development opportunities really drop.
0 likes   
Kendall -> SLO -> PBC

Memorable Storms: Katrina (for its Florida landfall...) Wilma Matthew Irma

USTropics
Category 5
Category 5
Posts: 2636
Joined: Sun Aug 12, 2007 3:45 am
Location: Florida State University

Re: 2024 Indicators: SST's, MSLP, Shear, SAL, Steering, Instability (Day 16+ Climate Models)

#2467 Postby USTropics » Fri Sep 13, 2024 8:25 am

REDHurricane wrote:
USTropics wrote:
Category5Kaiju wrote:
If the Tonga eruption were to be still relevant, then why was last year so active though? Especially with Category 5-strength storms happening in every single basin?


There has been an issue since before 2022 that I will outline below (before the Tonga eruption). First, I'll point out why the ACE metric is flawed as the only parameter to measure with. Currently the Northern Hemisphere (NH) has an ACE Of 203.8 (average climo for this date is 327, so 124 ACE below climo). Lets be generous and say we get the climatological normal ACE from this point onward in the NH (~210), that puts us at ~415 ACE for the year in the NH. That would mean 2022 and 2024 both placed in the bottom ten of the past ~50 years of total ACE. The monkey in the wrench here is that 2023 had 636 ACE (12th most ACE for any year).

Here is the caveat to 2023, both seasons (2022, 2023) had below the average number of hurricanes compared to the 50 year average (31 and 32, respectively; 50 year average was 34). It just so happens that of the 32 hurricanes in 2023, an astonishing 22 of those reached major hurricane status (a ratio of ~1.4, the second best mark behind only 2015 in terms of the ratio of hurricanes that became major hurricanes). For this season, the NH is currently at 13 hurricanes (climo average is ~20, so nearly 7 hurricanes less than climo). Again, generously if we achieve the climatological normal number of hurricanes from this point onwards (14 more hurricanes), that puts us at 27 hurricanes on the season. Here is a graph I've plotted of hurricanes and major hurricanes in the NH since 1977, and if 2024 does indeed come in around ~27/28 hurricanes, we can see there has been an issue before 2022 that is causing a reduced number of hurricanes imo:

https://i.imgur.com/LrqTx8i.png


This interesting study published a few months ago about the influence of ENSO state on future Atlantic tropical activity concludes that going forward, the average Atlantic hurricane season will likely produce fewer TCs, more ACE per TC, and slightly diminished ACE overall as a result of a gradual shift towards more El Niño-like conditions -- plus increased SSTs, of course -- throughout the Atlantic and Pacific basins: https://journals.ametsoc.org/view/journals/clim/37/15/JCLI-D-23-0286.1.xml

https://journals.ametsoc.org/view/journals/clim/37/15/full-JCLI-D-23-0286.1-t5.jpg

https://journals.ametsoc.org/view/journals/clim/37/15/full-JCLI-D-23-0286.1-f9.jpg


I actually was just looking at that study last month, but their modeled findings aren't exactly what I would suspect is causing the current reduction. ENSO modulated vertical wind shear in their analysis, an enhanced vertical wind shear was the primary driver in the reduction in the Atlantic (I think we can start to lean towards moisture flux/lapse rate being more of an issue, particularly this season). Also I want to point out, this is more a global/hemispheric issue that Dr. Lea was hinting at earlier (not localized just to the Atlantic). The irony here is that the Atlantic has actually overperformed (relative to climo), in essentially every metric:
Image

The down trend is more noticeable in the NW Pacific (where the bulk of the NH ACE is accounted for as well):
Image
3 likes   

tolakram
Admin
Admin
Posts: 19990
Age: 61
Joined: Sun Aug 27, 2006 8:23 pm
Location: Florence, KY (name is Mark)

Re: 2024 Indicators: SST's, MSLP, Shear, SAL, Steering, Instability (Day 16+ Climate Models)

#2468 Postby tolakram » Fri Sep 13, 2024 9:08 am

What I find interesting about this year is that the models seem fooled by the conditions, as if there's a parameter that is important that is not being tracked. A model will show development, then back off as current conditions get updated and they do not match what the model forecast. I'm not sure this is actually happening as it's just a casual observation. I do seem to remember this from 2013 as well, but it's been a while.

Record warm ocean temps, an environment good enough to spin up a major in July, and then something changed.

I do not buy any connection to either Tonga or Solar activity. It's just a convenient social media excuse right now until properly researched. IMO :)
5 likes   
M a r k
- - - - -
Join us in chat: Storm2K Chatroom Invite. Android and IOS apps also available.

The posts in this forum are NOT official forecasts and should not be used as such. Posts are NOT endorsed by any professional institution or STORM2K.org. For official information and forecasts, please refer to NHC and NWS products.

User avatar
Teban54
Category 5
Category 5
Posts: 3168
Joined: Sat May 19, 2018 1:19 pm

Re: 2024 Indicators: SST's, MSLP, Shear, SAL, Steering, Instability (Day 16+ Climate Models)

#2469 Postby Teban54 » Fri Sep 13, 2024 9:17 am

tolakram wrote:What I find interesting about this year is that the models seem fooled by the conditions, as if there's a parameter that is important that is not being tracked. A model will show development, then back off as current conditions get updated and they do not match what the model forecast. I'm not sure this is actually happening as it's just a casual observation. I do seem to remember this from 2013 as well, but it's been a while.

Record warm ocean temps, an environment good enough to spin up a major in July, and then something changed.

I do not buy any connection to either Tonga or Solar activity. It's just a convenient social media excuse right now until properly researched. IMO :)

On the contrary, I'd argue that models have been showing less phantom storms this year than they typically do. About 2 weeks ago, someone posted a single GFS run valid in early September 2022 that showed 4 TCs, apparently as an argument for how "favorable" the background state in 2022 was (compared to this year when models were showing nothing in that period). Of course, the only system of the 4 that actually formed was Earl.

If anything, false negatives seem like a bigger issue for models this year than false positives. Francine's eventual genesis in the BoC was poorly forecast by all operational models except ICON. TD 7's genesis was also totally out of the expectations of GFS even in the short term.

Yes, both were the main ones that were falsely hyped by several models (deterministic or ensemble) to be MDR hurricanes, but those were also around 10 days out. And even then, the point is that I do suspect two is still a lot fewer than what models would have shown in other years with similar conditions, with 2022 being a prime example. That also happens even in less hostile years: Peter 2021, Philippe 2023, and so on.

Whether things will become more favorable later is anyone's guess, but even if they do, I have little faith in us knowing in advance because of the false negatives.
2 likes   

tolakram
Admin
Admin
Posts: 19990
Age: 61
Joined: Sun Aug 27, 2006 8:23 pm
Location: Florence, KY (name is Mark)

Re: 2024 Indicators: SST's, MSLP, Shear, SAL, Steering, Instability (Day 16+ Climate Models)

#2470 Postby tolakram » Fri Sep 13, 2024 9:23 am

I think Seven is a perfect example of what I'm talking about. Development always at the end of the run. Use tropical tidbits to look at older runs, in particular look at the predicted outcome on Sept 18th. It keeps backing off intensity.

0Z from this morning

Image

0Z from September 10th
Image
2 likes   
M a r k
- - - - -
Join us in chat: Storm2K Chatroom Invite. Android and IOS apps also available.

The posts in this forum are NOT official forecasts and should not be used as such. Posts are NOT endorsed by any professional institution or STORM2K.org. For official information and forecasts, please refer to NHC and NWS products.

WeatherBoy2000
Category 1
Category 1
Posts: 280
Joined: Mon Apr 10, 2023 9:29 am

Re: 2024 Indicators: SST's, MSLP, Shear, SAL, Steering, Instability (Day 16+ Climate Models)

#2471 Postby WeatherBoy2000 » Fri Sep 13, 2024 9:24 am

USTropics wrote:
REDHurricane wrote:
USTropics wrote:
There has been an issue since before 2022 that I will outline below (before the Tonga eruption). First, I'll point out why the ACE metric is flawed as the only parameter to measure with. Currently the Northern Hemisphere (NH) has an ACE Of 203.8 (average climo for this date is 327, so 124 ACE below climo). Lets be generous and say we get the climatological normal ACE from this point onward in the NH (~210), that puts us at ~415 ACE for the year in the NH. That would mean 2022 and 2024 both placed in the bottom ten of the past ~50 years of total ACE. The monkey in the wrench here is that 2023 had 636 ACE (12th most ACE for any year).

Here is the caveat to 2023, both seasons (2022, 2023) had below the average number of hurricanes compared to the 50 year average (31 and 32, respectively; 50 year average was 34). It just so happens that of the 32 hurricanes in 2023, an astonishing 22 of those reached major hurricane status (a ratio of ~1.4, the second best mark behind only 2015 in terms of the ratio of hurricanes that became major hurricanes). For this season, the NH is currently at 13 hurricanes (climo average is ~20, so nearly 7 hurricanes less than climo). Again, generously if we achieve the climatological normal number of hurricanes from this point onwards (14 more hurricanes), that puts us at 27 hurricanes on the season. Here is a graph I've plotted of hurricanes and major hurricanes in the NH since 1977, and if 2024 does indeed come in around ~27/28 hurricanes, we can see there has been an issue before 2022 that is causing a reduced number of hurricanes imo:

https://i.imgur.com/LrqTx8i.png


This interesting study published a few months ago about the influence of ENSO state on future Atlantic tropical activity concludes that going forward, the average Atlantic hurricane season will likely produce fewer TCs, more ACE per TC, and slightly diminished ACE overall as a result of a gradual shift towards more El Niño-like conditions -- plus increased SSTs, of course -- throughout the Atlantic and Pacific basins: https://journals.ametsoc.org/view/journals/clim/37/15/JCLI-D-23-0286.1.xml

https://journals.ametsoc.org/view/journals/clim/37/15/full-JCLI-D-23-0286.1-t5.jpg


https://journals.ametsoc.org/view/journals/clim/37/15/full-JCLI-D-23-0286.1-f9.jpg


I actually was just looking at that study last month, but their modeled findings aren't exactly what I would suspect is causing the current reduction. ENSO modulated vertical wind shear in their analysis, an enhanced vertical wind shear was the primary driver in the reduction in the Atlantic (I think we can start to lean towards moisture flux/lapse rate being more of an issue, particularly this season). Also I want to point out, this is more a global/hemispheric issue that Dr. Lea was hinting at earlier (not localized just to the Atlantic). The irony here is that the Atlantic has actually overperformed (relative to climo), in essentially every metric:
https://i.imgur.com/TZ97Xeb.png

The down trend is more noticeable in the NW Pacific (where the bulk of the NH ACE is accounted for as well):
https://i.imgur.com/btoIn8Z.png


Yeah outside this year and 2022, the Atlantic has generally had elevated activity. We haven't had a below average season since 2015 (2024 may finally break the streak) with an unprecedented streak of above seasons from 2016-2021 (six in a row). Even by +amo standards it's been unusually long time since we have seen a below average season. Oddly enough, since 2015, the seasons that have struggled the most have been -enso years (2022/2024). 2013 was the worst performing Atlantic season since 2010 and was a -enso year as well.

Maybe 2024 is going to be the start of an ongoing trend that validates the study, but 2024 could easily just be a one-off fluke like 2013 as well.
2 likes   

USTropics
Category 5
Category 5
Posts: 2636
Joined: Sun Aug 12, 2007 3:45 am
Location: Florida State University

Re: 2024 Indicators: SST's, MSLP, Shear, SAL, Steering, Instability (Day 16+ Climate Models)

#2472 Postby USTropics » Fri Sep 13, 2024 9:36 am

tolakram wrote:What I find interesting about this year is that the models seem fooled by the conditions, as if there's a parameter that is important that is not being tracked. A model will show development, then back off as current conditions get updated and they do not match what the model forecast. I'm not sure this is actually happening as it's just a casual observation. I do seem to remember this from 2013 as well, but it's been a while.

Record warm ocean temps, an environment good enough to spin up a major in July, and then something changed.

I do not buy any connection to either Tonga or Solar activity. It's just a convenient social media excuse right now until properly researched. IMO :)


That's very true, they can't model small-scale vertical ascent (would need a mesoscale gridded component to do that). While the global/dynamic models can parameterize convection, they essentially approximate vertical ascent which can lead to significant errors further in the forecast. Just isolating the Atlantic here, one of the lessons I'm taking from this season is even if our monthly parameters (SSTAs, vert wind shear, 700-300mb HUM, etc.) are all pointing at an active season, we forgot about the first stage of development. If our seeds (i.e., tropical waves) are failing before they even reach these conditions (either through high latitude extents, weaker vortex signatures, lack of attainable lapse rate, etc) all of the other stuff is mute in regards to activity in the eastern Atlantic/MDR.

Either way, even if we finish this season with robust activity, something happened from Beryl onwards that shut the bulk of the Atlantic hurricane season down like you stated. Remove Beryl from this map, and we're 1/2 way through September with essentially nothing in the eastern Atlantic:

Image
5 likes   

User avatar
Category5Kaiju
Category 5
Category 5
Posts: 4051
Joined: Thu Dec 24, 2020 12:45 pm
Location: Seattle

Re: 2024 Indicators: SST's, MSLP, Shear, SAL, Steering, Instability (Day 16+ Climate Models)

#2473 Postby Category5Kaiju » Fri Sep 13, 2024 10:57 am

USTropics wrote:
tolakram wrote:What I find interesting about this year is that the models seem fooled by the conditions, as if there's a parameter that is important that is not being tracked. A model will show development, then back off as current conditions get updated and they do not match what the model forecast. I'm not sure this is actually happening as it's just a casual observation. I do seem to remember this from 2013 as well, but it's been a while.

Record warm ocean temps, an environment good enough to spin up a major in July, and then something changed.

I do not buy any connection to either Tonga or Solar activity. It's just a convenient social media excuse right now until properly researched. IMO :)


That's very true, they can't model small-scale vertical ascent (would need a mesoscale gridded component to do that). While the global/dynamic models can parameterize convection, they essentially approximate vertical ascent which can lead to significant errors further in the forecast. Just isolating the Atlantic here, one of the lessons I'm taking from this season is even if our monthly parameters (SSTAs, vert wind shear, 700-300mb HUM, etc.) are all pointing at an active season, we forgot about the first stage of development. If our seeds (i.e., tropical waves) are failing before they even reach these conditions (either through high latitude extents, weaker vortex signatures, lack of attainable lapse rate, etc) all of the other stuff is mute in regards to activity in the eastern Atlantic/MDR.

Either way, even if we finish this season with robust activity, something happened from Beryl onwards that shut the bulk of the Atlantic hurricane season down like you stated. Remove Beryl from this map, and we're 1/2 way through September with essentially nothing in the eastern Atlantic:

https://i.imgur.com/euAiPgB.png


I’m personally very curious to see the post-season studies on Beryl. Especially given the context of the rather slow overall peak season, it just seems so fascinating and weird for a storm like Beryl to have happened.
1 likes   
Unless explicitly stated, all info in my posts is based on my own opinions and observations. Tropical storms and hurricanes can be extremely dangerous. Do not think you can beat Mother Nature. Refer to an accredited weather research agency or meteorologist if you need to make serious decisions regarding an approaching storm.

WeatherBoy2000
Category 1
Category 1
Posts: 280
Joined: Mon Apr 10, 2023 9:29 am

Re: 2024 Indicators: SST's, MSLP, Shear, SAL, Steering, Instability (Day 16+ Climate Models)

#2474 Postby WeatherBoy2000 » Fri Sep 13, 2024 11:39 am

Category5Kaiju wrote:
USTropics wrote:
tolakram wrote:What I find interesting about this year is that the models seem fooled by the conditions, as if there's a parameter that is important that is not being tracked. A model will show development, then back off as current conditions get updated and they do not match what the model forecast. I'm not sure this is actually happening as it's just a casual observation. I do seem to remember this from 2013 as well, but it's been a while.

Record warm ocean temps, an environment good enough to spin up a major in July, and then something changed.

I do not buy any connection to either Tonga or Solar activity. It's just a convenient social media excuse right now until properly researched. IMO :)


That's very true, they can't model small-scale vertical ascent (would need a mesoscale gridded component to do that). While the global/dynamic models can parameterize convection, they essentially approximate vertical ascent which can lead to significant errors further in the forecast. Just isolating the Atlantic here, one of the lessons I'm taking from this season is even if our monthly parameters (SSTAs, vert wind shear, 700-300mb HUM, etc.) are all pointing at an active season, we forgot about the first stage of development. If our seeds (i.e., tropical waves) are failing before they even reach these conditions (either through high latitude extents, weaker vortex signatures, lack of attainable lapse rate, etc) all of the other stuff is mute in regards to activity in the eastern Atlantic/MDR.

Either way, even if we finish this season with robust activity, something happened from Beryl onwards that shut the bulk of the Atlantic hurricane season down like you stated. Remove Beryl from this map, and we're 1/2 way through September with essentially nothing in the eastern Atlantic:

https://i.imgur.com/euAiPgB.png


I’m personally very curious to see the post-season studies on Beryl. Especially given the context of the rather slow overall peak season, it just seems so fascinating and weird for a storm like Beryl to have happened.


I remember a met on twitter saying just before Beryl blew up that with "peak season ssts you're going to get peak season storms" and I think that was what happened with Beryl. 2024 was the fourth year in a row where late June mdr development was at least attempted, so Beryl didn't completely come out of nowhere.

As the Atlantic Ocean continues to warm, it is likely going to allow for more intense storms at earlier and later points in the year no matter the total activity.
5 likes   

User avatar
chaser1
S2K Supporter
S2K Supporter
Posts: 5407
Age: 64
Joined: Sat Oct 15, 2005 5:59 pm
Location: Longwood, Fl

Re: 2024 Indicators: SST's, MSLP, Shear, SAL, Steering, Instability (Day 16+ Climate Models)

#2475 Postby chaser1 » Fri Sep 13, 2024 11:50 am

Category5Kaiju wrote:
USTropics wrote:
tolakram wrote:What I find interesting about this year is that the models seem fooled by the conditions, as if there's a parameter that is important that is not being tracked. A model will show development, then back off as current conditions get updated and they do not match what the model forecast. I'm not sure this is actually happening as it's just a casual observation. I do seem to remember this from 2013 as well, but it's been a while.

Record warm ocean temps, an environment good enough to spin up a major in July, and then something changed.

I do not buy any connection to either Tonga or Solar activity. It's just a convenient social media excuse right now until properly researched. IMO :)


That's very true, they can't model small-scale vertical ascent (would need a mesoscale gridded component to do that). While the global/dynamic models can parameterize convection, they essentially approximate vertical ascent which can lead to significant errors further in the forecast. Just isolating the Atlantic here, one of the lessons I'm taking from this season is even if our monthly parameters (SSTAs, vert wind shear, 700-300mb HUM, etc.) are all pointing at an active season, we forgot about the first stage of development. If our seeds (i.e., tropical waves) are failing before they even reach these conditions (either through high latitude extents, weaker vortex signatures, lack of attainable lapse rate, etc) all of the other stuff is mute in regards to activity in the eastern Atlantic/MDR.

Either way, even if we finish this season with robust activity, something happened from Beryl onwards that shut the bulk of the Atlantic hurricane season down like you stated. Remove Beryl from this map, and we're 1/2 way through September with essentially nothing in the eastern Atlantic:

https://i.imgur.com/euAiPgB.png


I’m personally very curious to see the post-season studies on Beryl. Especially given the context of the rather slow overall peak season, it just seems so fascinating and weird for a storm like Beryl to have happened.


That is an intriguing point. It won't take too much research time at all but over the weekend I'll be very curious to look back and see whether there were any other Northern Hemisphere basin events that also coincidentally peaked for a short period right at and near the point when Beryl developed. That, and curious to see what extent of favorability the MJO was at the time. There's no doubt that Beryl in 2024 was an aberration within an aberration :lol:
2 likes   
Andy D

(For official information, please refer to the NHC and NWS products.)

TomballEd
Category 2
Category 2
Posts: 585
Age: 61
Joined: Wed Aug 16, 2023 4:52 pm
Location: Spring/Klein area, not Tomball

Re: 2024 Indicators: SST's, MSLP, Shear, SAL, Steering, Instability (Day 16+ Climate Models)

#2476 Postby TomballEd » Fri Sep 13, 2024 4:44 pm

Ensembles continue to insist a week from MOnday or Tuesdat the SW Gulf will get active. Canadian ensembles and EPS also have members developing storms. E. Gulf and SEUSA could see end of September action.


Image
1 likes   

User avatar
Stormybajan
Category 1
Category 1
Posts: 447
Joined: Thu May 20, 2021 3:21 pm
Location: Windward Islands

Re: 2024 Indicators: SST's, MSLP, Shear, SAL, Steering, Instability (Day 16+ Climate Models)

#2477 Postby Stormybajan » Mon Sep 16, 2024 8:34 am

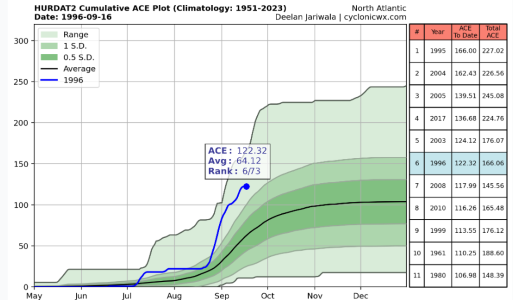
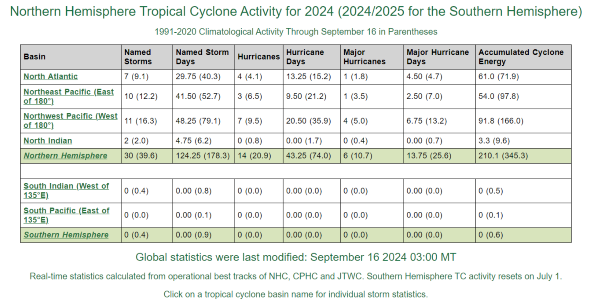
Well, ill be the first to say it... but NEVER in life did I imagine that the 2024 Atlantic hurricane season, where 99% percent of persons like myself and professional agencies though it would be top 10 historically active, ESPECIALLY after Beryl which put us at #1 for activity in late June very early July... would somehow be OVER 100 ACE points below 1995 and 2004 by peak season :double: :bored:
Image

The season has somehow managed to become below average in every single metric used to gauge activity according to CSU's website lol. :sadly:
Image

Of course this doesnt mean much for future impacts as we've seen what madness the caribbean, especially the western part of the caribbean, can conjure up during CAG season in cool-nuetral or La Nina seasons but whatever happens from here, surely nobody had THIS on the cards, roaring start, half dead middle...now we have to follow the back end of the hurricane season race and see how it finishes and plays out in the end!
4 likes   
Sad West Indies and Manchester United fan ⚽️

869MB
S2K Supporter
S2K Supporter
Posts: 157
Joined: Thu Feb 14, 2019 9:49 pm
Location: Katy, TX

Re: 2024 Indicators: SST's, MSLP, Shear, SAL, Steering, Instability (Day 16+ Climate Models)

#2478 Postby 869MB » Tue Sep 17, 2024 11:21 am

1 likes   

User avatar
galaxy401
Category 5
Category 5
Posts: 2410
Age: 29
Joined: Sat Aug 25, 2012 9:04 pm
Location: Casa Grande, Arizona

Re: 2024 Indicators: SST's, MSLP, Shear, SAL, Steering, Instability (Day 16+ Climate Models)

#2479 Postby galaxy401 » Tue Sep 17, 2024 2:32 pm

It's September 17 now and the Northern Hemisphere is almost completely quiet. Nothing in the Atlantic, nothing in the East Pacific, and only a tropical storm in the West Pacific. There's been a lot of theories on why the Atlantic has been so quiet the last six weeks but this also appears to be a global issue as well. There just doesn't seem to be enough moisture for tropical systems to form.
2 likes   
Got my eyes on moving right into Hurricane Alley: Florida.

User avatar
Category5Kaiju
Category 5
Category 5
Posts: 4051
Joined: Thu Dec 24, 2020 12:45 pm
Location: Seattle

Re: 2024 Indicators: SST's, MSLP, Shear, SAL, Steering, Instability (Day 16+ Climate Models)

#2480 Postby Category5Kaiju » Tue Sep 17, 2024 3:01 pm

galaxy401 wrote:It's September 17 now and the Northern Hemisphere is almost completely quiet. Nothing in the Atlantic, nothing in the East Pacific, and only a tropical storm in the West Pacific. There's been a lot of theories on why the Atlantic has been so quiet the last six weeks but this also appears to be a global issue as well. There just doesn't seem to be enough moisture for tropical systems to form.


What’s interesting is despite the Northern Hemisphere struggles, it still managed to generate some powerful, destructive storms along the way (namely Beryl in the Atlantic and Yagi in the WPAC). Just really shows how even a slow year doesn’t mean the absence of impacts.
1 likes   
Unless explicitly stated, all info in my posts is based on my own opinions and observations. Tropical storms and hurricanes can be extremely dangerous. Do not think you can beat Mother Nature. Refer to an accredited weather research agency or meteorologist if you need to make serious decisions regarding an approaching storm.


Return to “Talkin' Tropics”

Who is online

Users browsing this forum: No registered users and 1167 guests