2020 Indicators: SST's / SAL / MSLP / Steering / Shear / Instability / Sat Images

This is the general tropical discussion area. Anyone can take their shot at predicting a storms path.

Moderator: S2k Moderators

Forum rules

The posts in this forum are NOT official forecasts and should not be used as such. They are just the opinion of the poster and may or may not be backed by sound meteorological data. They are NOT endorsed by any professional institution or STORM2K. For official information, please refer to products from the National Hurricane Center and National Weather Service.

Help Support Storm2K
Message
Author
User avatar
Hurricaneman
Category 5
Category 5
Posts: 7350
Age: 45
Joined: Tue Aug 31, 2004 3:24 pm
Location: central florida

Re: 2020 Indicators: SST's / SAL / MSLP / Steering / Shear / Instability / Sat Images

#2501 Postby Hurricaneman » Fri Aug 14, 2020 6:32 pm

Hammy wrote:
Hurricaneman wrote:Here’s how I see it for the most part

Amateurs tend to hug the models more which leads to lead towards the bearish side

Pro Mets tend to use the meteorological side of things and look more at real time data and what the indices are doing which leads more toward fact

The fact that pro Mets are saying buckle up especially the experts at the NHC and crownweather tells me the people on the bearish side aren’t looking at all the data and just what models tell them

Also it means starting next week things could start to get ugly from the 25th of this month until October which is a scary thought And there could be multiple landfalls of strong hurricanes on the US coast


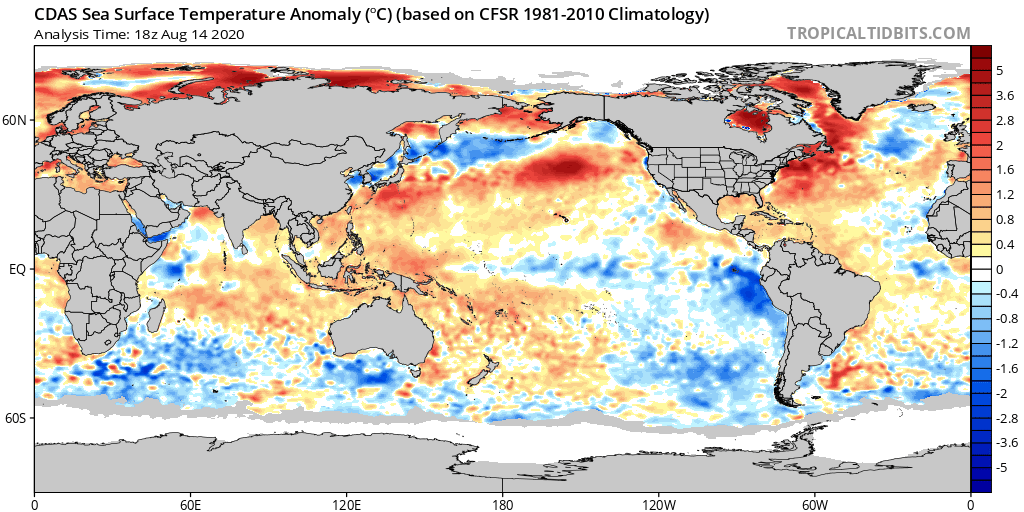
This is why I posted the CFS from time to time, it actually gives a good idea of the general activity even if you can't use it to say this storm will occur on this day, and this is pretty on par with what it's been showing. It never at any point showed a very active August, but likewise has been consistently showing quite a bit of activity (and trending busier) starting between the last week of August and the first week of September and shows a lot of back to back storms developing and long trackers lasting into early October after that point.

The CFS sniffed out Isiais before any model eve as far back as June to when and where it actually happened so it may be the go to right now
2 likes   

User avatar
NotSparta
Professional-Met
Professional-Met
Posts: 1668
Age: 23
Joined: Fri Aug 18, 2017 8:24 am
Location: Naples, FL
Contact:

Re: 2020 Indicators: SST's / SAL / MSLP / Steering / Shear / Instability / Sat Images

#2502 Postby NotSparta » Fri Aug 14, 2020 7:39 pm

Not sure where this would belong, but I think this is a good summary of most of the season so far :lol:

Credit to typhonium

Image
31 likes   
This post was probably an opinion of mine, and in no way is official. Please refer to http://www.hurricanes.gov for official tropical analysis and advisories.

My website, with lots of tropical wx graphics, including satellite and recon: http://cyclonicwx.com

User avatar
toad strangler
S2K Supporter
S2K Supporter
Posts: 4543
Joined: Sun Jul 28, 2013 3:09 pm
Location: Earth
Contact:

Re: 2020 Indicators: SST's / SAL / MSLP / Steering / Shear / Instability / Sat Images

#2503 Postby toad strangler » Fri Aug 14, 2020 8:02 pm

NotSparta wrote:Not sure where this would belong, but I think this is a good summary of most of the season so far :lol:

Credit to typhonium

https://i.imgur.com/Uh8nP31.jpg


2013 grams hahahahahahahah
7 likes   


User avatar
gatorcane
S2K Supporter
S2K Supporter
Posts: 23691
Age: 47
Joined: Sun Mar 13, 2005 3:54 pm
Location: Boca Raton, FL

Re: 2020 Indicators: SST's / SAL / MSLP / Steering / Shear / Instability / Sat Images

#2506 Postby gatorcane » Fri Aug 14, 2020 8:14 pm

The indicators I am looking at to me still suggest we could see a progressive pattern over North America and Western Atlantic for peak months August - October rather than a semi-permanent anomalously strong Bermuda High as we saw more of in 2015, 2016, and 2017.

1) A combination of warmer to much warmer than normal waters in the region around Bermuda, off the east coast of the US, and off the coast of SE Canada which could lead to more rising motion and lowering or pressure which would help decrease the strength of the Bermuda High.
2) Much warmer than normal waters in the Northern Pacific which could help intensify northern and mid-latitude disturbances from the Pacific traveling along the jet stream over North America.
3) Possible indicators a fall pattern over North America may start a bit early this year. We have yet another anomalously strong trough over the eastern CONUS expected to develop with anomalously low 500mb heights all the way down into the southern Gulf of Mexico which is rare to see this time of year. Further runs of the globals models, particularly the GFS and GEFS, suggest a series of future troughs sweeping across the northern US and southern Canada. The pattern is already looking like hints of fall, below normal temperatures may be possible at times for the Eastern US for the next 10+ days
0 likes   

User avatar
Spacecoast
Category 2
Category 2
Posts: 758
Joined: Thu Aug 31, 2017 2:03 pm

Re: 2020 Indicators: SST's / SAL / MSLP / Steering / Shear / Instability / Sat Images

#2507 Postby Spacecoast » Fri Aug 14, 2020 8:27 pm

Hurricaneman wrote:Here’s how I see it for the most part
...
Also it means starting next week things could start to get ugly from the 25th of this month until October which is a scary thought And there could be multiple landfalls of strong hurricanes on the US coast


From CSU / GeoGraphics Laboratory August 2020 Forecast

Probability of at least one Major Hurricanes making landfall:
Entire U.S. coastline (Regions 1-11): 74%
Caribbean: 63%
U.S. East Coast including the Florida peninsula (Regions 5-11): 49%
Gulf Coast (Regions 1-4): 48%

Probabilty of 1 or more Hurricanes (Region)

Region 3(N.O. to Pensacola): 52.2%
Region 8 (Charleston to Hatteras): 47.1%
Region 1(Browsnesvile to Houston): 46.4%
Region 6(Key West to Jupiter): 45.2%
Region 4(Apalachicola): 24.1%
Region 7(St. Luccie to Glunn, Ga.): 14.7%
Region 5 (Naples to Tampa): 14.3%

Probabilty of 1 or more Intense Hurricanes (Region)
Region 3(N.O. to Pensacola): 28.3%
Region 6(Key West to Jupiter): 24.1%
Region 1(Browsnesvile to Houston): 21.8%
Region 8 (Charleston to Hatteras): 16.2%
Region 5 (Naples to Tampa): 8.2%
Region 7(St. Luccie to Glunn, Ga.): 4.3%
Region 4(Apalachicola): 2.9%

Probability of 1 or more Hurricanes (County)
Key West / Monroe: 28.2%
Miami- Dade: 10.5%
Charleston: 10.0%
Hatteras / Dare: 8.4%
Palm Beach: 7.7%
Brownsville / Cameron: 6.6%
Houston / Harris: 4.9%
Appalachcola / Franklin: 4.9%

Probability of 1 or more Intense Hurricanes (County)
Key West / Monroe: 14.1%
Miami- Dade: 4.9%
Palm Beach: 3.6%
Charleston: 2.9%
Brownsville / Cameron: 2.7%
Hatteras / Dare: 2.4%
0 likes   

User avatar
TheProfessor
Professional-Met
Professional-Met
Posts: 3506
Age: 28
Joined: Tue Dec 03, 2013 10:56 am
Location: Wichita, Kansas

Re: 2020 Indicators: SST's / SAL / MSLP / Steering / Shear / Instability / Sat Images

#2508 Postby TheProfessor » Fri Aug 14, 2020 8:29 pm

gatorcane wrote:The indicators I am looking at to me still suggest we could see a progressive pattern for peak months August - October rather than a semi-permanent anomalously strong Bermuda High as we saw more of in 2015, 2016, and 2017.

1) A combination of warmer to much warmer than normal waters in the region around Bermuda, off the east coast of the US, and off the coast of SE Canada which could lead to more rising motion and lowering or pressure which would help decrease the strength of the Bermuda High.
2) Much warmer than normal waters in the Northern Pacific which could help intensify northern and mid-latitude disturbances from the Pacific traveling along the jet stream over North America.
3) Possible indicators a fall pattern over North America may start a bit early this year. We have yet another anomalously strong trough over the eastern CONUS expected to develop with anomalously low 500mb heights all the way down into the southern Gulf of Mexico which is rare to see this time of year. Further runs of the globals models, particularly the GFS and GEFS, suggest a series of future troughs sweeping across the northern US and southern Canada. The pattern is already looking like hints of fall, below normal temperatures may be possible at times for the Eastern US for the next 10+ days


A progressive pattern does not mean that the U.S can't get hit, in fact if we had an amplified trough off the east coast that was being blocked that would be better for the U.S as any storm that approaches would be swiftly swept northward up to the north Atlantic. In a progressive patter timing becomes critical. If a storm arrives as a trough is moving through the plains then that puts the U.S at risk. If a trough moves out too quickly a storm could get trapped underneath the ridge. It's a very fragile pattern during hurricane season and even a small error in modeling could be the difference of a safe re-curve or an Irma like track.
8 likes   
An alumnus of The Ohio State University.

Your local National Weather Service office is your best source for weather information.

User avatar
gatorcane
S2K Supporter
S2K Supporter
Posts: 23691
Age: 47
Joined: Sun Mar 13, 2005 3:54 pm
Location: Boca Raton, FL

Re: 2020 Indicators: SST's / SAL / MSLP / Steering / Shear / Instability / Sat Images

#2509 Postby gatorcane » Fri Aug 14, 2020 8:48 pm

TheProfessor wrote:
gatorcane wrote:The indicators I am looking at to me still suggest we could see a progressive pattern for peak months August - October rather than a semi-permanent anomalously strong Bermuda High as we saw more of in 2015, 2016, and 2017.

1) A combination of warmer to much warmer than normal waters in the region around Bermuda, off the east coast of the US, and off the coast of SE Canada which could lead to more rising motion and lowering or pressure which would help decrease the strength of the Bermuda High.
2) Much warmer than normal waters in the Northern Pacific which could help intensify northern and mid-latitude disturbances from the Pacific traveling along the jet stream over North America.
3) Possible indicators a fall pattern over North America may start a bit early this year. We have yet another anomalously strong trough over the eastern CONUS expected to develop with anomalously low 500mb heights all the way down into the southern Gulf of Mexico which is rare to see this time of year. Further runs of the globals models, particularly the GFS and GEFS, suggest a series of future troughs sweeping across the northern US and southern Canada. The pattern is already looking like hints of fall, below normal temperatures may be possible at times for the Eastern US for the next 10+ days


A progressive pattern does not mean that the U.S can't get hit, in fact if we had an amplified trough off the east coast that was being blocked that would be better for the U.S as any storm that approaches would be swiftly swept northward up to the north Atlantic. In a progressive patter timing becomes critical. If a storm arrives as a trough is moving through the plains then that puts the U.S at risk. If a trough moves out too quickly a storm could get trapped underneath the ridge. It's a very fragile pattern during hurricane season and even a small error in modeling could be the difference of a safe re-curve or an Irma like track.


Thanks for the explanation and I agree it does not but what I think is that we are less likely to see something like an Irma-like scenario or 2004-type tracks into Florida from the east. That same progressive pattern and trough could indeed recurve something into Florida from the south which is something that is entirely possible especially if we get some storms that get into the Western or NW Caribbean particularly late season.

Here is the latest SST anomaly map. Really has warmed in that area of the northern Western Atlantic:

Image
0 likes   

User avatar
SFLcane
S2K Supporter
S2K Supporter
Posts: 10163
Age: 47
Joined: Sat Jun 05, 2010 1:44 pm
Location: Lake Worth Florida

Re: 2020 Indicators: SST's / SAL / MSLP / Steering / Shear / Instability / Sat Images

#2510 Postby SFLcane » Fri Aug 14, 2020 9:59 pm


And one more time. :eek:

This wave if it tries to develop steering looks quite dangerous for the US. Not recurving earlier
1 likes   

User avatar
StruThiO
Category 3
Category 3
Posts: 821
Age: 25
Joined: Fri Sep 15, 2017 5:51 am
Location: Currently Portland, OR. Raised in Jax, FL.

Re: 2020 Indicators: SST's / SAL / MSLP / Steering / Shear / Instability / Sat Images

#2511 Postby StruThiO » Fri Aug 14, 2020 10:00 pm

Still in the suppressed MJO btw.

Image

4 likes   

User avatar
SFLcane
S2K Supporter
S2K Supporter
Posts: 10163
Age: 47
Joined: Sat Jun 05, 2010 1:44 pm
Location: Lake Worth Florida

Re: 2020 Indicators: SST's / SAL / MSLP / Steering / Shear / Instability / Sat Images

#2512 Postby SFLcane » Fri Aug 14, 2020 10:02 pm

gatorcane wrote:The indicators I am looking at to me still suggest we could see a progressive pattern over North America and Western Atlantic for peak months August - October rather than a semi-permanent anomalously strong Bermuda High as we saw more of in 2015, 2016, and 2017.

1) A combination of warmer to much warmer than normal waters in the region around Bermuda, off the east coast of the US, and off the coast of SE Canada which could lead to more rising motion and lowering or pressure which would help decrease the strength of the Bermuda High.
2) Much warmer than normal waters in the Northern Pacific which could help intensify northern and mid-latitude disturbances from the Pacific traveling along the jet stream over North America.
3) Possible indicators a fall pattern over North America may start a bit early this year. We have yet another anomalously strong trough over the eastern CONUS expected to develop with anomalously low 500mb heights all the way down into the southern Gulf of Mexico which is rare to see this time of year. Further runs of the globals models, particularly the GFS and GEFS, suggest a series of future troughs sweeping across the northern US and southern Canada. The pattern is already looking like hints of fall, below normal temperatures may be possible at times for the Eastern US for the next 10+ days


Actually the euro weeklies have a very dangerous setup in place. Hints of fall?
1 likes   

shiny-pebble
Category 1
Category 1
Posts: 299
Joined: Thu Jul 05, 2018 1:38 pm

Re: 2020 Indicators: SST's / SAL / MSLP / Steering / Shear / Instability / Sat Images

#2513 Postby shiny-pebble » Fri Aug 14, 2020 10:05 pm

1 likes   
Not an meteorologist! Just someone who is interested in weather. Please refer to the NHC and local weather officials to make decisions.
-Jack 8-)

User avatar
aspen
Category 5
Category 5
Posts: 8818
Joined: Sat Oct 12, 2019 7:10 pm
Location: Connecticut, USA

Re: 2020 Indicators: SST's / SAL / MSLP / Steering / Shear / Instability / Sat Images

#2514 Postby aspen » Fri Aug 14, 2020 10:19 pm

StruThiO wrote:Still in the suppressed MJO btw.

https://i.imgur.com/FZLrCek.png

https://imgur.com/b1oZHvb

That is an absolute monster of an AEW. If it survives its trek across the MDR, it could catch the MJO while getting into the Caribbean. Maybe its the precursor of the <950 mbar EPS ensemble member.

Also, an unrelated question with a potentially obvious answer: would lower average pressure in the MDR mean storms of a certain wind speed will be slightly stronger pressure-wise in comparison to similar storms in the same area in previous years? For example, if we were to see another 155 kt Cat 5 near the Lesser Antilles like Irma this season, would it be more likely to have a lower pressure since pressures in that region are lower than those of 2017?
2 likes   
Irene '11 Sandy '12 Hermine '16 5/15/2018 Derecho Fay '20 Isaias '20 Elsa '21 Henri '21 Ida '21

I am only a meteorology enthusiast who knows a decent amount about tropical cyclones. Look to the professional mets, the NHC, or your local weather office for the best information.

User avatar
NDG
S2K Supporter
S2K Supporter
Posts: 15446
Joined: Sun Jul 09, 2006 10:14 pm
Location: Orlando, FL

Re: 2020 Indicators: SST's / SAL / MSLP / Steering / Shear / Instability / Sat Images

#2515 Postby NDG » Sat Aug 15, 2020 7:51 am

gatorcane wrote:The indicators I am looking at to me still suggest we could see a progressive pattern over North America and Western Atlantic for peak months August - October rather than a semi-permanent anomalously strong Bermuda High as we saw more of in 2015, 2016, and 2017.

1) A combination of warmer to much warmer than normal waters in the region around Bermuda, off the east coast of the US, and off the coast of SE Canada which could lead to more rising motion and lowering or pressure which would help decrease the strength of the Bermuda High.
2) Much warmer than normal waters in the Northern Pacific which could help intensify northern and mid-latitude disturbances from the Pacific traveling along the jet stream over North America.
3) Possible indicators a fall pattern over North America may start a bit early this year. We have yet another anomalously strong trough over the eastern CONUS expected to develop with anomalously low 500mb heights all the way down into the southern Gulf of Mexico which is rare to see this time of year. Further runs of the globals models, particularly the GFS and GEFS, suggest a series of future troughs sweeping across the northern US and southern Canada. The pattern is already looking like hints of fall, below normal temperatures may be possible at times for the Eastern US for the next 10+ days


Like I have said before is way too early to say that, the deep trough digging down the Ohio & MS river valley next week will not be progressing eastward.
Models are suggesting possible strong AEWs cruising across the Caribbean next week.
They also show much improved UL conditions across the Caribbean.

Image
Image
1 likes   


Ubercast
Tropical Wave
Tropical Wave
Posts: 5
Joined: Fri Sep 07, 2018 6:13 am

Re: 2020 Indicators: SST's / SAL / MSLP / Steering / Shear / Instability / Sat Images

#2517 Postby Ubercast » Sat Aug 15, 2020 9:45 am

MetroMike wrote:
Kazmit wrote:
Monsoonjr99 wrote:It just seems every single indicator this year so far has been pointing towards an ugly season and it just keeps getting uglier... :eek:

Only thing to do now is wait and see what happens. :roll:


We shall see if the favorable MJO wave actually makes it into the Atl. Basin or becomes a suppressed Kelvin wave.


I haven’t heard this said before, but how likely is this to happen?
0 likes   

Visioen
S2K Supporter
S2K Supporter
Posts: 286
Joined: Sat Sep 02, 2017 2:08 pm
Location: Belgium, Europe

Re: 2020 Indicators: SST's / SAL / MSLP / Steering / Shear / Instability / Sat Images

#2518 Postby Visioen » Sat Aug 15, 2020 12:49 pm

Ubercast wrote:
MetroMike wrote:
Kazmit wrote:Only thing to do now is wait and see what happens. :roll:


We shall see if the favorable MJO wave actually makes it into the Atl. Basin or becomes a suppressed Kelvin wave.


I haven’t heard this said before, but how likely is this to happen?

Since it's not based on anything at all, very very unlikely.
4 likes   

Ubercast
Tropical Wave
Tropical Wave
Posts: 5
Joined: Fri Sep 07, 2018 6:13 am

Re: 2020 Indicators: SST's / SAL / MSLP / Steering / Shear / Instability / Sat Images

#2519 Postby Ubercast » Sat Aug 15, 2020 1:07 pm

Visioen wrote:
Ubercast wrote:
MetroMike wrote:
We shall see if the favorable MJO wave actually makes it into the Atl. Basin or becomes a suppressed Kelvin wave.


I haven’t heard this said before, but how likely is this to happen?

Since it's not based on anything at all, very very unlikely.

Thank you for answering, I know it might be a stupid question, but I have a limited base of knowledge to work from. I’m still trying to learn.
2 likes   

psyclone
S2K Supporter
S2K Supporter
Posts: 4760
Joined: Wed Aug 24, 2005 9:04 pm
Location: palm harbor fl

Re: 2020 Indicators: SST's / SAL / MSLP / Steering / Shear / Instability / Sat Images

#2520 Postby psyclone » Sat Aug 15, 2020 2:52 pm

With the Caribbean looking much more favorable this year, we should be deriving no comfort in a potential (and likely transient) episode of toughing over the eastern US. Such a pattern could easily coax chicanery out of that region and toward the Gulf region or southeast coast where stupidly warm seas await. I'm hearing plenty about crickets on the GFS. But should we believe such a scenario? Weather is really about painting a canvas in probabilistic pastels (buttressed by facts and solid reasoning) rather than thinking in extreme (but unlikely) solutions. Is it possible? Sure. Anything is possible. But is it more likely knowing what we know about climo, seasonality and reasonable expectations of what should happen? I would respectfully submit the answer is no. That doesn't mean we ignore the output. But it does mean we subject it to reasonable scrutiny and a recognition that we may have traded one bias (early season phantoms) for another (peak season nada). Weather plays tricks on all of us, amateurs and pros alike. We are never far from a humbling. Look at what just happened a few days ago with the epic derecho in Iowa...one of the most powerful on record. The SPC outlook the night before was painted with the lowest risk (5% marginal) out there. People had no idea what was about to hit them...including the pros. If the pros can get hoodwinked by mother nature...we all can. I suspect the seedling for our first major hurricane is on the map right now...we're just not quite sure which one it is.
15 likes   


Return to “Talkin' Tropics”

Who is online

Users browsing this forum: No registered users and 27 guests