I'll repost what was truncated in the move from the models thread to here...
Storms in the early and pre-season often serve as bellwethers for the conditions where they develop, but I doubt that the May development really gives us many clues for the season. Personally I think trying to connect early season activity to peak season activity is an exercise that can easily fall into the trap of cherry picking. Generally, it's preferable to connect broader scale phenomena (sea surface temperature patterns, placement of troughs and ridges, etc.) to seasonal activity because at least in that case we can theorize some sort of physical connection. It's hard to say what exactly an isolated event in May off the Southeastern U.S. coast has on East Coast troughing in September (besides, if it ends up being a 1008mb naked swirl of a tropical depression, did it really make that much of an impact?). All it really gives us is a measure of the conditions in that particular area at that time. The broader patterns and trends would probably be more predictive of what would happen over the course of the season.
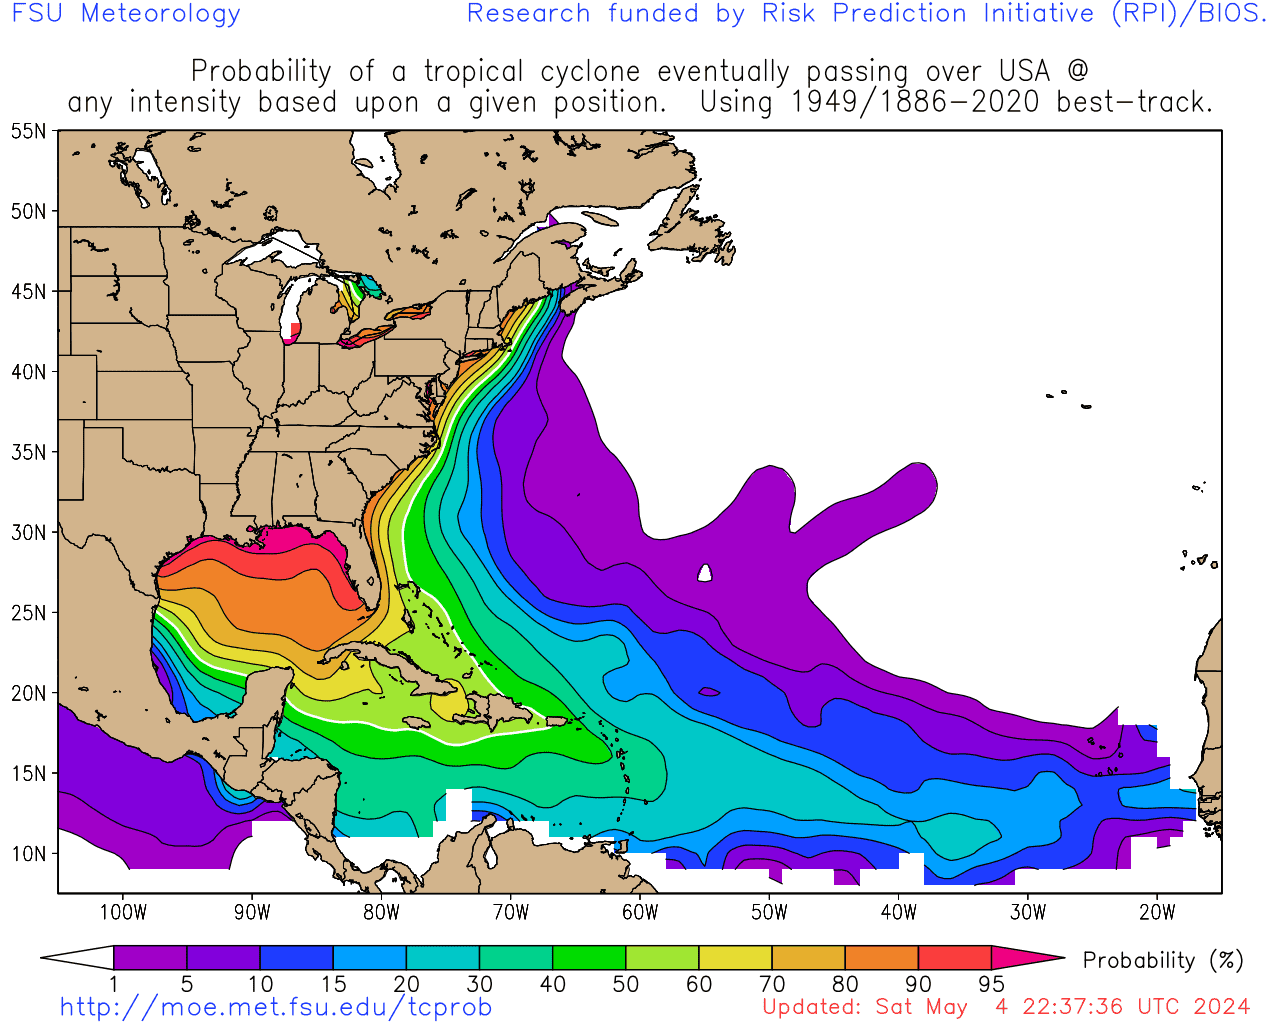
On the note about storms curving out to sea east of the U.S. east coast, it's also important to note that regardless, just by climatology only about 10-30% of storms east of the Lesser Antilles even hit the mainland United States (82 KB). Recurvatures are the norm.
2020 Indicators: SST's / SAL / MSLP / Steering / Shear / Instability / Sat Images
Moderator: S2k Moderators
Forum rules

The posts in this forum are NOT official forecasts and should not be used as such. They are just the opinion of the poster and may or may not be backed by sound meteorological data. They are NOT endorsed by any professional institution or STORM2K. For official information, please refer to products from the National Hurricane Center and National Weather Service.
-
TheAustinMan

- Category 5

- Posts: 1060
- Joined: Mon Jul 08, 2013 4:26 pm
- Location: Central TX / United States
Re: 2020 Indicators: SST's / SAL / MSLP / Steering / Shear / Instability / Sat Images
3 likes
Treat my opinions with a grain of salt. For official information see your local weather service.
“It's tough to make predictions, especially about the future.”
“It's tough to make predictions, especially about the future.”
-
toad strangler

- S2K Supporter

- Posts: 4546
- Joined: Sun Jul 28, 2013 3:09 pm
- Location: Earth
- Contact:
Re: 2020 Indicators: SST's / SAL / MSLP / Steering / Shear / Instability / Sat Images
The type of track being discussed just off of the SE US coast and out to the NE is pretty much a normal look for June and even July. It happening a couple weeks early is insignificant IMO. I put no weight on a climo early season track as being a harbinger of what is in store for the season. With that said, recurves away from the US mainland are the norm most years unless some anomalous steering patterns set up.
1 likes
My Weather Station
https://www.wunderground.com/dashboard/pws/KFLPORTS603
https://www.wunderground.com/dashboard/pws/KFLPORTS603
-
Hypercane_Kyle

- Category 5
- Posts: 3465
- Joined: Sat Mar 07, 2015 7:58 pm
- Location: Cape Canaveral, FL
Re: 2020 Indicators: SST's / SAL / MSLP / Steering / Shear / Instability / Sat Images
FYI - I do not recall a year in the last five or so where the ECMWF hasn't called for below normal precipitation in the Atlantic, including 2017.
2 likes
My posts are my own personal opinion, defer to the National Hurricane Center (NHC) and other NOAA products for decision making during hurricane season.
-
CyclonicFury

- Category 5
- Posts: 2033
- Age: 27
- Joined: Sun Jul 02, 2017 12:32 pm
- Location: NC
- Contact:
Re: 2020 Indicators: SST's / SAL / MSLP / Steering / Shear / Instability / Sat Images
The ECMWF seasonal is predicting approximately 11 tropical storms, 6 hurricanes and ~80 ACE for the Atlantic from June-November. This model has consistently under forecast Atlantic TC activity since 2016. These charts are now available to the public for free on the ECMWF website.


6 likes
NCSU B.S. in Meteorology Class of 2021. Tropical weather blogger at http://www.cyclonicfury.com. My forecasts and thoughts are NOT official, for official forecasts please consult the National Hurricane Center.
-
Shell Mound
- Category 5
- Posts: 2432
- Age: 33
- Joined: Thu Sep 07, 2017 3:39 pm
- Location: St. Petersburg, FL → Scandinavia
Re: 2020 Indicators: SST's / SAL / MSLP / Steering / Shear / Instability / Sat Images
Shell Mound wrote:If this system offshore the SE US were to transpire, it could offer clues as to the rest of the year. Years that featured a similar development and track in the month of May include 1908, 1940, and 1948. Most of the storms in these seasons curved OTS east of the mainland U.S., though some clustered over Central America, TX/LA, and the Carolinas. So these areas might be at highest risk in 2020, based on the ECMWF’s latest run. Of course, first we need to see whether such a system as depicted actually evolves over or near the Bahamas around 20 May.
To add to this: since 1851, the following years featured at least one (S)TS formation over the Southwestern North Atlantic in the month of May—1862, 1887, 1889, 1908, 1951, 1954, 1958, 1997, 2007, 2012, 2015, 2016, and 2019. Collectively, these seasons went on to produce a total of twenty-seven major hurricanes. Of these twenty-seven major hurricanes, only two went on to strike the mainland U.S.: Carol and Hazel (1954). The rest of the major hurricanes either a) curved offshore or b) continued westward over the Caribbean Sea to strike the Yucatán Peninsula. Since Arthur seems likely to form over the Southwestern North Atlantic shortly, history seems to signal rather strongly that the mainland U.S. may be at low risk of a major hurricane in 2020, regardless of how active the season is in terms of named storms or ACE. The steering currents in the years listed above heavily favoured offshore tracks and/or Yucatán impacts rather than MH landfalls on the mainland U.S.
0 likes
CVW / MiamiensisWx / Shell Mound
The posts in this forum are NOT official forecasts and should not be used as such. They are just the opinion of the poster and may or may not be backed by sound meteorological data. They are NOT endorsed by any professional institution or STORM2K. For official information, please refer to products from the NHC and NWS.
-
CyclonicFury
- Category 5
- Posts: 2033
- Age: 27
- Joined: Sun Jul 02, 2017 12:32 pm
- Location: NC
- Contact:
Re: 2020 Indicators: SST's / SAL / MSLP / Steering / Shear / Instability / Sat Images
Shell Mound wrote:Shell Mound wrote:If this system offshore the SE US were to transpire, it could offer clues as to the rest of the year. Years that featured a similar development and track in the month of May include 1908, 1940, and 1948. Most of the storms in these seasons curved OTS east of the mainland U.S., though some clustered over Central America, TX/LA, and the Carolinas. So these areas might be at highest risk in 2020, based on the ECMWF’s latest run. Of course, first we need to see whether such a system as depicted actually evolves over or near the Bahamas around 20 May.
To add to this: since 1851, the following years featured at least one (S)TS formation over the Southwestern North Atlantic in the month of May—1862, 1887, 1889, 1908, 1951, 1954, 1958, 1997, 2007, 2012, 2015, 2016, and 2019. Collectively, these seasons went on to produce a total of twenty-seven major hurricanes. Of these twenty-seven major hurricanes, only two went on to strike the mainland U.S.: Carol and Hazel (1954). The rest of the major hurricanes either a) curved offshore or b) continued westward over the Caribbean Sea to strike the Yucatán Peninsula. Since Arthur seems likely to form over the Southwestern North Atlantic shortly, history seems to signal rather strongly that the mainland U.S. may be at low risk of a major hurricane in 2020, regardless of how active the season is in terms of named storms or ACE. The steering currents in the years listed above heavily favoured offshore tracks and/or Yucatán impacts rather than MH landfalls on the mainland U.S.
Correlation =/= causation. To be honest, I don't think you can make judgments about what will happen during the peak of the season based on what happens in May. In addition, that sample size is not very large. The truth is, we do not know what the steering patterns will be like during the peak of the season yet.
6 likes
NCSU B.S. in Meteorology Class of 2021. Tropical weather blogger at http://www.cyclonicfury.com. My forecasts and thoughts are NOT official, for official forecasts please consult the National Hurricane Center.
-
TheStormExpert
Re: 2020 Indicators: SST's / SAL / MSLP / Steering / Shear / Instability / Sat Images
Shell Mound wrote:Shell Mound wrote:If this system offshore the SE US were to transpire, it could offer clues as to the rest of the year. Years that featured a similar development and track in the month of May include 1908, 1940, and 1948. Most of the storms in these seasons curved OTS east of the mainland U.S., though some clustered over Central America, TX/LA, and the Carolinas. So these areas might be at highest risk in 2020, based on the ECMWF’s latest run. Of course, first we need to see whether such a system as depicted actually evolves over or near the Bahamas around 20 May.
To add to this: since 1851, the following years featured at least one (S)TS formation over the Southwestern North Atlantic in the month of May—1862, 1887, 1889, 1908, 1951, 1954, 1958, 1997, 2007, 2012, 2015, 2016, and 2019. Collectively, these seasons went on to produce a total of twenty-seven major hurricanes. Of these twenty-seven major hurricanes, only two went on to strike the mainland U.S.: Carol and Hazel (1954). The rest of the major hurricanes either a) curved offshore or b) continued westward over the Caribbean Sea to strike the Yucatán Peninsula. Since Arthur seems likely to form over the Southwestern North Atlantic shortly, history seems to signal rather strongly that the mainland U.S. may be at low risk of a major hurricane in 2020, regardless of how active the season is in terms of named storms or ACE. The steering currents in the years listed above heavily favoured offshore tracks and/or Yucatán impacts rather than MH landfalls on the mainland U.S.
You’re not making a valid point. 2012, 2016, and 2019 all featured at least a major threat come close if not make landfall in the U.S. Sandy in 2012, Matthew in 2016, and Dorian in 2019. You can’t just assume that the current 500mb steering pattern will remain all the way till August and September, cause it won’t. Take 2004 as a perfect a perfect example like I said before. August 2004 featured a persistent East Coast trough, while September 2004 featured a persistent East Coast ridge. This helped Charley turn NE into SW Florida in mid-August, while also allowing both Frances and Jeanne to make landfall in the exact same location on the East Coast of Florida several weeks later.
11 likes
-
SFLcane

- S2K Supporter
- Posts: 10281
- Age: 48
- Joined: Sat Jun 05, 2010 1:44 pm
- Location: Lake Worth Florida
Re: 2020 Indicators: SST's / SAL / MSLP / Steering / Shear / Instability / Sat Images
CyclonicFury wrote:Shell Mound wrote:Shell Mound wrote:If this system offshore the SE US were to transpire, it could offer clues as to the rest of the year. Years that featured a similar development and track in the month of May include 1908, 1940, and 1948. Most of the storms in these seasons curved OTS east of the mainland U.S., though some clustered over Central America, TX/LA, and the Carolinas. So these areas might be at highest risk in 2020, based on the ECMWF’s latest run. Of course, first we need to see whether such a system as depicted actually evolves over or near the Bahamas around 20 May.
To add to this: since 1851, the following years featured at least one (S)TS formation over the Southwestern North Atlantic in the month of May—1862, 1887, 1889, 1908, 1951, 1954, 1958, 1997, 2007, 2012, 2015, 2016, and 2019. Collectively, these seasons went on to produce a total of twenty-seven major hurricanes. Of these twenty-seven major hurricanes, only two went on to strike the mainland U.S.: Carol and Hazel (1954). The rest of the major hurricanes either a) curved offshore or b) continued westward over the Caribbean Sea to strike the Yucatán Peninsula. Since Arthur seems likely to form over the Southwestern North Atlantic shortly, history seems to signal rather strongly that the mainland U.S. may be at low risk of a major hurricane in 2020, regardless of how active the season is in terms of named storms or ACE. The steering currents in the years listed above heavily favoured offshore tracks and/or Yucatán impacts rather than MH landfalls on the mainland U.S.
Correlation =/= causation. To be honest, I don't think you can make judgments about what will happen during the peak of the season based on what happens in May. In addition, that sample size is not very large. The truth is, we do not know what the steering patterns will be like during the peak of the season yet.
We don’t know what there like next week.
1 likes

Re: 2020 Indicators: SST's / SAL / MSLP / Steering / Shear / Instability / Sat Images
a day or two into MJO Phase 2 and we have a slowly developing sts near south Florida and flooding in SE TX and SE LA. Some of the last several years have featured MJO predictive seasons. Maybe we will see this again a few times in 2020 since it’s tipping its hand already in mid May.
2 likes

Re: 2020 Indicators: SST's / SAL / MSLP / Steering / Shear / Instability / Sat Images
Steve wrote:a day or two into MJO Phase 2 and we have a slowly developing sts near south Florida and flooding in SE TX and SE LA. Some of the last several years have featured MJO predictive seasons. Maybe we will see this again a few times in 2020 since it’s tipping its hand already in mid May.
How's it going Steve? I think you have an interesting point there.
1 likes
Andy D
(For official information, please refer to the NHC and NWS products.)
(For official information, please refer to the NHC and NWS products.)
Re: 2020 Indicators: SST's / SAL / MSLP / Steering / Shear / Instability / Sat Images
Hey chaser. Good to see you. I hope everyone else from seasons past are still ticking. It seems like there are some seasons where the MJO is almost a clockwork signal for a rise in activity. We've all seen where everything was dead and boom, all of the sudden a day or two later, any clusters in the tropics or even onshore in the southeast are swirls. Sometimes that can be the result of Kelvin Waves moving across. Sometimes activity comes in the form of natural processes like a westward moving wave intersecting with a surface trough. Sometimes a front comes down and gains a spin. But sometimes you can telegraph likely storm formation due to amplification and forcing as the MJO rotates into the favorable zones - can be 8, 1, 2 and 3. 2 and 3 are usually some of the worst impacts for the U.S. Some years, the signal is weak or just stays in the circle. Maybe some years have really strong ENSO signals or other factors that are slightly higher compared to normal that control what's happening. I'm not a scientist and haven't looked at the data except anecdotally. But I'd suspect in weaker El Ninos and La Ninas and certainly in some of the neutral seasons (again absent other overly strong global signals), where the MJO does make its presence known, you can use it pretty often to predict genesis. The models aren't always right. Sometimes they say the sequence will move into one of the favorable phases, but it doesn't happen. But often when it does, you know to at least look for activity. Last year, 2018 and I think 2016 were some of the years where some of the genesis happened on cue. It's only a tool of course, but Bastardi (among others) based the majority of Weatherbell's forecast for an extreme season on his belief that we would have many instances of MJO in 2 & 3 this season. Of course as we said when he released the forecast, he bombed on that same prediction for the winter where MJO averaged in Phase 6 which is the warmest winter signal there is for the US. I'm sure that there are better charts of this, but I usually use the CPC's dynamical model display. You can easily see that MJO moved into Phase 2 yesterday or the day before and will spike down into it before moving rotating up. And lo and behold, we'll likely have STS Arthur tomorrow.
https://www.cpc.ncep.noaa.gov/products/ ... r_wh.shtml
https://www.cpc.ncep.noaa.gov/products/ ... r_wh.shtml
4 likes
-
Shell Mound
- Category 5
- Posts: 2432
- Age: 33
- Joined: Thu Sep 07, 2017 3:39 pm
- Location: St. Petersburg, FL → Scandinavia
Re: 2020 Indicators: SST's / SAL / MSLP / Steering / Shear / Instability / Sat Images
Discussion lifted from the seasonal poll:
I think that the MDR, on balance, will continue to cool down between now and ASO, owing in part to a strengthening +NAO regime by then. The recent -NAO did nothing to warm up the MDR to its previous levels that existed prior to the recent sharp drop in SST anomalies over the past several weeks. When the NAO returns to its positive state, sharp cooling will likely resume. Combined with the other factors mentioned in my post above, I found the evidence sufficiently persuasive to significantly reduce my numbers. Most importantly, however, the expected pattern in ASO will strongly discourage landfalls, especially major-hurricane landfalls, in the U.S. and Caribbean. (Again, this not an official forecast; please seek professional meteorologists for those.)
CyclonicFury wrote:Shell Mound wrote:Numbers: 12 NS / 4 H / 2 MH
ACE: 100
(FINAL – #11 on the list)
Reasoning:
- Despite neutral ENSO, +NAO will suppress activity due to strong easterlies and higher MSLP, hence cooler MDR
- +PMM and near-neutral PDO will enhance EPAC convection, thus shearing the Caribbean, working with +NAO to strengthen TUTT
- Of the storms that do form, most will strengthen over the subtropics and curve out to sea, given Bermuda High farther northeast than normal
Analogs: 1951, 2012, and 2013.
Why do you think 2020 will be less active than 2018/19, despite a warmer MDR and cooler ENSO than those years? Also, that's a huge drop from your previous record-breaking 260 ACE prediction.
I think that the MDR, on balance, will continue to cool down between now and ASO, owing in part to a strengthening +NAO regime by then. The recent -NAO did nothing to warm up the MDR to its previous levels that existed prior to the recent sharp drop in SST anomalies over the past several weeks. When the NAO returns to its positive state, sharp cooling will likely resume. Combined with the other factors mentioned in my post above, I found the evidence sufficiently persuasive to significantly reduce my numbers. Most importantly, however, the expected pattern in ASO will strongly discourage landfalls, especially major-hurricane landfalls, in the U.S. and Caribbean. (Again, this not an official forecast; please seek professional meteorologists for those.)
0 likes
CVW / MiamiensisWx / Shell Mound
The posts in this forum are NOT official forecasts and should not be used as such. They are just the opinion of the poster and may or may not be backed by sound meteorological data. They are NOT endorsed by any professional institution or STORM2K. For official information, please refer to products from the NHC and NWS.
-
Shell Mound
- Category 5
- Posts: 2432
- Age: 33
- Joined: Thu Sep 07, 2017 3:39 pm
- Location: St. Petersburg, FL → Scandinavia
Re: 2020 Indicators: SST's / SAL / MSLP / Steering / Shear / Instability / Sat Images
CyclonicFury wrote:Shell Mound wrote:Shell Mound wrote:If this system offshore the SE US were to transpire, it could offer clues as to the rest of the year. Years that featured a similar development and track in the month of May include 1908, 1940, and 1948. Most of the storms in these seasons curved OTS east of the mainland U.S., though some clustered over Central America, TX/LA, and the Carolinas. So these areas might be at highest risk in 2020, based on the ECMWF’s latest run. Of course, first we need to see whether such a system as depicted actually evolves over or near the Bahamas around 20 May.
To add to this: since 1851, the following years featured at least one (S)TS formation over the Southwestern North Atlantic in the month of May—1862, 1887, 1889, 1908, 1951, 1954, 1958, 1997, 2007, 2012, 2015, 2016, and 2019. Collectively, these seasons went on to produce a total of twenty-seven major hurricanes. Of these twenty-seven major hurricanes, only two went on to strike the mainland U.S.: Carol and Hazel (1954). The rest of the major hurricanes either a) curved offshore or b) continued westward over the Caribbean Sea to strike the Yucatán Peninsula. Since Arthur seems likely to form over the Southwestern North Atlantic shortly, history seems to signal rather strongly that the mainland U.S. may be at low risk of a major hurricane in 2020, regardless of how active the season is in terms of named storms or ACE. The steering currents in the years listed above heavily favoured offshore tracks and/or Yucatán impacts rather than MH landfalls on the mainland U.S.
Correlation =/= causation. To be honest, I don't think you can make judgments about what will happen during the peak of the season based on what happens in May. In addition, that sample size is not very large. The truth is, we do not know what the steering patterns will be like during the peak of the season yet.
I looked at and listed all the years going back to 1851 that featured at least one (S)TS formation over the Southwestern North Atlantic in the month of May. The sample size seems sufficiently large to me. Additionally, I have examined many seasons and concluded, in line with some meteorologists elsewhere, that the track of the first (sub-)tropical storm of the season often provides a good initial indicator as to the eventual predominant steering currents’ positions and intensities during the peak months of ASO. Currently, based on the formative location and likely track of prospective TS Arthur, the early signs portend good news not just for the mainland U.S., but also the Caribbean, given the likelihood of a +NAO and strong TUTT as well as a Bermuda High displaced to the north and east of its typical location.
0 likes
CVW / MiamiensisWx / Shell Mound
The posts in this forum are NOT official forecasts and should not be used as such. They are just the opinion of the poster and may or may not be backed by sound meteorological data. They are NOT endorsed by any professional institution or STORM2K. For official information, please refer to products from the NHC and NWS.
-
toad strangler
- S2K Supporter
- Posts: 4546
- Joined: Sun Jul 28, 2013 3:09 pm
- Location: Earth
- Contact:
Re: 2020 Indicators: SST's / SAL / MSLP / Steering / Shear / Instability / Sat Images
Shell Mound wrote:CyclonicFury wrote:Shell Mound wrote:To add to this: since 1851, the following years featured at least one (S)TS formation over the Southwestern North Atlantic in the month of May—1862, 1887, 1889, 1908, 1951, 1954, 1958, 1997, 2007, 2012, 2015, 2016, and 2019. Collectively, these seasons went on to produce a total of twenty-seven major hurricanes. Of these twenty-seven major hurricanes, only two went on to strike the mainland U.S.: Carol and Hazel (1954). The rest of the major hurricanes either a) curved offshore or b) continued westward over the Caribbean Sea to strike the Yucatán Peninsula. Since Arthur seems likely to form over the Southwestern North Atlantic shortly, history seems to signal rather strongly that the mainland U.S. may be at low risk of a major hurricane in 2020, regardless of how active the season is in terms of named storms or ACE. The steering currents in the years listed above heavily favoured offshore tracks and/or Yucatán impacts rather than MH landfalls on the mainland U.S.
Correlation =/= causation. To be honest, I don't think you can make judgments about what will happen during the peak of the season based on what happens in May. In addition, that sample size is not very large. The truth is, we do not know what the steering patterns will be like during the peak of the season yet.
I looked at and listed all the years going back to 1851 that featured at least one (S)TS formation over the Southwestern North Atlantic in the month of May. The sample size seems sufficiently large to me. Additionally, I have examined many seasons and concluded, in line with some meteorologists elsewhere, that the track of the first (sub-)tropical storm of the season often provides a good initial indicator as to the eventual predominant steering currents’ positions and intensities during the peak months of ASO. Currently, based on the formative location and likely track of prospective TS Arthur, the early signs portend good news not just for the mainland U.S., but also the Caribbean, given the likelihood of a +NAO and strong TUTT as well as a Bermuda High displaced to the north and east of its typical location.
Who are these meteorologists that concur with early season systems being a clue to future steering? This makes no sense to me but of course I respect your thoughts even though I see no cohesive point. It isn't exactly going out on a limb to favor OTS re-curving storm tracks as said so many times recently, it is historic Atlantic Basin climatology to see that. You have confused me recently. Just the other day you were talking about a possible elongated Bermuda High that could push storms further west and be more of a threat to either MX or the US. In the end I hope you are right. Nobody wants to see multiple land-falling storms and especially this year. I just can't get hooked up with your reasoning.
5 likes
My Weather Station
https://www.wunderground.com/dashboard/pws/KFLPORTS603
https://www.wunderground.com/dashboard/pws/KFLPORTS603
-
TheStormExpert
Re: 2020 Indicators: SST's / SAL / MSLP / Steering / Shear / Instability / Sat Images
toad strangler wrote:Shell Mound wrote:CyclonicFury wrote:Correlation =/= causation. To be honest, I don't think you can make judgments about what will happen during the peak of the season based on what happens in May. In addition, that sample size is not very large. The truth is, we do not know what the steering patterns will be like during the peak of the season yet.
I looked at and listed all the years going back to 1851 that featured at least one (S)TS formation over the Southwestern North Atlantic in the month of May. The sample size seems sufficiently large to me. Additionally, I have examined many seasons and concluded, in line with some meteorologists elsewhere, that the track of the first (sub-)tropical storm of the season often provides a good initial indicator as to the eventual predominant steering currents’ positions and intensities during the peak months of ASO. Currently, based on the formative location and likely track of prospective TS Arthur, the early signs portend good news not just for the mainland U.S., but also the Caribbean, given the likelihood of a +NAO and strong TUTT as well as a Bermuda High displaced to the north and east of its typical location.
Who are these meteorologists that concur with early season systems being a clue to future steering? This makes no sense to me but of course I respect your thoughts even though I see no cohesive point. It isn't exactly going out on a limb to favor OTS re-curving storm tracks as said so many times recently, it is historic Atlantic Basin climatology to see that. You have confused me recently. Just the other day you were talking about a possible elongated Bermuda High that could push storms further west and be more of a threat to either MX or the US. In the end I hope you are right. Nobody wants to see multiple land-falling storms and especially this year. I just can't get hooked up with your reasoning.
I’ve been noticing the same with him too toad strangler. There’s no consistent reasoning in his assumptions.
1 likes
-
Kingarabian

- S2K Supporter
- Posts: 16359
- Joined: Sat Aug 08, 2009 3:06 am
- Location: Honolulu, Hawaii
Re: 2020 Indicators: SST's / SAL / MSLP / Steering / Shear / Instability / Sat Images
Could see our 2nd ATL system around the first week of June with a CCKW forecast to pass through the region.
4 likes
RIP Kobe Bryant
-
USTropics
- Professional-Met

- Posts: 2738
- Joined: Sun Aug 12, 2007 3:45 am
- Location: Florida State University
Re: 2020 Indicators: SST's / SAL / MSLP / Steering / Shear / Instability / Sat Images
Climatology really dictates where May storms form/move; there isn't any definitive correlation between tracks in May and peak season (origination isn't even the same). There's a considerable transition between seasons (Boreal spring - summer) that influences large scale synoptic steering patterns as we head into July/August. If we historically look at May systems, their origination can be distinguished by two camps: (1) frontal boundaries that sweep through the GOM/EC or (2) intraseasonal CAG that develops in the Caribbean mid May-June.

Alberto (2018 - developed from CAG) hit the NGOM, but besides Michael, everything else was east based:

Ana (2015 - developed from frontal system), made landfall in North Carolina. There was only one more landfall that entire season:

Alberto (2012 - developed from frontal boundary) and Beryl (2012 - originated from CAG in WGOM before drifting eastward, made landfall in FL). That season was spread out considerably:

Arthur (2008 - CAG development), Andrea (2007 - developed from frontal boundary), and Barry (2007 - CAG development) had activity spread out:

Arlene (1981 - developed from CAG) originated in Caribbean, but tracks are heavily focused on MDR:

Alma (1970 - developed into a Hurricane from CAG), made landfall in FL, activity is spread out:

Arlene (1959 - originated from CAG) made landfall in NGOM, activity is spread out:

Alice (1953 - originated from CAG) made landfall in NGOM, activity is spread out:

Able (1951 - originated from frontal boundary) EC recurve hurricane, rest of season is spread out:

Alberto (2018 - developed from CAG) hit the NGOM, but besides Michael, everything else was east based:
Ana (2015 - developed from frontal system), made landfall in North Carolina. There was only one more landfall that entire season:
Alberto (2012 - developed from frontal boundary) and Beryl (2012 - originated from CAG in WGOM before drifting eastward, made landfall in FL). That season was spread out considerably:
Arthur (2008 - CAG development), Andrea (2007 - developed from frontal boundary), and Barry (2007 - CAG development) had activity spread out:
Arlene (1981 - developed from CAG) originated in Caribbean, but tracks are heavily focused on MDR:
Alma (1970 - developed into a Hurricane from CAG), made landfall in FL, activity is spread out:
Arlene (1959 - originated from CAG) made landfall in NGOM, activity is spread out:
Alice (1953 - originated from CAG) made landfall in NGOM, activity is spread out:
Able (1951 - originated from frontal boundary) EC recurve hurricane, rest of season is spread out:
7 likes
-
SFLcane
- S2K Supporter
- Posts: 10281
- Age: 48
- Joined: Sat Jun 05, 2010 1:44 pm
- Location: Lake Worth Florida
Re: 2020 Indicators: SST's / SAL / MSLP / Steering / Shear / Instability / Sat Images
USTropics wrote:Climatology really dictates where May storms form/move; there isn't any definitive correlation between tracks in May and peak season (origination isn't even the same). There's a considerable transition between seasons (Boreal spring - summer) that influences large scale synoptic steering patterns as we head into July/August. If we historically look at May systems, their origination can be distinguished by two camps: (1) frontal boundaries that sweep through the GOM/EC or (2) intraseasonal CAG that develops in the Caribbean mid May-June.
https://i.imgur.com/c6FMSqH.png
Alberto (2018 - developed from CAG) hit the NGOM, but besides Michael, everything else was east based:
https://i.imgur.com/ZVmylFe.png
Ana (2015 - developed from frontal system), made landfall in North Carolina. There was only one more landfall that entire season:
https://i.imgur.com/SenGYaI.png
Alberto (2012 - developed from frontal boundary) and Beryl (2012 - originated from CAG in WGOM before drifting eastward, made landfall in FL). That season was spread out considerably:
https://i.imgur.com/rPqu5PY.png
Arthur (2008 - CAG development), Andrea (2007 - developed from frontal boundary), and Barry (2007 - CAG development) had activity spread out:
https://i.imgur.com/l87MHVu.png
Arlene (1981 - developed from CAG) originated in Caribbean, but tracks are heavily focused on MDR:
https://i.imgur.com/onpu6PC.png
Alma (1970 - developed into a Hurricane from CAG), made landfall in FL, activity is spread out:
https://i.imgur.com/7GFP3lh.png
Arlene (1959 - originated from CAG) made landfall in NGOM, activity is spread out:
https://i.imgur.com/ySRsSg3.png
Alice (1953 - originated from CAG) made landfall in NGOM, activity is spread out:
https://i.imgur.com/MeWY3vN.png
Able (1951 - originated from frontal boundary) EC recurve hurricane, rest of season is spread out:
https://i.imgur.com/LfQiDo5.png
Drop the mic...
0 likes
-
toad strangler
- S2K Supporter
- Posts: 4546
- Joined: Sun Jul 28, 2013 3:09 pm
- Location: Earth
- Contact:
Who is online
Users browsing this forum: Hammy, Vince_and_Grace_fan, wwizard and 171 guests