2018 Indicators: SST's / MSLP / Sal / Steering / Shear / Instability (Graphic updates at first post)

This is the general tropical discussion area. Anyone can take their shot at predicting a storms path.

Moderator: S2k Moderators

Forum rules

The posts in this forum are NOT official forecasts and should not be used as such. They are just the opinion of the poster and may or may not be backed by sound meteorological data. They are NOT endorsed by any professional institution or STORM2K. For official information, please refer to products from the National Hurricane Center and National Weather Service.

Help Support Storm2K
Message
Author
Eric Webb
Tropical Storm
Tropical Storm
Posts: 154
Joined: Fri Mar 13, 2015 10:42 pm
Contact:

Re: 2018 Indicators: SST's / MSLP / Sal / Steering / Shear / Instability (Graphic updates at first post)

#681 Postby Eric Webb » Wed Jul 25, 2018 11:04 am

HurricaneEnzo wrote:
Eric Webb wrote:You can get the hint that the 3 sigma CCKW passing over the Atlantic has reached west Africa.

Image


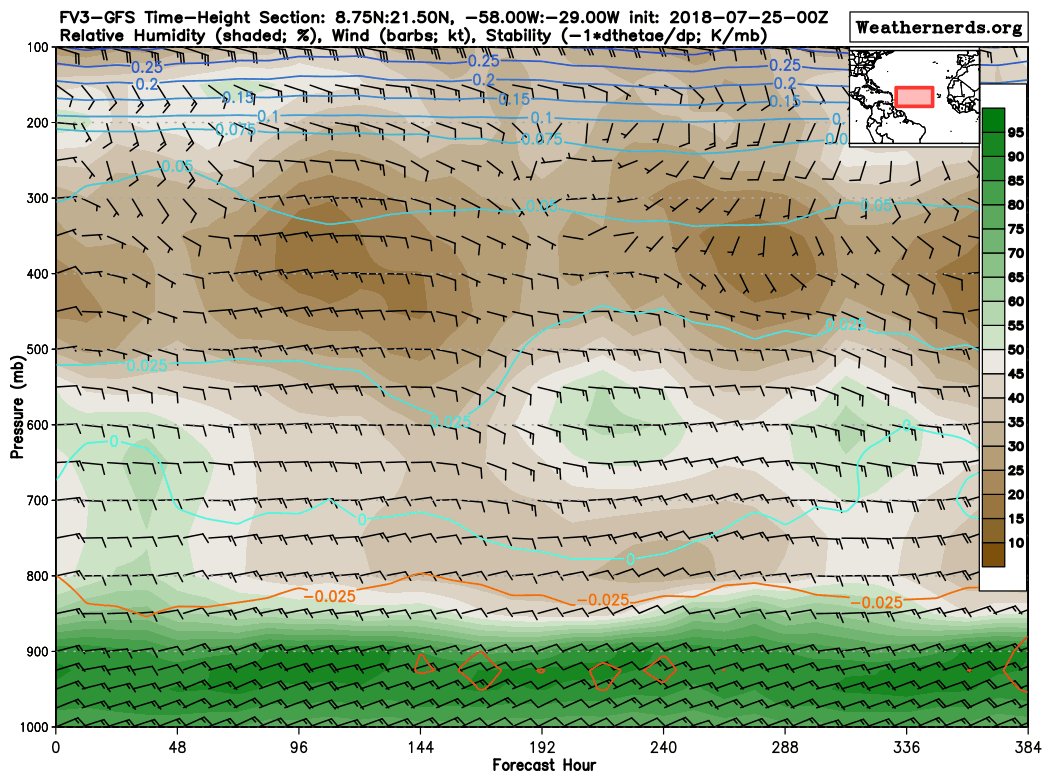
On a somewhat related note, I really like this vertical cross section forecast plot from wxnerds. You can see the CCKW influence helping to moisten the MDR for the first few days of the forecast period then a subsequent dry period once it passes and then moistening near the level of the AEJ (~600-700 hPa) as AEWs triggered by the CCKW propagate into the Atlantic the following week.

Image


Wow is that top image accurate or something wrong with the satellite? I don't know that I've ever seen that much convection over Africa like that lol.


West Africa is near the edge of the of the GOES-16 satellite's field of view and thus will appear smeared and what you're also seeing is a parallax error wherein the shape, orientation, and position of an object may be misplaced or skewed when viewed not from directly above as in the case of GOES-16.
3 likes   

User avatar
Kingarabian
S2K Supporter
S2K Supporter
Posts: 15462
Joined: Sat Aug 08, 2009 3:06 am
Location: Honolulu, Hawaii

Re: 2018 Indicators: SST's / MSLP / Sal / Steering / Shear / Instability (Graphic updates at first post)

#682 Postby Kingarabian » Wed Jul 25, 2018 12:11 pm

Eric Webb wrote:
Ntxw wrote:That'll bring me to the same question as the prior poster. What is causing then of the recent drop? Perhaps erroneous satellite data?


It's possible there's some error in data assimilation or noisy satellite data (data assimilation is in the CDAS acronym after all), I just have a hard time believing the MDR could have cooled almost 1C with near average trades and relatively more modest SAL in just a matter of a few days, the cumulative effect of stronger trades in July, a cold subsurface, and some SAL when the MDR is already cold certainly doesn't help and could explain some of this drop but it's so extreme in such a short period of time I'm personally skeptical it's actually real.

[img]https://www.tropicaltidbits.com/analysis/ocean/mdrssta.png[/
img]


[img]http://www.atmos.albany.edu/student/ventrice/real_time/timeLon/u.anom.30.10N-20N.gif[/ig]


We've dealt with erroneous CDAS data before in the ENSO thread. Itll likely adjust back up in a day or so when it re-adjusts. Too bad we dont have buoys in the ATL MDR to see what's really going like we do in the Pacific.
3 likes   
RIP Kobe Bryant

User avatar
NotSparta
Professional-Met
Professional-Met
Posts: 1660
Age: 22
Joined: Fri Aug 18, 2017 8:24 am
Location: Naples, FL
Contact:

Re: 2018 Indicators: SST's / MSLP / Sal / Steering / Shear / Instability (Graphic updates at first post)

#683 Postby NotSparta » Wed Jul 25, 2018 12:16 pm

Kingarabian wrote:
Eric Webb wrote:
Ntxw wrote:That'll bring me to the same question as the prior poster. What is causing then of the recent drop? Perhaps erroneous satellite data?


It's possible there's some error in data assimilation or noisy satellite data (data assimilation is in the CDAS acronym after all), I just have a hard time believing the MDR could have cooled almost 1C with near average trades and relatively more modest SAL in just a matter of a few days, the cumulative effect of stronger trades in July, a cold subsurface, and some SAL when the MDR is already cold certainly doesn't help and could explain some of this drop but it's so extreme in such a short period of time I'm personally skeptical it's actually real.

[img]https://www.tropicaltidbits.com/analysis/ocean/mdrssta.png[/
img]


[img]http://www.atmos.albany.edu/student/ventrice/real_time/timeLon/u.anom.30.10N-20N.gif[/ig]


We've dealt with erroneous CDAS data before in the ENSO thread. Itll likely adjust back up in a day or so when it re-adjusts. Too bad we dont have buoys in the ATL MDR to see what's really going like we do in the Pacific.


There are buoys there, but no maps
0 likes   
This post was probably an opinion of mine, and in no way is official. Please refer to http://www.hurricanes.gov for official tropical analysis and advisories.

My website, with lots of tropical wx graphics, including satellite and recon: http://cyclonicwx.com

User avatar
Kingarabian
S2K Supporter
S2K Supporter
Posts: 15462
Joined: Sat Aug 08, 2009 3:06 am
Location: Honolulu, Hawaii

Re: 2018 Indicators: SST's / MSLP / Sal / Steering / Shear / Instability (Graphic updates at first post)

#684 Postby Kingarabian » Wed Jul 25, 2018 12:30 pm

NotSparta wrote:
Kingarabian wrote:
Eric Webb wrote:
It's possible there's some error in data assimilation or noisy satellite data (data assimilation is in the CDAS acronym after all), I just have a hard time believing the MDR could have cooled almost 1C with near average trades and relatively more modest SAL in just a matter of a few days, the cumulative effect of stronger trades in July, a cold subsurface, and some SAL when the MDR is already cold certainly doesn't help and could explain some of this drop but it's so extreme in such a short period of time I'm personally skeptical it's actually real.

[img]https://www.tropicaltidbits.com/analysis/ocean/mdrssta.png[/
img]


[img]http://www.atmos.albany.edu/student/ventrice/real_time/timeLon/u.anom.30.10N-20N.gif[/ig]


We've dealt with erroneous CDAS data before in the ENSO thread. Itll likely adjust back up in a day or so when it re-adjusts. Too bad we dont have buoys in the ATL MDR to see what's really going like we do in the Pacific.


There are buoys there, but no maps


Do the buoys send out data? If so, we can plot the data ourselves if we can get the outputs.
0 likes   
RIP Kobe Bryant

User avatar
NotSparta
Professional-Met
Professional-Met
Posts: 1660
Age: 22
Joined: Fri Aug 18, 2017 8:24 am
Location: Naples, FL
Contact:

Re: 2018 Indicators: SST's / MSLP / Sal / Steering / Shear / Instability (Graphic updates at first post)

#685 Postby NotSparta » Wed Jul 25, 2018 1:14 pm

Kingarabian wrote:
NotSparta wrote:
Kingarabian wrote:
We've dealt with erroneous CDAS data before in the ENSO thread. Itll likely adjust back up in a day or so when it re-adjusts. Too bad we dont have buoys in the ATL MDR to see what's really going like we do in the Pacific.


There are buoys there, but no maps


Do the buoys send out data? If so, we can plot the data ourselves if we can get the outputs.


I think they're in the same site that has the Pacific buoys, under the "PIRATA" tab. Data can be spotty though
1 likes   
This post was probably an opinion of mine, and in no way is official. Please refer to http://www.hurricanes.gov for official tropical analysis and advisories.

My website, with lots of tropical wx graphics, including satellite and recon: http://cyclonicwx.com

User avatar
Kingarabian
S2K Supporter
S2K Supporter
Posts: 15462
Joined: Sat Aug 08, 2009 3:06 am
Location: Honolulu, Hawaii

Re: 2018 Indicators: SST's / MSLP / Sal / Steering / Shear / Instability (Graphic updates at first post)

#686 Postby Kingarabian » Wed Jul 25, 2018 1:29 pm

NotSparta wrote:
Kingarabian wrote:
NotSparta wrote:
There are buoys there, but no maps


Do the buoys send out data? If so, we can plot the data ourselves if we can get the outputs.


I think they're in the same site that has the Pacific buoys, under the "PIRATA" tab. Data can be spotty though


Just ran through it. Very little buoy data as I was thinking. Just a few locations @ 23W from 0-20N. Oh well.
1 likes   
RIP Kobe Bryant

JPmia
S2K Supporter
S2K Supporter
Posts: 1070
Joined: Thu Jun 03, 2004 11:01 pm
Location: Fort Lauderdale, FL

Re: 2018 Indicators: SST's / MSLP / Sal / Steering / Shear / Instability (Graphic updates at first post)

#687 Postby JPmia » Wed Jul 25, 2018 2:10 pm

Anyone want to start focusing in on predictions for coastal target areas now that we're getting closer to the busy part of the hurricane season? Steering, TUTTs, Areas of Low Shear, ridges, fronts, etc.. what coastal areas have the highest probability of a hit?
4 likes   

User avatar
Ian2401
Category 1
Category 1
Posts: 281
Joined: Thu Sep 14, 2017 5:55 pm
Location: Tallahassee, Florida
Contact:

Re: 2018 Indicators: SST's / MSLP / Sal / Steering / Shear / Instability (Graphic updates at first post)

#688 Postby Ian2401 » Wed Jul 25, 2018 5:45 pm

3 likes   
FSU '24 student pursuing a degree in meteorology. Consult NHC for official information.


User avatar
chaser1
S2K Supporter
S2K Supporter
Posts: 4751
Age: 63
Joined: Sat Oct 15, 2005 5:59 pm
Location: Longwood, Fl

Re: 2018 Indicators: SST's / MSLP / Sal / Steering / Shear / Instability (Graphic updates at first post)

#690 Postby chaser1 » Wed Jul 25, 2018 11:12 pm

stormlover2013 wrote:https://www.wunderground.com/cat6/High-Octane-Hurricane-Fuel-Gulf-Mexico-2-Loop-Current-Eddies


Not sure if others are having similar difficulties but this link keeps coming back as a "dead link".
3 likes   
Personal Forecast Disclaimer:
The posts in this forum are NOT official forecast and should not be used as such. They are just the opinion of the poster and may or may not be backed by sound meteorological data. They are NOT endorsed by any professional institution or storm2k.org. For official information, please refer to the NHC and NWS products.


User avatar
TheStormExpert
Category 5
Category 5
Posts: 8487
Age: 30
Joined: Wed Feb 16, 2011 5:38 pm
Location: Palm Beach Gardens, FL

Re: 2018 Indicators: SST's / MSLP / Sal / Steering / Shear / Instability (Graphic updates at first post)

#691 Postby TheStormExpert » Thu Jul 26, 2018 8:18 am

The NAO may finally go negative in the next 6-10 days according to the Euro Ensembles.

 https://twitter.com/MJVentrice/status/1022469761559658497


0 likes   
The following post is NOT an official forecast and should not be used as such. It is just the opinion of the poster and may or may not be backed by sound meteorological data. It is NOT endorsed by storm2k.org.

User avatar
SoupBone
Category 5
Category 5
Posts: 3073
Joined: Tue Sep 20, 2005 5:24 pm

Re: 2018 Indicators: SST's / MSLP / Sal / Steering / Shear / Instability (Graphic updates at first post)

#692 Postby SoupBone » Thu Jul 26, 2018 11:57 am

TheStormExpert wrote:The NAO may finally go negative in the next 6-10 days according to the Euro Ensembles.


Well this would be crap during peak season, but great for a cold winter for the south (if it hung around). Less recurves and a much greater Gulf Coast threat.

EDIT: Wait, do i have this reversed? - Nao usually means less recurves? I really need a layman's course on the NAO. :lol: I thought a - NAO meant a more sprawled out Bermuda High, meaning more ridge coverage closer to the U.S. meaning less chance of a recurve.
0 likes   
Personal Forecast Disclaimer:
The posts in this forum are NOT official forecast and should not be used as such. They are just the opinion of the poster and may or may not be backed by sound meteorological data. They are NOT endorsed by any professional institution or storm2k.org. For official information, please refer to the NHC and NWS products.

User avatar
CyclonicFury
Category 5
Category 5
Posts: 1977
Age: 25
Joined: Sun Jul 02, 2017 12:32 pm
Location: NC
Contact:

Re: 2018 Indicators: SST's / MSLP / Sal / Steering / Shear / Instability (Graphic updates at first post)

#693 Postby CyclonicFury » Thu Jul 26, 2018 12:30 pm

Today's NOAA/NESDIS SST anomaly map was released. Although it does have a warm bias in the MDR, it shows little change in MDR SSTA within the past 3 days when the CDAS data showed rapid cooling. The rate of cooling in the MDR on CDAS was likely extreme & inaccurate.
3 likes   
NCSU B.S. in Meteorology Class of 2021. Tropical weather blogger at http://www.cyclonicfury.com. My forecasts and thoughts are NOT official, for official forecasts please consult the National Hurricane Center.

User avatar
NDG
S2K Supporter
S2K Supporter
Posts: 14947
Joined: Sun Jul 09, 2006 10:14 pm
Location: Orlando, FL

Re: 2018 Indicators: SST's / MSLP / Sal / Steering / Shear / Instability (Graphic updates at first post)

#694 Postby NDG » Thu Jul 26, 2018 12:31 pm

SoupBone wrote:
TheStormExpert wrote:The NAO may finally go negative in the next 6-10 days according to the Euro Ensembles.


Well this would be crap during peak season, but great for a cold winter for the south (if it hung around). Less recurves and a much greater Gulf Coast threat.

EDIT: Wait, do i have this reversed? - Nao usually means less recurves? I really need a layman's course on the NAO. :lol: I thought a - NAO meant a more sprawled out Bermuda High, meaning more ridge coverage closer to the U.S. meaning less chance of a recurve.


You have it reversed but for the past few weeks the models have been wishcasting the NAO to go negative to go only near neutral to go back to positive right away, I will believe them when I see the NAO actually go negative.
Last edited by NDG on Thu Jul 26, 2018 12:38 pm, edited 1 time in total.
3 likes   

User avatar
NDG
S2K Supporter
S2K Supporter
Posts: 14947
Joined: Sun Jul 09, 2006 10:14 pm
Location: Orlando, FL

Re: 2018 Indicators: SST's / MSLP / Sal / Steering / Shear / Instability (Graphic updates at first post)

#695 Postby NDG » Thu Jul 26, 2018 12:37 pm

Windshear across the NW Caribbean has really gone down this week, overall now near average across the Caribbean.

Image
0 likes   

User avatar
CyclonicFury
Category 5
Category 5
Posts: 1977
Age: 25
Joined: Sun Jul 02, 2017 12:32 pm
Location: NC
Contact:

Re: 2018 Indicators: SST's / MSLP / Sal / Steering / Shear / Instability (Graphic updates at first post)

#696 Postby CyclonicFury » Thu Jul 26, 2018 12:40 pm

NDG wrote:Windshear across the NW Caribbean has really gone down this week, overall now near average across the Caribbean.

Image

Not looking very El Niño like out there yet. However, the cooler than normal MDR SSTs (though likely warmer than what CDAS is suggesting), along with dry air, should limit this season from being too active. You should not get complacent though in any season.
1 likes   
NCSU B.S. in Meteorology Class of 2021. Tropical weather blogger at http://www.cyclonicfury.com. My forecasts and thoughts are NOT official, for official forecasts please consult the National Hurricane Center.

User avatar
Kingarabian
S2K Supporter
S2K Supporter
Posts: 15462
Joined: Sat Aug 08, 2009 3:06 am
Location: Honolulu, Hawaii

Re: 2018 Indicators: SST's / MSLP / Sal / Steering / Shear / Instability (Graphic updates at first post)

#697 Postby Kingarabian » Thu Jul 26, 2018 12:58 pm

NDG wrote:Windshear across the NW Caribbean has really gone down this week, overall now near average across the Caribbean.

[img]https://i.imgur.com/Bgi43Jn.gif[img]


I think the W-Caribbean and the GOM will continue to have favorable upper level conditions. But there will be some saving grace this season, due to the E-Caribbean having high shear and also MDR conditions remaining poor as CycloneFury mentioned.
Last edited by Kingarabian on Thu Jul 26, 2018 1:28 pm, edited 1 time in total.
0 likes   
RIP Kobe Bryant

User avatar
TheStormExpert
Category 5
Category 5
Posts: 8487
Age: 30
Joined: Wed Feb 16, 2011 5:38 pm
Location: Palm Beach Gardens, FL

Re: 2018 Indicators: SST's / MSLP / Sal / Steering / Shear / Instability (Graphic updates at first post)

#698 Postby TheStormExpert » Thu Jul 26, 2018 1:27 pm

NDG wrote:Windshear across the NW Caribbean has really gone down this week, overall now near average across the Caribbean.

https://i.imgur.com/Bgi43Jn.gif

It’s hard to believe that there would even be high shear in the Caribbean in the first place with no definite El Niño and a quiet and hostile East Pacific.
0 likes   
The following post is NOT an official forecast and should not be used as such. It is just the opinion of the poster and may or may not be backed by sound meteorological data. It is NOT endorsed by storm2k.org.

User avatar
TheStormExpert
Category 5
Category 5
Posts: 8487
Age: 30
Joined: Wed Feb 16, 2011 5:38 pm
Location: Palm Beach Gardens, FL

Re: 2018 Indicators: SST's / MSLP / Sal / Steering / Shear / Instability (Graphic updates at first post)

#699 Postby TheStormExpert » Thu Jul 26, 2018 1:29 pm

Kingarabian wrote:
NDG wrote:Windshear across the NW Caribbean has really gone down this week, overall now near average across the Caribbean.

[img]https://i.imgur.com/Bgi43Jn.gif[img]


I think the W-Caribbean and the GOM will continue to have favorable upper level conditions. But there will be some saving grace this season, due to the E-Caribbean having high shear and also MDR conditions remaining poor as CycloneFury mentioned.

Yeah it’s going to be tough for any wave to make it past those hostile conditions alive. But don’t be fooled!
2 likes   
The following post is NOT an official forecast and should not be used as such. It is just the opinion of the poster and may or may not be backed by sound meteorological data. It is NOT endorsed by storm2k.org.

User avatar
gatorcane
S2K Supporter
S2K Supporter
Posts: 23499
Age: 46
Joined: Sun Mar 13, 2005 3:54 pm
Location: Boca Raton, FL

Re: 2018 Indicators: SST's / MSLP / Sal / Steering / Shear / Instability (Graphic updates at first post)

#700 Postby gatorcane » Thu Jul 26, 2018 1:37 pm

Today's SST anomaly maps shows a swath of above normal SSTs from Africa through the deep MDR all the way through the Lesser Antilles and to the Bahamas/Florida with a cooler than normal subtropical Atlantic and much above normal northern Atlantic. This configuration is more conducive for Cape Verde activity than what we were seeing months ago.

Also NW Caribbean and southern GOM are much above normal now compared to months ago:

Image
1 likes   


Return to “Talkin' Tropics”