ENSO Updates (2007 thru 2023)

This is the general tropical discussion area. Anyone can take their shot at predicting a storms path.

Moderator: S2k Moderators

Forum rules

The posts in this forum are NOT official forecasts and should not be used as such. They are just the opinion of the poster and may or may not be backed by sound meteorological data. They are NOT endorsed by any professional institution or STORM2K. For official information, please refer to products from the National Hurricane Center and National Weather Service.

Help Support Storm2K
Message
Author
User avatar
Macrocane
Category 5
Category 5
Posts: 4218
Age: 36
Joined: Sun May 24, 2009 5:35 pm
Location: El Salvador

Re: ENSO Updates

#781 Postby Macrocane » Thu Jun 18, 2009 8:51 am

HURRICANELONNY wrote:You don't need a computer model to tell were in or heading in an El Nino. Now the question is how strong. As fast as it came on. I'm saying moderate to possibly strong. :roll:


Agree with you about the strenght.
0 likes   

tolakram
Admin
Admin
Posts: 20009
Age: 62
Joined: Sun Aug 27, 2006 8:23 pm
Location: Florence, KY (name is Mark)

Re: ENSO Updates

#782 Postby tolakram » Thu Jun 18, 2009 9:17 am

Code: Select all

Apart from 2004 give me another example of a very active El Niño year


Very active?

2004 was different because it had a very high heat content which did make a big difference, something we most certainly don't have this season.


If moderate El Nino's squash tropical development then SST's should not matter. :)

I think people are reading what I say incorrectly (or more likely I'm saying it poorly). I think we know strong el ninos will lead to below normal activity, but as the strength of el nino is reduced many other factors come into play. In my opinion. The current forecast calls for a weak to moderate el nino, so I'm not ready to go much below normal with my numbers. I do think it's safe to say the odds of an above normal season are slim to none.

1982, a major El Nino, 6 storms
1986, el nino, 6 storms
1991, el nino, 8 storms
1994, el nino, 12 storms
1997, strongest El Nino on record, 8 storms
2002, el nino forms rapidly, 14 storms, none after Sept 21st

We've only had one major El Nino during the more active (since 1995) phase, and that one, the strongest ever recorded, had 8 storms.

So call me skeptical. You can call me a fool too. :D I'm sticking with an average (post 1995) season.
0 likes   

Cleveland Kent Evans
Tropical Storm
Tropical Storm
Posts: 235
Joined: Fri May 02, 2008 4:02 pm

Re: ENSO Updates

#783 Postby Cleveland Kent Evans » Thu Jun 18, 2009 9:46 am

HURRICANELONNY wrote:You don't need a computer model to tell were in or heading in an El Nino. Now the question is how strong. As fast as it came on. I'm saying moderate to possibly strong. :roll:


This is a serious question:

Is that just an emotional impression, or is there actual data which shows that the speed of onset of an El Nino is positively correlated with its overall strength?
0 likes   

StormClouds63
Category 2
Category 2
Posts: 583
Age: 62
Joined: Tue May 13, 2008 11:56 am
Location: Southwest Louisiana

Re: ENSO Updates

#784 Postby StormClouds63 » Thu Jun 18, 2009 9:51 am

tolakram:
Good post ... though I still think a below average season (using the active cycle since 1995) is more likely.

Anyway, I'm pretty sure Isidore and Lili were after September 21, 2002. Southwest Louisiana received only a glancing blow from Isidore, but Lili made landfall around October 3/4 east of Lake Charles.
0 likes   

Cleveland Kent Evans
Tropical Storm
Tropical Storm
Posts: 235
Joined: Fri May 02, 2008 4:02 pm

Re: ENSO Updates

#785 Postby Cleveland Kent Evans » Thu Jun 18, 2009 9:55 am

StormClouds63 wrote:tolakram:
Anyway, I'm pretty sure Isidore and Lili were after September 21, 2002. Southwest Louisiana received only a glancing blow from Isidore, but Lili made landfall around October 3/4 east of Lake Charles.


He's using the date the storm formed, not the dates they lasted until. And it seems that Lili did form on September 21 even though it didn't hit Louisiana until October.

http://www.nhc.noaa.gov/2002lili.shtml
0 likes   

StormClouds63
Category 2
Category 2
Posts: 583
Age: 62
Joined: Tue May 13, 2008 11:56 am
Location: Southwest Louisiana

Re: ENSO Updates

#786 Postby StormClouds63 » Thu Jun 18, 2009 10:00 am

Thanks for the clarification ... I think Lili intensified and then weakened at one of the fastest rates in GOM history. Isidore actually may have been partly responsible (upwelling cooler waters near the coast?)
0 likes   

User avatar
Macrocane
Category 5
Category 5
Posts: 4218
Age: 36
Joined: Sun May 24, 2009 5:35 pm
Location: El Salvador

Re: ENSO Updates

#787 Postby Macrocane » Thu Jun 18, 2009 10:00 am

tolakram wrote:

Code: Select all

Apart from 2004 give me another example of a very active El Niño year


Very active?


I meant, a very active Atlantic Hurricane Season during an El Nino year, not a very active El Niño :oops:
0 likes   

User avatar
KWT
Category 5
Category 5
Posts: 31415
Joined: Tue Aug 17, 2004 11:02 am
Location: UK!!!

Re: ENSO Updates

#788 Postby KWT » Thu Jun 18, 2009 11:13 am

tolakram wrote:
2004 was different because it had a very high heat content which did make a big difference, something we most certainly don't have this season.


If moderate El Nino's squash tropical development then SST's should not matter. :)

quote]

Remember that was a weak El Nino and there was nothing in June and all but 1 days of July, and very little after mid September as well. We had a 6 week period roughly which saw much more favorable jet motion which reduced shear. That added to the very high SSTA allowed the season to burst into life.

Its not impossible for us to still get an active period but with lower SSTs then normal it just means we may not get quite the same amount of systems IF the shear does ease off.
0 likes   

HURRICANELONNY
Category 5
Category 5
Posts: 1383
Joined: Wed May 07, 2003 6:48 am
Location: HOLLYWOOD.FL

Re: ENSO Updates

#789 Postby HURRICANELONNY » Thu Jun 18, 2009 11:38 am

Saying that you don;t need a computer model to see that El Nino is forming is really not emotional. A couple of months ago. Alot of I think dynamical models said neutral for the rest of the year. Alot of models that are being initialized now are calling for El Nino. Kind of obvious. :roll:
0 likes   

User avatar
Macrocane
Category 5
Category 5
Posts: 4218
Age: 36
Joined: Sun May 24, 2009 5:35 pm
Location: El Salvador

Re: ENSO Updates

#790 Postby Macrocane » Thu Jun 18, 2009 12:38 pm

HURRICANELONNY wrote:Saying that you don;t need a computer model to see that El Nino is forming is really not emotional. A couple of months ago. Alot of I think dynamical models said neutral for the rest of the year. Alot of models that are being initialized now are calling for El Nino. Kind of obvious. :roll:


A couple of months ago most statistical models were predicting neutral conditions, but dynamical were predicting a weak El Niño. I rember that because I didn't want an El Niño to form and when I saw the first models predicting it I thought "Please God no!". Now they say moderate to strong El Niño, so yes, they have changed. We don't have to believe blindly in them but they are very usefull.
0 likes   

User avatar
cycloneye
Admin
Admin
Posts: 145306
Age: 68
Joined: Thu Oct 10, 2002 10:54 am
Location: San Juan, Puerto Rico

Re: ENSO Updates

#791 Postby cycloneye » Thu Jun 18, 2009 12:46 pm

IRI June update of ENSO

They predict weak to moderate el nino by the August,September,October timeframe.Read the whole update (Is a long read) below the graphics.

Image

Image

General Discussion

Between early April and mid-June 2009, the NINO3.4 SST anomaly index has risen from values indicative of weak La Niña conditions through ENSO-neutral values, and is currently at the threshold of weak El Niño territory. Atmospheric conditions are still mainly ENSO-neutral in character, due in part to persistence of some La Niña oceanic and atmospheric features in the western Pacific. However, westerly low-level wind anomalies in this same region, and an above-average sub-surface oceanic heat content across the central and eastern equatorial Pacific, portend likely further development of the oceanic aspects of El Niño. Expected increasing SST anomalies in the central and eastern tropical Pacific will provide increased opportunity for coupling to the atmosphere in the coming several months.
Out of a large set of dynamical and statistical forecast models, about two-thirds indicate El Niño development during the Jun-Jul-Aug or Jul-Aug-Sep seasons. Overall, based on model forecasts and current observations of the ocean surface and subsurface, for the coming Jul-Sep season the probability for El Niño conditions is estimated at 62%, for ENSO-neutral conditions 37%, and for returning to La Niña conditions no more than 1%. Currently, the estimated strength of the likely El Niño event appears weak to moderate.


Technical ENSO Update
18 June 2009

Current Conditions

As of mid-June 2009 SSTs are somewhat above-average across much of the equatorial Pacific, indicative of borderline El Niño conditions. Between early April and the first 3 weeks of June, SSTs in the east-central tropical Pacific have warmed from weak La Niña conditions to the threshold of weak El Niño levels. Although slightly above-average SSTs and convection related to the weak La Niña earlier this year linger in the western tropical Pacific, westerly wind anomalies have recently developed in this same region. The equatorial Southern Oscillation Index (SOI) is still slightly positive, but the traditional SOI has been slightly negative for about one month. Equatorial heat content has increased to above-average levels over the last several months, and with the ocean adjustment the SST is in the process of becoming above average by greater amounts in the east-central than in the western equatorial Pacific.

For May 2009, the SSTs in the NINO3.4 region were in the neutral range with anomaly of 0.27 C, and for the Mar-Apr-May season they were -0.13 degrees C from average. Currently the IRI's definition of El Niño conditions rests on an index of SST anomalies, averaged over the NINO3.4 region (5S-5N; 170W-120W), exceeding the warmest 25%-ile of the historical distribution, and similarly for La Niña relative to the 25%-ile coldest conditions in the historical distribution. The NINO3.4 anomaly necessary to qualify as La Niña or El Niño conditions for the Jun-Jul-Aug and the Sep-Oct-Nov seasons are approximately (-0.50C, 0.45) and (-0.75, 0.70), respectively.


Expected Conditions

The most recent weekly SST anomaly in the NINO3.4 region is 0.5 C, indicating borderline El Niño conditions in the tropical Pacific. What are the probabilities for reverting to neutral conditions, or developing more unambiguously El Niño conditions? Wind anomalies along the equator in the western-to-central Pacific are currently westerly, but in the central and eastern portions of the basin winds remain more weak and random. The thermocline, contituting the main element of the tropical Pacific system imparting ENSO predictability, has become somewhat deeper than average in the central and eastern part of the Pacific. However, positive depth anomalies in the west from several months ago have not yet returned to average, so that a significant zonal gradient of depth anomaly is not yet present.
June is past the middle of the so-called "predictability barrier" of boreal spring. It is typically easier to predict from this point forward than it was a few months ago for forecasts going through the boreal spring. The perturbations to the upper ocean structure, which impact predictability to ENSO, have featured anomalously warm subsurface waters in the west and central Pacific, and increasingly more anomalously warm subsurface wasters in the eastern Pacific. This developing pattern is conducive to El Niño development, as the warm waters at depth in the east are poised to rise to the surface in response to the easterly low-level Trade winds. This process is already underway, and SST anomalies during the most recently observed week exceed 1.0 C in some pockets in the far eastern tropical Pacific. Large-scale coupling between a warmed central and eastern Pacific and the overlying atmosphere has not yet shown signs of beginning, aside from the still small region of anomalous low-level westerly equatorial winds in the west. The spatial distribution of anomalous convection is currently weak, with a pocket of positive anomaly west of the dateline and little anomaly from the dateline eastward. Atmospheric aspects of El Niño typically are not manifest this early in the ENSO seasonal cycle except during the onset of very strong El Niños, which appears improbable for the current likely event now in its initial stage.
Presently, the models indicate probabilities of about 56% for developing El Niño conditions, and about 43% for ENSO-neutral conditions for the Jun-Jul-Aug season in progress. Going forward, probabilities for El Niño increase to 60 to 65% for the remaining 3-month periods in 2009, decreasing toward the end of the year and falling below 50% by northern spring 2010. Probabilities for La Niña conditions are predicted to be negligible through the remainder of 2009.


The above assessment was made in part on the basis of an examination of the current forecasts of ENSO prediction models as well as the observed conditions. For purposes of this discussion, El Niño SST conditions are defined as SSTs in the NINO3.4 region being in the warmest 25% of their climatological distribution for the 3-month period in question over the 1950-present timeframe. The corresponding cutoff in terms of degrees C of SST anomaly varies seasonally, being close to 0.40 degrees C in northern late-spring to early-summer season and as high as 0.75 degrees C in late northern autumn. La Niña conditions are defined as NINO3.4 region SSTs being in the coolest 25% of the climatological distribution. Neutral conditions occupy the remaining 50% of the distribution. These definitions were developed such that the most commonly accepted El Niño and La Niña episodes are reproduced.

The models somewhat varied in their ENSO forecasts through the 10-month forecast period. The statistical models, which were notably reluctant to predicting El Niño as recently as last month, have now begun calling for warmer conditions in the face of appreciably warmer initial conditions. Many of the dynamical models have continued predicting El Niño conditions of varying intensities, a majority showing somewhat greater warmth in current forecasts than those from last month. For the current Jun-Jul-Aug season, no models are predicting La Niña conditions, about half are predicting ENSO-neutral conditions, and half El Niño conditions. For Jul-Aug-Sep and the two subsequent running 3-month periods, the distribution becomes about one-third for ENSO-neutral and two-thirds for El Niño conditions. At lead times of 4 or more months into the future, statistical and dynamical models that incorporate information about the ocean's observed sub-surface thermal structure generally exhibit higher predictive skill than those that do not. Among models that do use sub-surface temperature information, none indicates the existence of La Niña, 11 of 16 (69%) indicate El Niño conditions for the Sep-Oct-Nov season, and 5 of 16 (31%) predict that SSTs will be ENSO-neutral (Note 1). Caution is advised in interpreting the distribution of model forecasts as the actual probabilities. At longer leads, the skill of the models degrades, and skill uncertainty must be convolved with the uncertainties from initial conditions and differing model physics, leading to more climatological probabilities in the long-lead ENSO Outlook than might be suggested by the suite of models. Furthermore, the expected skill of one model versus another has not been established using uniform validation procedures, which may cause a difference in the true probability distribution from that taken verbatim from the raw model predictions.

An alternative way to assess the probabilities of the three possible ENSO conditions is to use the mean of the forecasts of all models, and to construct a standard error function centered on that mean. The standard error would be Gaussian in shape, and would have its width determined by an estimate of overall expected model skill for the season of the year and the lead time. Higher skill would result in a relatively narrower error distribution, while low skill would result in an error distribution with width approaching that of the historical observed distribution. This method shows probabilities favoring El Niño near 56% for Jun-Jul-Aug, increasing to about 67% for Jul-Aug-Sep and Aug-Sep-Oct, and decreasing slowly but remaining at or above 50% into early 2010. The same cautions mentioned above for the distribution of model forecasts apply to this alternative method of inferring probabilities, due to differing model biases and skills. In particular, this approach considers only the mean of the predictions, and not the range across the models, nor the ensemble range within individual models.

The IRI's probabilistic ENSO forecast takes into account the indications of this set of models, the outcome of the standard error approach described above, and additional factors such as the very latest observations that may have developed after the initialization times of some of the models. It indicates a 56% probability for El Niño conditions in the Jun-Jul-Aug season in progress, increasing to 60 to 65% afterwards.

Link to IRI site:

http://iri.columbia.edu/climate/ENSO/cu ... table.html
0 likes   

LarryWx
S2K Supporter
S2K Supporter
Posts: 6305
Joined: Sun Sep 07, 2003 2:04 pm
Location: GA

Re: ENSO Updates

#792 Postby LarryWx » Thu Jun 18, 2009 2:16 pm

Macrocane wrote:Apart from 2004 give me another example of a very active El Niño year... I think they are isolated cases and it's not the common. Take a look at 1997, 2002, 2006 those were El Niño years and we saw reduced overall numbers or weaker storms. I agree that we don't have to let down our guard during this season, but we don't have to expext another 2004 year either.
Just my two cents.


1969 for sure. And 1951 had five majors. However,they, like 2004, were both only weak El Nino seasons. The other 28 or so El Nino seasons were overall a good bit less active. So, overall, I agree with what you are saying, especially since Atlantic SST's are not currently so warm (vs. 1995-2008).
0 likes   

jinftl
Category 5
Category 5
Posts: 4312
Joined: Tue Aug 31, 2004 4:47 pm
Location: fort lauderdale, fl

Re: ENSO Updates=IRI June update=Weak to Moderate El Nino

#793 Postby jinftl » Thu Jun 18, 2009 3:41 pm

Summary from enso update report...


The set of dynamical and statistical model forecasts issued during late May and early June 2009 show three forecast clusters: A small set of statistical models calling for NINO3.4 conditions very close to average, a large cluster of mixed model type predicting borderline to weak El Nino conditions, and a handful of dynamical models forecasting a significant (moderate to strong) El Nino episode.

At the time of preparing this, the SST observations in the NINO3.4 region are at a minimal El Nino level, with an area-averaged weekly anomaly of 0.5C. Tropical Pacific atmospheric conditions have been largely ENSO-neutral, with lingering convection and above-normal SSTs in the western tropical Pacific, despite that the Southern Oscillation Index recently became negative and westerly low-level wind anomalies developed west of the dateline.

Current forecasts and observations indicate that development of weak to moderate El Nino conditions is the most likely scenario through 2009 (with probability just over 60% from JAS to OND seasons), but retention of neutral conditions is also possible with probabilities of approximately 35-40%.
0 likes   

User avatar
BigA
Professional-Met
Professional-Met
Posts: 1317
Joined: Sun Jul 24, 2005 10:56 pm

#794 Postby BigA » Thu Jun 18, 2009 11:45 pm

I did some statistical analysis of the correlation between the Pacific sea surface temperatures and Atlantic hurricanes, and I basically found that the ENSO only has a slight effect on average when the value is between 0.5 and 1.0, but above 1 Atlantic activity drops dramatically. If you want a copy of this spreadsheet and charts, just send me a PM.
0 likes   

User avatar
cycloneye
Admin
Admin
Posts: 145306
Age: 68
Joined: Thu Oct 10, 2002 10:54 am
Location: San Juan, Puerto Rico

Re: ENSO Updates

#795 Postby cycloneye » Fri Jun 19, 2009 6:27 pm

Daily SOI Data

It continues to go like a yo-yo,up and down,right now going down with todays reading at -23.76.

Code: Select all

  8-Jun-2009     1013.10   1012.15     -2.39   
  9-Jun-2009     1012.44   1013.85    -18.98   
  10-Jun-2009    1011.39   1015.25    -36.20   
  11-Jun-2009    1008.89   1014.65    -49.56   
  12-Jun-2009    1010.47   1014.40    -36.69   
  13-Jun-2009    1012.00   1013.50    -19.61   
  14-Jun-2009    1012.43   1012.80    -11.67     
  15-Jun-2009    1013.93   1011.90      5.20     
  16-Jun-2009    1014.44   1012.30      5.97     
  17-Jun-2009    1014.00   1014.10     -9.77     
  18-Jun-2009    1013.53   1015.15    -20.46     
  19-Jun-2009    1012.26   1014.35    -23.76     

http://www.longpaddock.qld.gov.au/Seaso ... SOIValues/

30 Day SOI Data

Image

http://www.bom.gov.au/climate/enso/soi.dt3
0 likes   

User avatar
cycloneye
Admin
Admin
Posts: 145306
Age: 68
Joined: Thu Oct 10, 2002 10:54 am
Location: San Juan, Puerto Rico

Re: ENSO Updates

#796 Postby cycloneye » Sat Jun 20, 2009 8:40 am

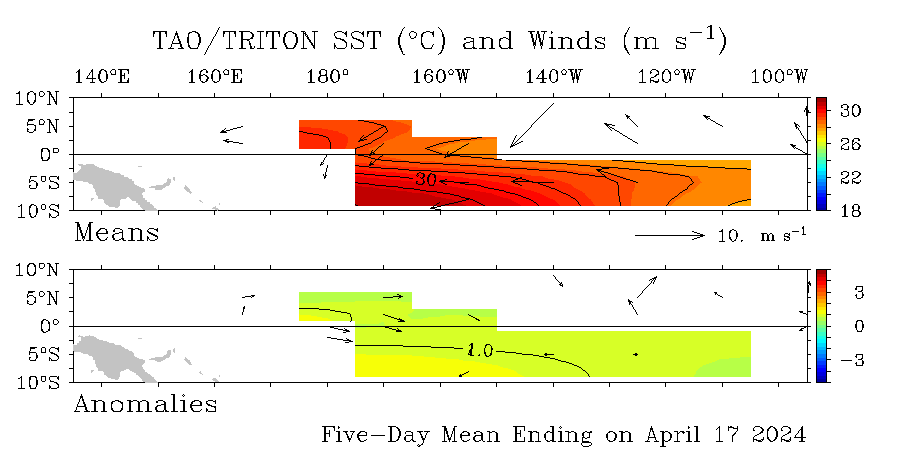
Daily data of Sea Surface Temperatures and Anomalies

This graphic updates everyday.

Image

http://www.pmel.noaa.gov/tao/
0 likes   

User avatar
cycloneye
Admin
Admin
Posts: 145306
Age: 68
Joined: Thu Oct 10, 2002 10:54 am
Location: San Juan, Puerto Rico

Re: ENSO Updates

#797 Postby cycloneye » Mon Jun 22, 2009 8:37 am

Daily SOI Index Data

The yo-yo continues,today turning positive at +6.61.

9-Jun-2009 1012.44 1013.85 -18.98
10-Jun-2009 1011.39 1015.25 -36.20
11-Jun-2009 1008.89 1014.65 -49.56
12-Jun-2009 1010.47 1014.40 -36.69
13-Jun-2009 1012.00 1013.50 -19.61
14-Jun-2009 1012.43 1012.80 -11.67
15-Jun-2009 1013.93 1011.90 5.20
16-Jun-2009 1014.44 1012.30 5.97
17-Jun-2009 1014.00 1014.10 -9.77
18-Jun-2009 1013.53 1015.15 -20.46
19-Jun-2009 1012.26 1014.35 -23.76
20-Jun-2009 1011.70 1013.20 -19.61
21-Jun-2009 1012.10 1012.40 -11.18
22-Jun-2009 1014.03 1011.80 6.61

http://www.longpaddock.qld.gov.au/Seaso ... SOIValues/
0 likes   

User avatar
cycloneye
Admin
Admin
Posts: 145306
Age: 68
Joined: Thu Oct 10, 2002 10:54 am
Location: San Juan, Puerto Rico

Re: ENSO Updates

#798 Postby cycloneye » Mon Jun 22, 2009 9:11 am

All the El Nino areas continued to creep up in the past 7 days (Over +0.5) as the weekly update shows.

Image

The subsurface warm waters continue to rise to the surface.

Image

The Anomalies continmue to warm.

Image
http://www.cpc.ncep.noaa.gov/products/p ... discussion
0 likes   

User avatar
cycloneye
Admin
Admin
Posts: 145306
Age: 68
Joined: Thu Oct 10, 2002 10:54 am
Location: San Juan, Puerto Rico

Re: ENSO Updates

#799 Postby cycloneye » Mon Jun 22, 2009 11:11 am

Climate Prediction Center Weekly Update

El nino is on its way according to the latest update from CPC.

Read the update at hyperlink below.

Climate Prediction Center Weekly update

Update of all four El Nino regions:

The latest weekly SST departures are:
Niño 4= +0.6ºC
Niño 3.4= +0.7ºC
Niño 3= +0.8ºC
Niño1+2= +0.9ºC
0 likes   

User avatar
cycloneye
Admin
Admin
Posts: 145306
Age: 68
Joined: Thu Oct 10, 2002 10:54 am
Location: San Juan, Puerto Rico

Re: ENSO Updates

#800 Postby cycloneye » Tue Jun 23, 2009 10:24 am

Daily SOI Index Data

For the past two days it has gone up,today at +11.04

17-Jun-2009 1014.10 -9.77
18-Jun-2009 1013.53 -20.46
19-Jun-2009 1012.26 -23.76
20-Jun-2009 1011.70 -19.61
21-Jun-2009 1012.10 -11.18
22-Jun-2009 1014.03 + 6.61
23-Jun-2009 1014.41 +11.04


http://www.longpaddock.qld.gov.au/Seaso ... SOIValues/
0 likes   


Return to “Talkin' Tropics”

Who is online

Users browsing this forum: cycloneye, IamKelleyP, Steve H. and 45 guests