NDG wrote:
Here's a more detailed image.
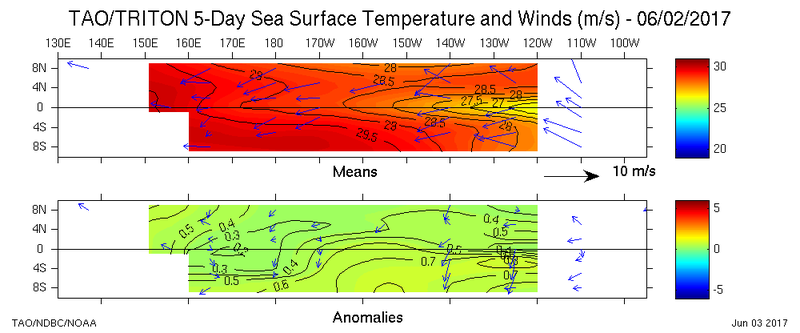
Possibly we keep +0.6C since the 0.7C line is above the equator @ 140W.
NDG what options do you toggle on the TAO site? Or do you simply just click on all the buoys?
Moderator: S2k Moderators


NDG wrote:
Here's a more detailed image.


Ntxw wrote:Both charts says 5S-5N though it seems. But I can understand the discrepancies again via different climo datasets and/or color bars.


Kingarabian wrote::uarrow:
Agreed. think that'll solve the debate on which SST anomaly graphic to use.
Looks like there's going to be weak WWB at Nino 1+2 soon. You can expect it to recover if it verifies due to Nino 1+2 being upper wind sensitive since it's so shallow.

Ntxw wrote:Here's a daily view of global SST anomalies from NCEP. To mention at least per their site, it incorporates buoys and satellites
http://polar.ncep.noaa.gov/sst/ophi/
Seems pretty neat to me and you can click on different areas for up close view
Alyono wrote:Kingarabian wrote::uarrow:
Agreed. think that'll solve the debate on which SST anomaly graphic to use.
Looks like there's going to be weak WWB at Nino 1+2 soon. You can expect it to recover if it verifies due to Nino 1+2 being upper wind sensitive since it's so shallow.
that may be due to the TC the MU tries to develop in the 7-10 day time period. If it does not develop there, there will not be the westerly wind anomaly
WeatherEmperor wrote:Seems pretty neat to me and you can click on different areas for up close view
I clicked on the web URL and when looking at the anomaly graphics it shows it uses SST temp anomalies from 1961 - 1990. That is pretty far back in time. Does this have any affect on the current most up to date anomalies??
Sent from my iPhone 7 using Tapatalk
Ntxw wrote:Here's a daily view of global SST anomalies from NCEP. To mention at least per their site, it incorporates buoys and satellites
http://polar.ncep.noaa.gov/sst/ophi/
Seems pretty neat to me and you can click on different areas for up close view
Kingarabian wrote:
Possibly we keep +0.6C since the 0.7C line is above the equator @ 140W.
NDG what options do you toggle on the TAO site? Or do you simply just click on all the buoys?
NDG wrote:Ntxw wrote:Here's a daily view of global SST anomalies from NCEP. To mention at least per their site, it incorporates buoys and satellites
http://polar.ncep.noaa.gov/sst/ophi/
Seems pretty neat to me and you can click on different areas for up close view
I would question the SSTs anomalies for the northern latitudes, one example is Hudson Bay when right now is covered in Ice.


Users browsing this forum: No registered users and 229 guests


