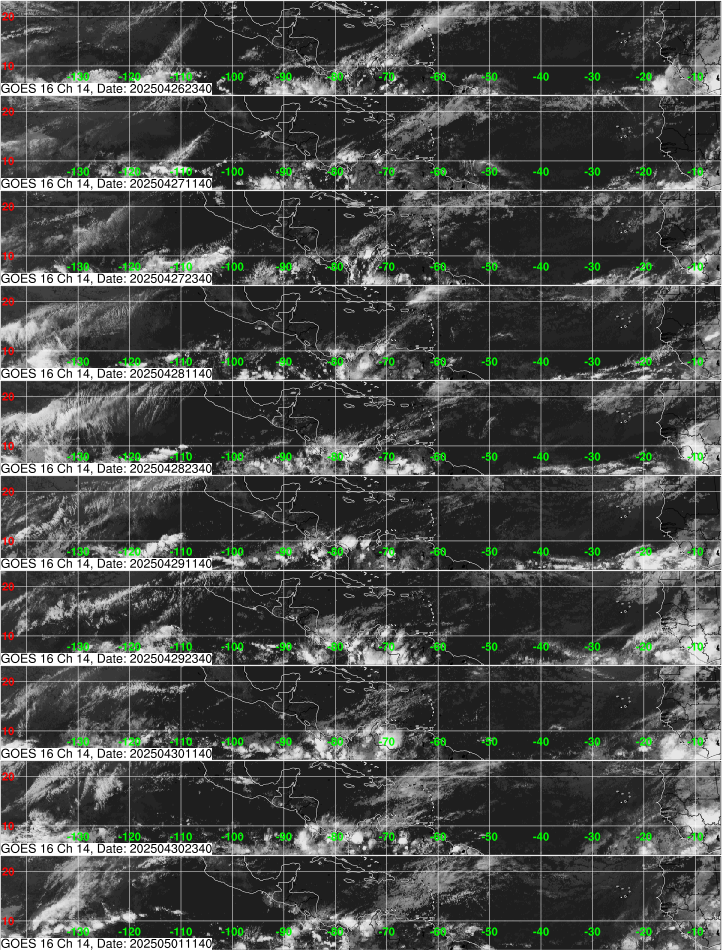
In tropical meteorology...these can be applied by using a strip of 10 satelllite images over 5 days, taken around 0Z and 12Z.
Back in the day, some may remember John Hope talking about persistence of tropical features...that they needed to be around ofr 24 hours or more before he would really take a look to see if it had a chance to develop. He didn't need models, just good old synoptic reasoning.
The Hovmoller Diagram lets forecasters, analysts and tropical enthusiasts see which features have and haven't been around long enough...or haven't been persistent enough, to warrent a closer look.
Here is the most recent view of the Atlantic basin:

Here's that link:
http://www.nhc.noaa.gov/tafb_latest/gehov1latest.gif
The first image is the oldest...so as you read down you should see the progression of features moving from east to west until you get to the most recent image from 11:45Z this morning.
Now, take a look at that area of disturbed weather coming into the islands...it just started to get going overnight and most of the real convection hasn't been around for more than 12 hours. That would not be a place I would look.
However, the weather near 32 west can be tracked from it's departure from Africa around 12Z July 27th.
Given this has been more or less on the map for 2 full days, I really believe it warrents some attention in the TWO...and maybe they will bring it up at 2PM..
Looking at the diagram, though, it's no better organized than it was 2 days ago...just an area of storms that appear to be impacted by easterly shear. Plus, there's not much model support for development. So, I can see where the case could be made to not discuss it.
To me, figuring out if something will develop or not is the most interesting part about tropical meteorology. Over the years, this diagram is the first thing I look at in the morning to see if something is persisting, increasing or decreasing in organization.
Hopefully it helps others do the same.
MW
PS (Edit): These kind of diagrams are used for lots of weather applications, including finding Kelvin waves through tracking SST anoms over time, watching the MJO etc. They are more familiar than some realize...


