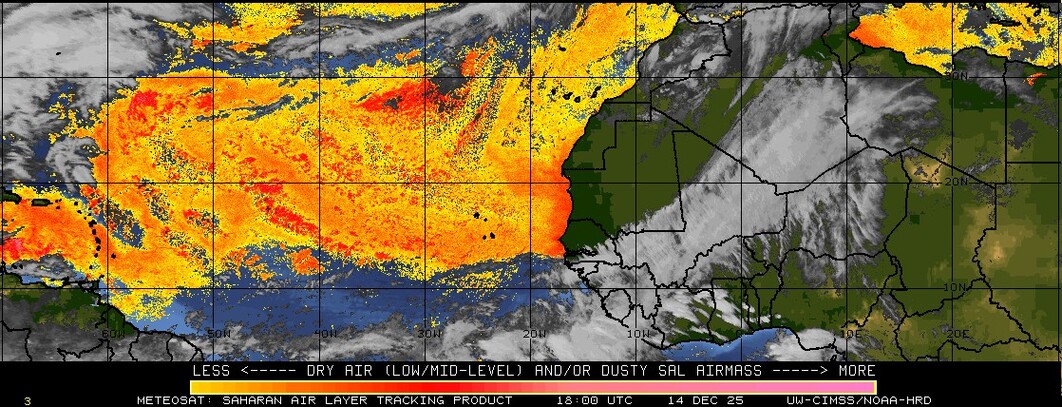

The top image is the Saharan Air Layer. It appears modest when compared to prior years at this time. The second image is the rainfall anomaly across Africa for April. The rainfall anomaly was average to slightly below average. I will be interested to see what the rainfall was for May, as there has been no major dust storm rolling off the coast. If you have followed the Saharan Air Layer over the years, there is usually nothing but dust all the down to 10N.
Take a look at this dust storm from July 18, 2005: http://www.youtube.com/watch?feature=pl ... ZsYDRQRJ1A
Again, for June 1st, the Saharan Air Layer is weak and especially so in light of the African rainfall.
The bottom picture is the 31 day wind shear anomaly from April 30-May 30. It shows lower wind shear anomalies in the MDR. Such favorable wind shear anomalies, if present in Aug-Oct, would be worrisome. The GFS runs for the past few days have shown that this lower wind shear anomaly will continue over the next 10 days. I'm not so much looking for development during this time as I am more interested in the overall pattern.

Finally, the image above shows the wind shear in the Atlantic was above climatology through April. However, it flipped in May and we are now running below average wind shear relative to climatology. Wind shear vs. climatology and the Saharan air layer are two pieces of information I like to focus on in the early season to note any patterns. ENSO can change everything, but it appears neutral is the prevailing state for this season. Should ENSO neutral prevail, it will be very interesting to follow these two metrics in the months ahead.