HDOB Recon Plot for date range

This is the general tropical discussion area. Anyone can take their shot at predicting a storms path.

Moderator: S2k Moderators

Forum rules

The posts in this forum are NOT official forecasts and should not be used as such. They are just the opinion of the poster and may or may not be backed by sound meteorological data. They are NOT endorsed by any professional institution or STORM2K. For official information, please refer to products from the National Hurricane Center and National Weather Service.

Help Support Storm2K
Message
Author
User avatar
AGM
Tropical Wave
Tropical Wave
Posts: 3
Age: 75
Joined: Wed Aug 29, 2012 9:11 pm
Location: NGA Mountains USA

HDOB Recon Plot for date range

#1 Postby AGM » Thu Aug 30, 2012 12:11 am

I have been looking at the HDOB recon data and trying a few plots.
The recon list is from.
http://www.nhc.noaa.gov/archive/recon/2012/AHONT1/
I just use the files for one day for testing.
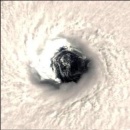
The hurricane satellite image is from here.
http://weather.msfc.nasa.gov/cgi-bin/get-goes?satellite=GOES-E%20HURRICANE&&lat=28&lon=-90&quality=100&width=800&height=800&zoom=1
The image location lat lon is taken from the HDOB reports. As the program scans through the data it saves the most north west location.
The image is being put together using imagemagick. The dot colors are wind speed, using common map wind speed colors. All the recons for the day are plotted below the storm center. I did this so the plot data could be seen as well as the storm center at the same time.
If anyone has any ideas or feedback I would be interested in it., Thanks John
examples
recplot2.gif 2012 08 28
Image
reconplot3.gif 20 08 29
Image
Last edited by AGM on Thu Aug 30, 2012 12:18 am, edited 1 time in total.
0 likes   
*MANDATORY DISCLAIMER*
The following post is NOT an official forecast and should not be used as such. It is just the opinion of the poster and may or may not be backed by sound meteorological data. It is NOT endorsed by any professional institution including storm2k.org For Official Information please refer to the NHC and NWS products.

User avatar
Cyclenall
Category 5
Category 5
Posts: 6666
Joined: Thu Jun 08, 2006 10:01 pm
Location: Ontario, Canada

#2 Postby Cyclenall » Thu Aug 30, 2012 12:17 am

Welcome to S2K! As far as feedback, what is it your trying to accomplish with this? You wrote, "I did this so the plot data could be seen as well as the storm center at the same time." - Isn't this already done by imagery from Google Earth that's regularly posted here? I don't have it installed but I think you can do different overlays including the current NHC position.

EDIT: I see the images now, but I'm still confused at what this is trying to illustrate.
0 likes   

User avatar
AGM
Tropical Wave
Tropical Wave
Posts: 3
Age: 75
Joined: Wed Aug 29, 2012 9:11 pm
Location: NGA Mountains USA

Re: HDOB Recon Plot for date range

#3 Postby AGM » Thu Aug 30, 2012 10:44 pm

Cyclenall, Thanks for your interest. This does not use google tools. Why?, Weather is interesting, so having a look at what can be done with public data.
Image
This one has wind direction symbols, wind speed and pressure. The pressure is displayed as the two soft colors using a selection switch of eye forming millibars.
Working now to plot the symbols by color intensity like a painting is made. This way the higher contrast symbols will be plotted last so they are not lost. Next I will be looking at adding in drop data and sea buoys. Note- the sat image is from today and the HDOB data is from 2012-08-28
Image
This one is the same as the one above, but with the significant data plotted on the top. Also the higher pressures and low wind plots were skipped. It gives a pretty good snapshot of what the storm is doing I think.

Image
This is with the HDOB on the bottom against black for easy reading. The top sat view is zoomed out for a wider view. This leaves room for plotting ship data, wave heights, drop data or any other information that might be available. Maybe the short position and storm status somewhere at the side.
Image
This is with some buoy data plotted in. My thought is to only display major wave height by color code and wind direction by the symbol point. Maybe display buoys within a few hundred miles of the storm.
buoy data link used
http://www.ndbc.noaa.gov/data/latest_obs/latest_obs.txt
0 likes   
*MANDATORY DISCLAIMER*
The following post is NOT an official forecast and should not be used as such. It is just the opinion of the poster and may or may not be backed by sound meteorological data. It is NOT endorsed by any professional institution including storm2k.org For Official Information please refer to the NHC and NWS products.

User avatar
cycloneye
Admin
Admin
Posts: 145366
Age: 68
Joined: Thu Oct 10, 2002 10:54 am
Location: San Juan, Puerto Rico

Re: HDOB Recon Plot for date range

#4 Postby cycloneye » Fri Apr 05, 2013 5:13 pm

Here is a good tutorial for those who dont know a lot about how to follow the recon data. There are new things that NHC has added for the 2013 season.

http://www.nhc.noaa.gov/outreach/presen ... ftData.pdf
0 likes   
Visit the Caribbean-Central America Weather Thread where you can find at first post web cams,radars
and observations from Caribbean basin members Click Here


Return to “Talkin' Tropics”

Who is online

Users browsing this forum: 869MB, AnnularCane, HurricaneFan, hurricanes1234, LarryWx, USTropics and 60 guests