The posts in this forum are NOT official forecasts and should not be used as such. They are just the opinion of the poster and may or may not be backed by sound meteorological data. They are NOT endorsed by any professional institution or STORM2K. For official information, please refer to products from the National Hurricane Center and National Weather Service.
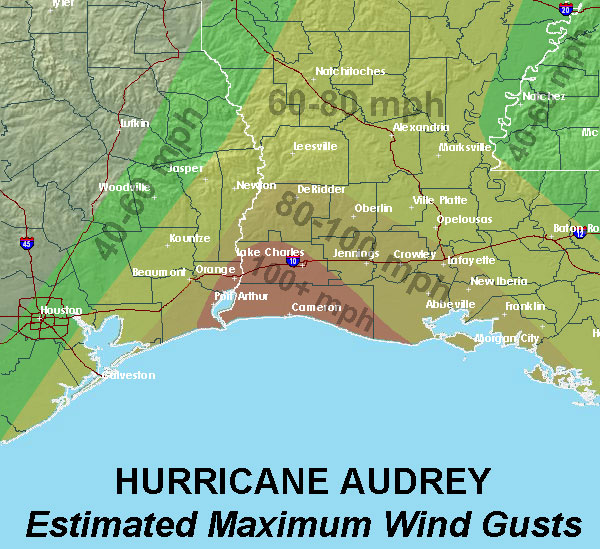
The real question is whether we get storms that wxman57 and everyone else agree are (major) hurricanes. Elsa’s winds have been disputed by many informed people on all sides, with people such as wxman seeing lower MSW than others. Its winds certainly appear to have been overestimated for much of its life, except for a brief segment over the Lesser Antilles. Other people here have disputed Laura’s and Zeta’s MSW at landfall on the CONUS, and have made good points in their favour. If one looks at old radar images of Audrey, Carla, Camille, Celia, and Eloise, among others, one sees that, even with crude techniques in place then vs. today’s technology, those storms had much more impressive radar presentations at landfall vs. most recent MH impacts on the CONUS. Since the 1990s only Andrew, Charley, and Michael really compare to many of these old storms in terms of radar-based presentation.
The storms from the 1950s through the ‘70s had much stronger convection and more organised inner cores than, say, Ivan, Dennis, Katrina, Rita, Wilma, Ike, and even Harvey had at landfall. Also, since the 1990s we have not seen a very powerful hurricane make landfall on the CONUS that was both large and intense, in terms of MSW as well as pressure. Unofficially, Katrina might well have been a low-end Cat-4 at LF based on MSW, but officially it only qualifies as a borderline-Cat-5 based on its MSLP of 920 mb at landfall and surge-based impacts. During the last +AMO from 1926 to 1969, there were a number of Cat-4+ landfalls associated with storms that were also quite large: the 1926 Miami hurricane, the 1928 Okeechobee hurricane, the 1947 Fort Lauderdale hurricane, the 1949 Florida hurricane, Hazel (1954), Carla (1961), and Betsy (1965), for instance. During the -AMO the U.S. also witnessed Hugo (1989), one of the largest Cat-4+ hurricanes to strike the U.S., especially at its latitude.
Certainly, Irma was a large Cat-4 at landfall on the Florida Keys, but I believe its 115-kt MSW at LF is dubious, as neither aircraft nor radar supported anything stronger than 110 kt. I also think that both Harvey and Laura were overestimated at LF; Laura in particular produced surge values comparable to Audrey, despite having been a similarly sized storm, and also produced far less intense wind damage than Audrey did. Harvey also produced surprisingly negligible wind damage for a deepening 115-kt system at LF. If one want to include U.S. territories such as Puerto Rico, then I believe that Maria (2017) was also weaker than its official MSW of 135 kt at LF; neither aircraft nor reconnaissance supported such a high MSW several hours prior to LF, and the storm clearly continued to fill up until LF, as it was undergoing an ERC then. I think Maria was closer to 120 kt at LF, despite its low MSLP of 920 mb, given its large size. San Felipe II (Okeechobee) in 1928 produced more severe wind damage near sea level than Maria did.
By contrast, no one can really doubt that Michael was a solid Cat-5, or at the very least a high-end Cat-4, at landfall, given the data at hand, but it was fairly compact.
So it will be interesting to see whether 2021 produces a large and intense Cat-4+ at LF on the CONUS whose MSW is unanimously supported by all the data at hand and agreed on by most or all the contributors here, ranging from the most conservative to the most liberal on matters of classification. Based on the data at hand, I suspect that we are seeing fewer large Cat-4+ hurricanes striking the CONUS than prior to the 1990s, and they are occurring less frequently than they did until the fairly recent past.
1 likes
CVW / MiamiensisWx / Shell Mound
The posts in this forum are NOT official forecasts and should not be used as such. They are just the opinion of the poster and may or may not be backed by sound meteorological data. They are NOT endorsed by any professional institution or STORM2K. For official information, please refer to products from the NHC and NWS.
Considering we have had Harvey, Irma, Michael and Laura strike the CONUS as Category 4 hurricanes in the last 4 years, I don't think so.
14 likes
NCSU B.S. in Meteorology Class of 2021. Tropical weather blogger at http://www.cyclonicfury.com. My forecasts and thoughts are NOT official, for official forecasts please consult the National Hurricane Center.
1. Why do you think the data from back in the day was any more trustworthy than it is now? What about, for example, Ethel '64, which was downgraded by 40 knots in reanalysis?
2. How can you claim that past storms have had more convectively intense cores given that IR satellite data has only matured in the last few decades?
It seems this entire post is premised on the dubious claim that the NHC is substantially overestimating storm intensities. Of course there's been a lot of disagreement on this issue, but you appear to be taking the high-bias side as accepted fact. Also, like, we're talking errors of 5 knots or so here; that hardly changes the picture of hurricane strikes on the US in the past few years.
I also think your suggestion about radar presentations is quite suspicious. All of those old black and white radar images are very high contrast and low resolution, which of courses makes for better looking eyes given the same cloud pattern.
Just because 2020 didn’t have a 2017-like onslaught of Cat 4+ storms on the continental US and its territories doesn’t mean land falling storms are getting weaker. Since 2017, we’ve seen the following majors make landfall either in the CONUS or US territories with at least hurricane force winds: —Harvey ‘17 (115 kt peak and TX landfall) —Irma ‘17 (155 kt peak, 115 kt FL landfall) —Maria ‘17 (150 kt peak, 135 kt PR landfall) —Florence ‘18 (130 kt peak, 80 kt NC landfall) —Michael ‘18 (140 kt peak and FL landfall) —Yutu ‘18 (150/155 kt peak and Marianas landfall) —Dorian ‘19 (160 kt peak, 85 kt NC landfall) —Laura ‘20 (130 kt peak and LA landfall) —Delta ‘20 (120 kt peak, 85 kt LA landfall) —Zeta ‘20 (100 kt peak and LA landfall)
Sally gets an honorable mentioned because it was a borderline major and was an even more destructive storm than Zeta (seriously how did neither of them get retired). With the way 2021 is looking, I don’t think anyone will be asking this question once the season is over.
I am only a meteorology enthusiast who knows a decent amount about tropical cyclones. Look to the professional mets, the NHC, or your local weather office for the best information.
While I am not trying to criticize or downplay your question in any way, it does seem like you are putting a lot of faith into the behavior, appearance, data, etc. of storms in the past when technology was not as sophisticated as now. Also, in recent years, Gulf storms, for example, have shown a tendency to rapidly intensify up until landfall.
4 likes
Unless explicitly stated, all information in my posts is based on my own opinions and observations. Tropical storms and hurricanes can be extremely dangerous. Refer to an accredited weather research agency or meteorologist if you need to make serious decisions regarding an approaching storm.
The discrepancy between the observational tools and techniques of older eras compared to today's technology and how we reconcile these differences in reanalysis and climatatological studies is important and a key point of consideration. However, I'm not sure I follow your assertions.
According to the AOML, the Continental US registered major hurricane impacts from 16 different storms in the 1950s, 60s, and 70s. In the last 30 years, the Continental US registered major hurricane impacts from 17 different storms, and that includes a very anomalous gap between 2006 and 2015 in which no (official) major hurricane struck CONUS. The median landfall pressure of the 1950s-70s majors is 946mb (mean of 944mb) with a median wind of 110kt (mean of 114kt), while the median landfall pressure of the 1991-2020 majors is 942mb (mean of 942mb) with a median wind of 105kt (mean of 112kt). Doing a pretty quick t-test on those datasets with a significance level of 0.05 suggests no statistically significant difference between the two periods.
You suggest that the radar presentation of only a few recent storms compares to the radar presentations of the titans of the mid-20th century whose radar images are now infamous and instantly recognizable in the weather community. While perhaps nebulously true, I would argue that it is rather difficult to compare their radar appearances due to differences in technology and even visualization style. We have very high resolution radar imagery nowadays that can tease out very fine details every few minutes (or in even shorter intervals), and we even have the luxury of applying different colors to different reflectivities instead of trying to judge the brightness of the echoes on a radarscope.
Here's Harvey 2017 near landfall, using KBRO and KHGX (Corpus didn't have a WSR-57D radar). I haven't done any manipulation of the underlying radar data, but I've changed the color scale and blurred the image/added noise to emulate the sorts of radar images we have of historic storms. Can we really make these sorts of judgements about core structure and radar presentation using such massive gaps in quality? This is what you need to keep in mind when comparing radar presentations from today to those of back then. We have the luxury of being able to discern more.
Source: Radar data from NCEI. Visualized using the Integrated Data Viewer. Image edited using GIMP to give it a '60s look.
Audrey was certainly a powerful storm, but I think you may be overstating its radar appearance if you believe that only Andrew, Charley, and Michael in the recent era are comparable. Here's Audrey 1957 with a very hamstrung Laura 2020: I've completely omitted the Lake Charles radar, butchered the quality of the radar in Slidell, and thrown in some noise and blurring. Hopefully this illustrates why it is difficult to compare storms using such wide differences in technology. I could have similarly used a Bret 1999 or even a Sally 2020 and I'd bet a lot of first impressions of radar presentation might change simply because there's no more color differentiation and more noisy/blurry/washed out imagery.
You mentioned that storms from the 1950s, 60s, and 70s had stronger convection and inner cores than today's storms. I'd like to see that data, because satellite quality back then was drastically different than today's fleet of high-resolution polar and geostationary orbiters. You state that Laura produced similar storm surge values as Audrey, but I'd say that the energy required to produce Laura's 18 ft (17.2 ft AGL being the peak high-water-mark) storm surge is greater than Audrey's 11 ft peak (via the SLOSH program; the Corps of Engineers does list a 13.9 ft ASL high-water mark on the Mermentau River). Than 2 meter difference is equivalent to the gap between, say, Betsy 1965 (a Category 4) and Isidore 2002 (a tropical storm) (source), so while they might look to be in the same order of magnitude, that's quite a bit of a power difference. Also, Laura's storm surge may have been higher had it made landfall 20 miles to the west as Audrey did. The 9-12 ft storm surge that Cameron experienced may have turned into 14-22 ft with just a slightly weaker trough.
There's a lot of judgements based on a perceived lack of wind damage in modern storms, but we should expect modern, equivalent storms to impart less severe damage due to newer building codes and better building practices. If not, then perhaps we need to rethink civil engineering. There are some results available on the NOAA Damage Assessment Toolkit for some ground surveys of hurricane wind damage in recent years. You might disagree with their findings in light of recon results, but they did observe that the "surprisingly negligible wind damage" as you mention from Harvey was graded as Category 4 damage. Keep in mind that many of the older storms do not have such immense troves of surface-extrapolated (i.e. SFMR, dropsonde) pre-landfall data, so this is what we have to work with. You could also compare some of the Laura damage survey results with Audrey's wind swath and perhaps you'll notice that, at least with these two sets of data, Laura's inland winds are both stronger and progress farther inland.
While it is true there have been many recent disputes over the actual intensity of recent storms as you alluded to, these arguments are able to flourish because we have such a wide availability of data. For instance, you note that Irma's Category 4 strike on the Keys may have been overestimated based on your assessment of recon's flight level winds, which is a fair and defensible stance given the 120kt peak flight-level winds and 119kt SFMR estimate, which in light of recent SFMR findings might not be quite adequate to support a Category 4 intensity. It's going to be hard to get a storm with everyone and all datasets unanimously agreeing on an intense strength because the storm must be exceptionally strong to ensure that all observations capture the storm's strongest aspects, which typically implies a populated area. It's not like the intense hurricanes of the 50s/60s/70s are indisputable, either. King 1950, for example, had a peak adjusted 10-meter 1-minute sustained wind of 91 kt and a minimum pressure of 957 mb. If we just took that at face value, King's Category 4 intensity wouldn't be very apparent. Gracie 1959, a Category 4 at landfall, had a peak 5-minute surface observation of 84 kt and a recon-measured pressure of 951 mb. I'll note that Florence 2018 had a minimum dropsonde pressure of 958 mb at landfall and 1-minute surface observation of 79 kt, not to say that Florence was a Cat. 4 or that Gracie was a Cat. 1, but to demonstrate that these sorts of 1-to-1 comparisons between storms requires a lot more nuance.
If instead of live, current data, we had a simulation of one of these older storms where the data from historic observations display were updated in real time, I think there would be as much disagreement and debate over the intensity of these storms as there are for current storms.
40 likes
Treat my opinions with a grain of salt. For official information see your local weather service. “It's tough to make predictions, especially about the future.”
TheAustinMan wrote:The discrepancy between the observational tools and techniques of older eras compared to today's technology and how we reconcile these differences in reanalysis and climatatological studies is important and a key point of consideration. However, I'm not sure I follow your assertions.
According to the AOML, the Continental US registered major hurricane impacts from 16 different storms in the 1950s, 60s, and 70s. In the last 30 years, the Continental US registered major hurricane impacts from 17 different storms, and that includes a very anomalous gap between 2006 and 2015 in which no (official) major hurricane struck CONUS. The median landfall pressure of the 1950s-70s majors is 946mb (mean of 944mb) with a median wind of 110kt (mean of 114kt), while the median landfall pressure of the 1991-2020 majors is 942mb (mean of 942mb) with a median wind of 105kt (mean of 112kt). Doing a pretty quick t-test on those datasets with a significance level of 0.05 suggests no statistically significant difference between the two periods.
You suggest that the radar presentation of only a few recent storms compares to the radar presentations of the titans of the mid-20th century whose radar images are now infamous and instantly recognizable in the weather community. While perhaps nebulously true, I would argue that it is rather difficult to compare their radar appearances due to differences in technology and even visualization style. We have very high resolution radar imagery nowadays that can tease out very fine details every few minutes (or in even shorter intervals), and we even have the luxury of applying different colors to different reflectivities instead of trying to judge the brightness of the echoes on a radarscope.
Here's Harvey 2017 near landfall, using KBRO and KHGX (Corpus didn't have a WSR-57D radar). I haven't done any manipulation of the underlying radar data, but I've changed the color scale and blurred the image/added noise to emulate the sorts of radar images we have of historic storms. Can we really make these sorts of judgements about core structure and radar presentation using such massive gaps in quality? This is what you need to keep in mind when comparing radar presentations from today to those of back then. We have the luxury of being able to discern more.
Audrey was certainly a powerful storm, but I think you may be overstating its radar appearance if you believe that only Andrew, Charley, and Michael in the recent era are comparable. Here's Audrey 1957 with a very hamstrung Laura 2020: I've completely omitted the Lake Charles radar, butchered the quality of the radar in Slidell, and thrown in some noise and blurring. Hopefully this illustrates why it is difficult to compare storms using such wide differences in technology. I could have similarly used a Bret 1999 or even a Sally 2020 and I'd bet a lot of first impressions of radar presentation might change simply because there's no more color differentiation and more noisy/blurry/washed out imagery.
You mentioned that storms from the 1950s, 60s, and 70s had stronger convection and inner cores than today's storms. I'd like to see that data, because satellite quality back then was drastically different than today's fleet of high-resolution polar and geostationary orbiters. You state that Laura produced similar storm surge values as Audrey, but I'd say that the energy required to produce Laura's 18 ft (17.2 ft AGL being the peak high-water-mark) storm surge is greater than Audrey's 11 ft peak (via the SLOSH program; the Corps of Engineers does list a 13.9 ft ASL high-water mark on the Mermentau River). Than 2 meter difference is equivalent to the gap between, say, Betsy 1965 (a Category 4) and Isidore 2002 (a tropical storm) (source), so while they might look to be in the same order of magnitude, that's quite a bit of a power difference. Also, Laura's storm surge may have been higher had it made landfall 20 miles to the west as Audrey did. The 9-12 ft storm surge that Cameron experienced may have turned into 14-22 ft with just a slightly weaker trough.
There's a lot of judgements based on a perceived lack of wind damage in modern storms, but we should expect modern, equivalent storms to impart less severe damage due to newer building codes and better building practices. If not, then perhaps we need to rethink civil engineering. There are some results available on the NOAA Damage Assessment Toolkit for some ground surveys of hurricane wind damage in recent years. You might disagree with their findings in light of recon results, but they did observe that the "surprisingly negligible wind damage" as you mention from Harvey was graded as Category 4 damage. Keep in mind that many of the older storms do not have such immense troves of surface-extrapolated (i.e. SFMR, dropsonde) pre-landfall data, so this is what we have to work with. You could also compare some of the Laura damage survey results with Audrey's wind swath and perhaps you'll notice that, at least with these two sets of data, Laura's inland winds are both stronger and progress farther inland.
While it is true there have been many recent disputes over the actual intensity of recent storms as you alluded to, these arguments are able to flourish because we have such a wide availability of data. For instance, you note that Irma's Category 4 strike on the Keys may have been overestimated based on your assessment of recon's flight level winds, which is a fair and defensible stance given the 120kt peak flight-level winds and 119kt SFMR estimate, which in light of recent SFMR findings might not be quite adequate to support a Category 4 intensity. It's going to be hard to get a storm with everyone and all datasets unanimously agreeing on an intense strength because the storm must be exceptionally strong to ensure that all observations capture the storm's strongest aspects, which typically implies a populated area. It's not like the intense hurricanes of the 50s/60s/70s are indisputable, either. King 1950, for example, had a peak adjusted 10-meter 1-minute sustained wind of 91 kt and a minimum pressure of 957 mb. If we just took that at face value, King's Category 4 intensity wouldn't be very apparent. Gracie 1959, a Category 4 at landfall, had a peak 5-minute surface observation of 84 kt and a recon-measured pressure of 951 mb. I'll note that Florence 2018 had a minimum dropsonde pressure of 958 mb at landfall and 1-minute surface observation of 79 kt, not to say that Florence was a Cat. 4 or that Gracie was a Cat. 1, but to demonstrate that these sorts of 1-to-1 comparisons between storms requires a lot more nuance.
If instead of live, current data, we had a simulation of one of these older storms where the data from historic observations display were updated in real time, I think there would be as much disagreement and debate over the intensity of these storms as there are for current storms.
TheAustinMan wrote:You suggest that the radar presentation of only a few recent storms compares to the radar presentations of the titans of the mid-20th century whose radar images are now infamous and instantly recognizable in the weather community. While perhaps nebulously true, I would argue that it is rather difficult to compare their radar appearances due to differences in technology and even visualization style. We have very high resolution radar imagery nowadays that can tease out very fine details every few minutes (or in even shorter intervals), and we even have the luxury of applying different colors to different reflectivities instead of trying to judge the brightness of the echoes on a radarscope.
Here's Harvey 2017 near landfall, using KBRO and KHGX (Corpus didn't have a WSR-57D radar). I haven't done any manipulation of the underlying radar data, but I've changed the color scale and blurred the image/added noise to emulate the sorts of radar images we have of historic storms. Can we really make these sorts of judgements about core structure and radar presentation using such massive gaps in quality? This is what you need to keep in mind when comparing radar presentations from today to those of back then. We have the luxury of being able to discern more.
Audrey was certainly a powerful storm, but I think you may be overstating its radar appearance if you believe that only Andrew, Charley, and Michael in the recent era are comparable. Here's Audrey 1957 with a very hamstrung Laura 2020: I've completely omitted the Lake Charles radar, butchered the quality of the radar in Slidell, and thrown in some noise and blurring. Hopefully this illustrates why it is difficult to compare storms using such wide differences in technology. I could have similarly used a Bret 1999 or even a Sally 2020 and I'd bet a lot of first impressions of radar presentation might change simply because there's no more color differentiation and more noisy/blurry/washed out imagery.
You mentioned that storms from the 1950s, 60s, and 70s had stronger convection and inner cores than today's storms. I'd like to see that data, because satellite quality back then was drastically different than today's fleet of high-resolution polar and geostationary orbiters. You state that Laura produced similar storm surge values as Audrey, but I'd say that the energy required to produce Laura's 18 ft (17.2 ft AGL being the peak high-water-mark) storm surge is greater than Audrey's 11 ft peak (via the SLOSH program; the Corps of Engineers does list a 13.9 ft ASL high-water mark on the Mermentau River). Than 2 meter difference is equivalent to the gap between, say, Betsy 1965 (a Category 4) and Isidore 2002 (a tropical storm) (source), so while they might look to be in the same order of magnitude, that's quite a bit of a power difference. Also, Laura's storm surge may have been higher had it made landfall 20 miles to the west as Audrey did. The 9-12 ft storm surge that Cameron experienced may have turned into 14-22 ft with just a slightly weaker trough.
Personally, I would think that attenuation, in part due to lack of resolution, was greater in the pre-Doppler, pre-NEXRAD radar imagery. Taking that factor into account, I would note that Audrey’s radar presentation is arguably more impressive than Laura’s, because the radar is still hinting at a solidly closed inner eyewall, despite having a much coarser resolution than present-day radar, especially at its distance from the heaviest convection surrounding the inner eye of Audrey at the time. Pre-Doppler radar would have tended to resolve only very strong convection, especially at greater distances from the radar-station. So Audrey’s inner eyewall was likely at least as strong as Laura’s, if not stronger. Even if it were only about as intense as Laura’s, that is phenomenally impressive for a system in June, whereas Laura occurred during the peak of the season and is certainly far less impressive than other peak-season majors that occurred in the same general region over the years. Regarding SLOSH, I prefer actual observations vs. models.
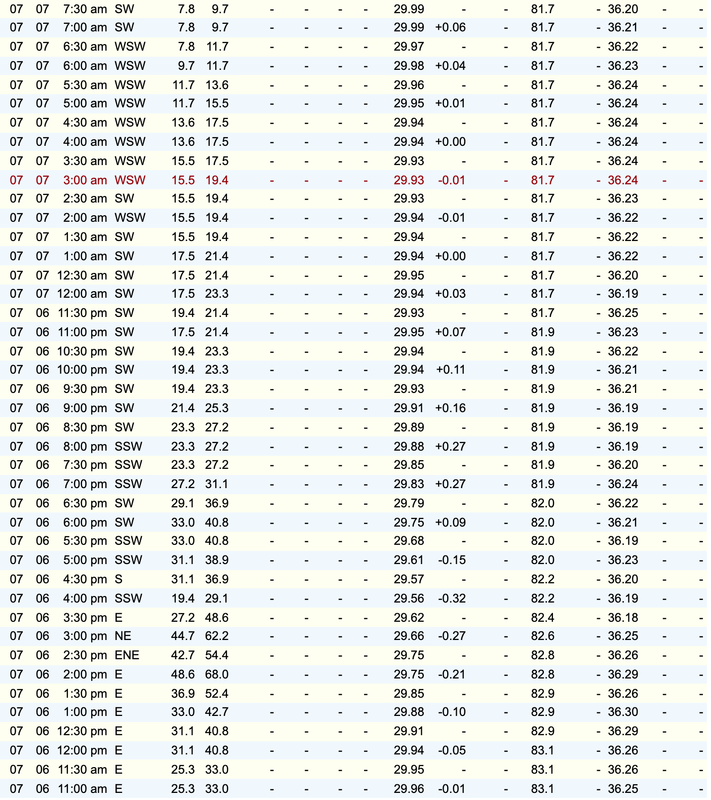
Furthermore, according to NHRP No. 39 (1960, pp. 115 and 122–3), four barges adrift southeast of Cameron, each equipped with an anemometer with a height of 65 ft (~20 m), separately recorded peak gusts ranging from 104 to 130 kt; three of the four barges measured gusts ≥ 126 kt. None of these barges apparently encountered the inner, ~15-n-mi-wide RMW of Audrey, so they likely missed the peak winds in the eastern eyewall. (Audrey apparently had twin wind maxima at landfall, and the barges were in the “moat” between the two.) Based on the official MWR map and related data, Cameron recorded its minimum MSLP of 959 mb at 1430Z on 27 June, during which time MSW (NHRP 1960, p. 116) decreased from 54 kt ESE at 14Z to 50 kt ESE at 15Z while gradually veering. At Cameron the peak MSW prior to landfall was 64 kt ESE at 11Z and the peak MSW after landfall was 60 kt SSW at 17Z. According to the various reports Audrey made LF about ~16 n mi WSW of Cameron and passed ~6 n mi east of Orange, TX.
According to NHRP No. 23 (1958) as well as the MWR, Cameron’s peak storm tide measured 12.1 ft ASL, while Hackberry, located ~12 n mi NNW of Cameron, recorded a peak storm tide of 6.7 ft AGL, along with a minimum MSLP of 958 mb. There apparently were no observations of storm tide between Cameron and Audrey’s point of landfall, certainly not on immediate coastline. Taken together, all the data suggest that Audrey’s MSW passed just west of Cameron and very close to Hackberry. Well after landfall, Winnfield, LA, reported a minimum MSLP of 972 mb and peak MSW of 39 kt ESE, suggesting a close pass to the west of the station, but not directly overhead. ≤ 972 mb at that location would imply ≤ 940 mb at LF, and the reanalysis explicitly mentions this. Yet instead of relying on the data at hand the reanalysis uses NHRP No. 39’s theoretical modelling to estimate 946 mb at LF, matching the original HURDAT. Observations, by contrast, strongly suggest a MSLP at LF of no more than 940 mb, and quite possibly much lower.
Finally, Laura’s surge penetrated up to 30 n mi inland at some points and Audrey’s up to ~25 n mi inland. Given that both Laura and Audrey are officially considered to be “large” storms in terms of wind radii (fetch) at landfall, one would have expected Laura to have produced much higher peak storm-tide values and generated inundation much farther inland than it actually did, in light of Laura’s much greater intensity at LF than Audrey’s, by “official” metrics. Yet Laura’s peak storm tide was ~18 ft ASL and Audrey’s ~14 ft ASL (13.9 ft ASL being measured along the Mermentau River in Audrey’s case). Again, Audrey is “officially” listed as 110 kt (originally 125 kt, prior to reanalysis) / 946 mb (pressure was the same prior to reanalysis as well) at LF and Laura as 130 kt / 939 mb at LF. Yet by all available data Audrey was almost certainly deeper and stronger than Laura at landfall, with a MSLP likely well below 940 mb and possibly as low as the low 920s, based on an “unofficial” report from a ship of 924.5 mb, which fits the large and considerable “range of uncertainty” (919 to 960 mb, though more likely ≤ 940 mb) mentioned by both contemporary “official” reports and the reanalysis project.
Bottom line: there is very good circumstantial evidence, based on actual observations (as opposed to theoretical modelling), that Audrey’s MSLP was in the low 920s as it made landfall in LA, which, given its smaller-than-average “inner” RMW of ≤ 15 n mi and relatively fast forward movement offsetting low environmental pressure, would suggest a high-end Category 4 or borderline Cat-4/-5 in terms of MSW at LF, given that Audrey had apparently been undergoing and completing an ERC while offshore and its inner eye still contracting and intensifying as the storm made landfall. Observations of the winds from Lake Charles, Port Arthur, and Cameron combined suggest that Audrey had both a small inner RMW of ≤ 15 n mi and an outer RMW of ~30 n mi, which fits the pattern of observed storm-surge values, including a wide swath of very high storm tides extending well to the east of the Mermentau River. Radar imagery also indicates that Camille (1969) also exhibited twin wind maxima (eyewalls) at landfall near Waveland, MS, even though the storm was steady or deepening at that time. Audrey was basically a much larger Camille...in June. So much for the notion that “unprecedented” storms did not exist before AGW...but I politely digress.
TheAustinMan wrote:There's a lot of judgements based on a perceived lack of wind damage in modern storms, but we should expect modern, equivalent storms to impart less severe damage due to newer building codes and better building practices. If not, then perhaps we need to rethink civil engineering. There are some results available on the NOAA Damage Assessment Toolkit for some ground surveys of hurricane wind damage in recent years. You might disagree with their findings in light of recon results, but they did observe that the "surprisingly negligible wind damage" as you mention from Harvey was graded as Category 4 damage. Keep in mind that many of the older storms do not have such immense troves of surface-extrapolated (i.e. SFMR, dropsonde) pre-landfall data, so this is what we have to work with. You could also compare some of the Laura damage survey results with Audrey's wind swath and perhaps you'll notice that, at least with these two sets of data, Laura's inland winds are both stronger and progress farther inland.
Regarding Harvey, I was mainly alluding to the damage in and around Rockport, which clearly was not indicative of Category-4 winds, given the lack of extreme vegetative damage and the fact that even relatively frail buildings tended to survive. Only very weak structures sustained significant damage. SFMR only barely registered Cat-4 winds, and those were likely inflated, given near-shore shoaling. As for Harvey’s presentation on radar, I would keep in mind that pre-Doppler radar likely would not have resolved much of the convection closest to Harvey’s eye, given that it appears relatively anaemic even in the retouched image, especially compared to the original, pre-Doppler imagery of storms such as Audrey, to not mention Camille, Celia, and so on. The problem is that damage-based estimates of wind speed tend to be highly subjective without corroboration from surface data or actual structural-engineering tests that simulate the conditions that a particular type of building, tree, etc. encountered during a particular storm at a specific location. As for Audrey, we have no complete wind records from locations that experienced the RMW...for, as mentioned, Cameron, Port Arthur, and Lake Charles were all just outside the inner RMW.
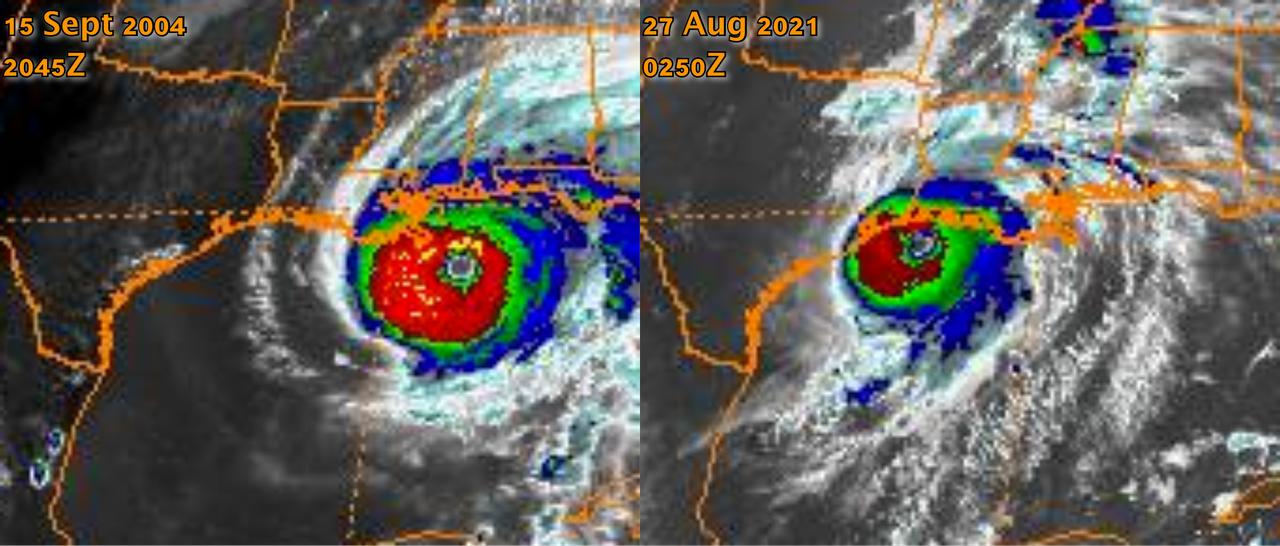
As far as satellite-based estimates are concerned, here is a comparison between Ivan and Laura, respectively, on GOES infrared imagery (excuse the year for Laura):
At 2045Z on 15 September 2004, the ADT CI for Ivan was 6.0 (115 kt), whereas Laura’s ADT CI at 0250Z on 27 August 2020 was 6.4 (125 kt). Yet Ivan’s CDO was clearly more symmetric than Laura’s, its cloud-tops were far colder, and Ivan’s eye was arguably just as warm as Laura’s. Yet Laura’s ADT CI was 10 kt higher than Ivan’s. If anything, Laura’s should have been lower than Ivan’s, not higher. Are ADT estimates calculated differently today? As an aside, Audrey2Katrina made cogent arguments for Laura being a Category 3 at LF, if not its peak. He also questioned Zeta’s intensity at LF (see also this and this). On Elsa’s winds being overdone, see wxman57’s various statements in the thread on Elsa, as well as my points here.
As far as King (18 Oct 1950) is concerned, its RMW was ~3 to 5 n mi during landfall, and the eye made landfall just ~2 n mi to the SSW of the WBO in Downtown Miami. According to the observations from the WBO in Downtown Miami, the instrumentation there recorded 100 kt NE and 962 mb at 0430Z; the minimum MSLP of 957 mb at 0448Z; a “lull” in the wind to 30 kt SE while the station was just inside RMW; and then a maximum one-minute sustained wind (10-m) of 91 kt S at 0538Z. The centre of the eye passed about ~2 n mi west of the WBO, so the RMW’s strongest winds actually occurred a few n mi east of the WBO, over the western portion of Miami Beach and the eastern half of Biscayne Bay. Furthermore, according to the reanalysis’ metadata:
“The size of the eye of King appears to have decreased considerably as it approached Florida.” ... The MWR post-season article shows that the radius of the calm eye was 2.6 miles, and the width of the swath of significant damage caused by this hurricane was only 14 miles wide (confirmed by meteorologists conducting post-storm surverys). King was compared to a "large tornado." ... The central pressure of King deepened by 33 mb during the 14 hr prior to landfall at Miami. The pressure gradient on the northeast side of King was very strong, and there was a very strong high located over the Mid-Atlantic and Northeast coasts of the United States (the pressure at Cape Hatteras was 1027 mb as King approached Miami). The analyzed RMW is 5 nmi, which is tiny compared to the climatological RMW of 17 nmi.
Based on all this, then, the WBO was just west of the strongest winds that occurred in the eastern eyewall of King. Moreover, given the tiny size of King’s eye as well as high ambient pressures, the gradient would have been extremely strong, so winds could have easily varied by 20 kt or more within just a few n mi. Given the data at hand, then, a MSW of 115 kt at landfall is quite reasonable, and even the estimated minimum MSLP of 955 mb at landfall may be at least a few mb too high, given the fact that compact, rapidly deepening systems can feature very pronounced pressure gradients even within the eye, more so if one accounts for localised (mesoscale) vortices, as well as the fact that the WBO in Downtown Miami briefly entered the eastern part of the eye and recorded a minimum MSLP of 957 yet, the winds there never dropped below 30 kt, suggesting a central pressure of no more than 954 mb, based on the “one-mb-per-10-kt” rule used in the reanalysis. Personally, I think King was easily, or at least conceivably, on the order of 951-954 mb at landfall.
As an aside, TheAustinMan, do you have radar imagery of Harvey closer to landfall, as shown here?
1 likes
CVW / MiamiensisWx / Shell Mound
The posts in this forum are NOT official forecasts and should not be used as such. They are just the opinion of the poster and may or may not be backed by sound meteorological data. They are NOT endorsed by any professional institution or STORM2K. For official information, please refer to products from the NHC and NWS.
Shell Mound wrote:Pre-Doppler radar would have tended to resolve only very strong convection
There is no lack of pre-doppler radar snapshots with ground clutter, weak rainbands, and other low-reflectivity phenomena. A convectively weak eyewall would be depicted pretty much the same as an intense one. We have the resolution and range in reflectivity to make these distinctions now, early radar did not. I'm sure systems like Isaias and Hanna would look quite similar to stronger ones like Laura/Audrey.
Shell Mound wrote: one would have expected Laura to have produced much higher peak storm-tide values and generated inundation much farther inland
The inland reach of surge is not indicative of intensity. Audrey tracked further west than Laura and drove peak or near-peak surge directly up Calcasieu Lake (which extends 19 miles inland & lies at sea level). Laura's peak surge, on the other hand, crossed entirely over marshy land. I'm sure you can see why one is more impressive.
Shell Mound wrote:Bottom line: there is very good circumstantial evidence, based on actual observations (as opposed to theoretical modelling), that Audrey’s MSLP was in the low 920s as it made landfall in LA, which, given its smaller-than-average “inner” RMW of ≤ 15 n mi and relatively fast forward movement offsetting low environmental pressure, would suggest a high-end Category 4 or borderline Cat-4/-5 in terms of MSW at LF, given that Audrey had apparently been undergoing and completing an ERC while offshore and its inner eye still contracting and intensifying as the storm made landfall. Observations of the winds from Lake Charles, Port Arthur, and Cameron combined suggest that Audrey had both a small inner RMW of ≤ 15 n mi and an outer RMW of ~30 n mi, which fits the pattern of observed storm-surge values
I'm not sure why you cite surge to support an intensity in the low 920s. A low 920s landfall on this stretch of coast, especially with a system undergoing broadening via ERC, would be in excess of 20 feet. That is well beyond what one can assume with undersampling. Peak surge does not always occur in the RMW, it occurs wherever flow is both directly perpendicular to the coastline and at its maximum. It's also worth noting the difference between storm tide and storm surge. One is measured above MHHW, the other is simply an elevation from the average. They can be separated by 4ft+ especially if tides align.
Considering 959mb was observed in Cameron, which clearly received part of the inner eyewall based on radar loops, it's very difficult to argue for a sub-930 pressure. Pressure gradient strongly levels off in the eye of a storm, in which the 1mb/10kt rule is usually applied. That would imply a record eyewall gradient exceeding storms like Dorian, which seems very unlikely considering Audrey's just below average eye and ongoing ERC. If the 924.5mb measurement had ANY credibility it would receive an official mention. A lack of calibration is very common.
Shell Mound wrote:At 2045Z on 15 September 2004, the ADT CI for Ivan was 6.0 (115 kt), whereas Laura’s ADT CI at 0250Z on 27 August 2020 was 6.4 (125 kt). Yet Ivan’s CDO was clearly more symmetric than Laura’s, its cloud-tops were far colder, and Ivan’s eye was arguably just as warm as Laura’s. Yet Laura’s ADT CI was 10 kt higher than Ivan’s. If anything, Laura’s should have been lower than Ivan’s, not higher. Are ADT estimates calculated differently today?
Yes, ADT's algorithm has changed. Satellites have also improved in resolution allowing them to better resolve eye temps (though Laura's was warmer at that point regardless). For what it's worth, Ivan's CI hit 6.8 during its peak which is much higher than Laura's.
Shell Mound wrote:Regarding Harvey, I was mainly alluding to the damage in and around Rockport, which clearly was not indicative of Category-4 winds, given the lack of extreme vegetative damage and the fact that even relatively frail buildings tended to survive.
It should be noted, however, that the northeastern quadrant
of the hurricane came ashore in an unpopulated and unmonitored area near San Jose Island and
Matagorda Island, including Aransas National Wildlife Refuge, and the maximum winds were
probably not sampled by any anemometer.
Rockport is 8 miles inland from the coast, separated from the barrier island by a small bay. This is more than enough for land friction to take effect and reduce winds. They did not receive the RMW and were also on the weaker south side of the storm. High-end category 2 is probably around the wind most of Rockport received, barring mesovort gusts. Aransas Pass recorded 96kt, well outside the RMW - on the southern rim of Harvey's eyewall. This is perfectly in line with recon SMFR - they peaked at 90-100kt on Harvey's south side. With a landfall pressure of 938mb Harvey is in the company of strong category four hurricanes, many even larger than the storm - Knaff-Zehr corroborates this. 700mb flight level reduction, SFMR pre-shoaling (no, waves do not break 30 miles offshore south Texas) and wind-pressure relationships all strongly support a category 4 Harvey. As with every other high-end hurricane, it is accepted that maximum winds occur on an unsampled beach, otherwise Audrey would go down as a low-end category 1.
So, "Are the strongest US hurricanes getting smaller and/or weaker?" Well, they're not getting smaller. Frances, Wilma, and Irma were all enormous hurricanes at landfall. So are they getting weaker? Easiest standard to use is landfall pressure. Barometers are just about the only tool of observation reliable back to the 19th century, as long as they are well-calibrated. Of the 10 most intense US landfalling canes, 3 struck within the last 30 years. Even assuming a strong weak-bias for storms before this period, that is at least a continuation of historical pace. So no, US hurricanes have not been getting weaker.
Your posts use a smattering of observations varying in credibility/official status, the gaps filled in with logical leaps and conclusions as if the mere presence of a citation supports them. And the tone constantly implies a superiority towards the NHC and associated agencies. We're just weather enthusiasts. They know better.
14 likes
Kendall -> SLO -> PBC
Memorable Storms: Katrina (for its Florida landfall...) Wilma Matthew Irma
Considering we've had 4 cat 4+ landfalls on the CONUS in the past 4 years, no, probably not getting weaker. And there is absolutely no evidence to suggest Audrey was stronger than Laura at landfall. Using 1950s radar to say such as beyond laughable imo. Laura was most certainly 130 knots at landfall based on all the data we have.
Beauty (or in this case radar appearance) is in the eye of the beholder, so we could go on and on and on trying to argue storm X looks better than storm Y without going anywhere. That wasn't my point. The problem with comparing radar looks between old and new storms using these images is because it inherently allows a greater leeway to stronger biases for older storms. Because older storms have lower quality data, you have more leeway to simply assume or extrapolate the existence of features that might not actually exist. Assuming attenuation, you extrapolated that Audrey had a "solidly closed inner eyewall". I could just as easily make handwavey arguments, supposing that dry air undercut the storm at the mid-levels with some disruption from an eyewall replacement cycle, leaving behind only the remnant upper-level echoes, resulting in an open appearance at landfall, with only a more coherent structure revealed only when the Alexandria radar activated and could see the weaker, lower-level returns inland with ground friction allowing for greater moisture convergence. On the other hand, we can nitpick more modern storms in excruciating detail, where every blemish can be identified. You mention for example that Harvey's eye looks "anaemic"; that's partly a result of powerful mesovortices that could be observed at both KCRP and KBRO punching through 15,000 ft. Personally I'm not really getting any sense of anaemia from looking at that image, but agree to disagree. Even if we were to imagine Audrey having a complete radar eyewall, assuming that it suddenly means that Audrey's inner eyewall is suddenly as strong if not stronger than Laura's seems like quite a leap in judgement. I mean, it could be true, but I don't think we're going to convince anyone using these low-resolution radarscope images with large coverage gaps. It's an even larger leap in judgement to use that sort of logic to make the broader claim that the strongest storms nowadays are just collectively weaker.
I don't think anyone is disputing how anomalous Audrey was, being the strongest ATL June TC on record and the second deadliest CONUS hurricane since weather radar became a thing. That said, I'm not sure where the idea that Laura is somehow "certainly far less impressive than other peak-season majors that occurred in the same general region over the years" came from, especially considering that Laura rapidly intensified by 55kt in 24 hours, produced the highest storm surge ever recorded in southwest Louisiana (list), and within the top 10 highest surges ever recorded in the US. And if we use the official database, Laura is the strongest hurricane to strike Louisiana since Camille (and the strongest ever for southwest Louisiana) so I'm not sure what makes Laura "certainly far less impressive". A dropsonde also recorded a 142 kt surface gust (and 151 kt averaged over the lowest 150 gpm) so Laura was certainly no slouch. I used SLOSH because it provides surge in terms of inundation above ground level, which is what the ArcGIS recap of Laura's surge also did, so I was trying to be fair because the vocabulary concerning storm surge, tide, and inundation is very precise and can mean different things; the 13.9 ft value I mentioned is above sea level, as you and I both noted. Regardless this is still quite lower than the 18 ft above ground level inundation that occurred in Laura (or the 17.1 ft high-water mark measured). Hurricane Laura also approached the coast at a more oblique angle and at a faster speed, so if anything Audrey's slower and more perpendicular motion gave its surge a slight "advantage".
I won't speak much about comparing Audrey and Laura specifically, or reanalyzing Audrey, because that wasn't the point of my post. Ditto King and Gracie: I wasn't saying they weren't intense, only that the lack of data leaves wiggle room for derivation/extrapolation that could foster just as much lively debate as more recent storms. The outright dismissal of Laura as being far less impressive just seemed strange, if not bizarre. Just be cautious of using wind gusts to compare storms: after all, Hurricane Gustav had a verified 184 kt wind gust.
Much has been said about how satellite estimates, while quite powerful and useful, have their shortfalls, and shouldn't be assumed as a baseline when more direct observations are present (unless you have convincing reason to believe that every single observation and related impact is giving unreliable results, which seems unlikely). Dorian was notably not a 125kt 936mb storm when it hit the Bahamas as the ADT CI of 6.4 might suggest, and Eta's mindboggling convective strength didn't suddenly make it the strongest Atlantic TC of all time. The 0310z center fix VDM from Laura had peak flight level winds of 145kt and a 938mb pressure. The 2012z center fix VDM from Ivan had flight-level winds of 122 kt and a 933mb pressure. That information should supersede comparative judgements of intensity based solely on looks.
As for radar data, NEXRAD data is freely available at https://www.ncdc.noaa.gov/nexradinv/map.jsp and can be visualized using a free viewer such as the NOAA Weather and Climate Toolkit. As an aside, you also mentioned Eloise as part of your group of storms matched by only Andrew, Charley, and Michael in recent times. Do you have an example? I'm having trouble finding Eloise radar imagery... well, there's this (from the service assessment) and I'm not seeing what you're seeing. Ditto Celia 1970.
16 likes
Treat my opinions with a grain of salt. For official information see your local weather service. “It's tough to make predictions, especially about the future.”
I would just point out that between 2004 and 2021 we switched satellites to one that takes much higher rez photos and much more often. It also has a better dynamic range and will not show the same color analysis that the old GOES16 did.
10 likes
M a r k - - - - - Join us in chat: Storm2K Chatroom Invite. Android and IOS apps also available.
The posts in this forum are NOT official forecasts and should not be used as such. Posts are NOT endorsed by any professional institution or STORM2K.org. For official information and forecasts, please refer to NHC and NWS products.
Shell Mound wrote:Pre-Doppler radar would have tended to resolve only very strong convection
There is no lack of pre-doppler radar snapshots with ground clutter, weak rainbands, and other low-reflectivity phenomena. A convectively weak eyewall would be depicted pretty much the same as an intense one. We have the resolution and range in reflectivity to make these distinctions now, early radar did not. I'm sure systems like Isaias and Hanna would look quite similar to stronger ones like Laura/Audrey.
Assuming attenuation, you extrapolated that Audrey had a "solidly closed inner eyewall". I could just as easily make handwavey arguments, supposing that dry air undercut the storm at the mid-levels with some disruption from an eyewall replacement cycle, leaving behind only the remnant upper-level echoes, resulting in an open appearance at landfall, with only a more coherent structure revealed only when the Alexandria radar activated and could see the weaker, lower-level returns inland with ground friction allowing for greater moisture convergence. ... Even if we were to imagine Audrey having a complete radar eyewall, assuming that it suddenly means that Audrey's inner eyewall is suddenly as strong if not stronger than Laura's seems like quite a leap in judgement. I mean, it could be true, but I don't think we're going to convince anyone using these low-resolution radarscope images with large coverage gaps. It's an even larger leap in judgement to use that sort of logic to make the broader claim that the strongest storms nowadays are just collectively weaker.
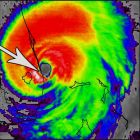
At 0:29 one can clearly see a “moat” surrounding the inner eye of Carla. However, at 0:31, the “moat” seems to melt back into the surrounding convection as Carla nears. This does not appear to be solely related to an optical illusion, because a few seconds later one can see convection rotating in the moat around the inner eyewall. So Carla’s inner eyewall was apparently connected to the surrounding convection, with only a slight decrease in the intensity of precipitation between bands, but far from a true “moat,” as intense convective activity was very closely spaced, with only very narrow “breaks,” more properly slight “lulls,” between peak precipitation cores. As mentioned previously, I suspect that attenuation at greater distances was more common in pre-Doppler radar, which sometimes failed to detect all but the strongest convection, primarily at greater distances.
Regarding Audrey, the following radar-based image from Alexandria, LA, at 19Z on 27 June 1957—almost five hours after landfall—suggests a symmetric, closed, and rather intense inner eyewall. Moreover, the apparent “opening” on the western side is likely an illusion created by attenuation, as one can see convection to the immediate south and north, in the “moat” surrounding the inner eyewall. This also strongly suggests that the apparent “intrusion” of dry air during landfall approximately five hours earlier was an illusion, as imagery both prior to and after landfall suggests that little or no dry-air intrusion was occurring. As with Carla, I suspect that Audrey was featuring much more intense, closely spaced convective bands than we have seen in the most intense storms of recent years, suggesting that the largest and most intense storms of the pre-Doppler past were indeed more vigorous than today’s:
TheAustinMan wrote:
Ubuntwo wrote:
Shell Mound wrote: one would have expected Laura to have produced much higher peak storm-tide values and generated inundation much farther inland
The inland reach of surge is not indicative of intensity. Audrey tracked further west than Laura and drove peak or near-peak surge directly up Calcasieu Lake (which extends 19 miles inland & lies at sea level). Laura's peak surge, on the other hand, crossed entirely over marshy land. I'm sure you can see why one is more impressive.
That said, I'm not sure where the idea that Laura is somehow "certainly far less impressive than other peak-season majors that occurred in the same general region over the years" came from, especially considering that Laura rapidly intensified by 55kt in 24 hours, produced the highest storm surge ever recorded in southwest Louisiana (list), and within the top 10 highest surges ever recorded in the US. And if we use the official database, Laura is the strongest hurricane to strike Louisiana since Camille (and the strongest ever for southwest Louisiana) so I'm not sure what makes Laura "certainly far less impressive". ... I used SLOSH because it provides surge in terms of inundation above ground level, which is what the ArcGIS recap of Laura's surge also did, so I was trying to be fair because the vocabulary concerning storm surge, tide, and inundation is very precise and can mean different things; the 13.9 ft value I mentioned is above sea level, as you and I both noted. Regardless this is still quite lower than the 18 ft above ground level inundation that occurred in Laura (or the 17.1 ft high-water mark measured). Hurricane Laura also approached the coast at a more oblique angle and at a faster speed, so if anything Audrey's slower and more perpendicular motion gave its surge a slight "advantage".
There is very little variation in elevation in Southwestern Louisiana, much less between sea level and marshland. According to its TCR (p. 6), Laura’s peak high-water mark of 17.2 ft AGL occurred in Oak Grove, LA, a part of Creole. According to Google Earth the highest elevation in Oak Grove is 2 m (~7 ft) ASL. Moreover, Oak Grove is apparently partly sited on fill or spoil material, being located at the end of a dredged canal, which can contribute to the “piling up” of water; a similar situation could have occurred along the Mermentau River during Audrey, resulting in the peak measurement of 13.9 ft ASL there, though I suspect that dredging and canalisation was less developed in 1957 than in the 1960s and later, so artificial contributions to water heights might have been less back then. So the difference between MSL and ground level in the marshy lands in and around Creole, to not mention across the entirety of coastal Southwestern Louisiana, is negligible, contributing only ±2 m (usually ≤ 1 m and often far less, especially away from canals and artificial embankments). When the lower level of infrastructure and development in 1957 vs. 2020 is taken into account, Audrey’s high-water marks come across as being at least as or even more impressive than Laura’s.
Ubuntwo wrote:
Shell Mound wrote:Bottom line: there is very good circumstantial evidence, based on actual observations (as opposed to theoretical modelling), that Audrey’s MSLP was in the low 920s as it made landfall in LA, which, given its smaller-than-average “inner” RMW of ≤ 15 n mi and relatively fast forward movement offsetting low environmental pressure, would suggest a high-end Category 4 or borderline Cat-4/-5 in terms of MSW at LF, given that Audrey had apparently been undergoing and completing an ERC while offshore and its inner eye still contracting and intensifying as the storm made landfall. Observations of the winds from Lake Charles, Port Arthur, and Cameron combined suggest that Audrey had both a small inner RMW of ≤ 15 n mi and an outer RMW of ~30 n mi, which fits the pattern of observed storm-surge values
I'm not sure why you cite surge to support an intensity in the low 920s. A low 920s landfall on this stretch of coast, especially with a system undergoing broadening via ERC, would be in excess of 20 feet. That is well beyond what one can assume with undersampling. Peak surge does not always occur in the RMW, it occurs wherever flow is both directly perpendicular to the coastline and at its maximum. It's also worth noting the difference between storm tide and storm surge. One is measured above MHHW, the other is simply an elevation from the average. They can be separated by 4ft+ especially if tides align.
Considering 959mb was observed in Cameron, which clearly received part of the inner eyewall based on radar loops, it's very difficult to argue for a sub-930 pressure. Pressure gradient strongly levels off in the eye of a storm, in which the 1mb/10kt rule is usually applied. That would imply a record eyewall gradient exceeding storms like Dorian, which seems very unlikely considering Audrey's just below average eye and ongoing ERC. If the 924.5mb measurement had ANY credibility it would receive an official mention. A lack of calibration is very common.
As I noted earlier, the reanalysis mentioned that Winnfield, LA, recorded a minimum MSLP of 972 mb at 00Z on 28 June, nearly ten hours after landfall. The reanalysis calculated that a MSLP of 972 mb so far inland would suggest a MSLP of no more than 940 mb at landfall. This was among several possible values calculated for Audrey’s estimated MSLP at landfall, ranging from a possible minimum (lower bound) of 919 mb to a possible maximum (upper bound) of 960 mb. Winnfield’s peak observed MSW occurred from the east-southeast, suggesting that Audrey’s centre passed just to its west. Audrey was moving due N at LF, yet peak observed water marks occurred E (and likely W) of Cameron.
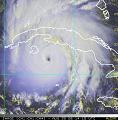
Based on radar imagery ~1h pre-LF, Cameron actually appears to have encountered the eastern edge of Audrey’s inner eyewall, so the RMW passed a bit to its west:
As far as pressure gradients inside the RMW (eye) are concerned, the 1947 Fort Lauderdale hurricane featured a strong pressure gradient inside its eye. Hillsboro Inlet Lighthouse was located just inside the RMW, near the northern edge of the eye, and recorded a brief decrease in the winds, along with an adjusted minimum MSLP of 947 mb. To its immediate west, a private barometer at Cap’s Place in present-day Lighthouse Point measured 945 mb. Farther south, three separate stations in and near Fort Lauderdale, which was closest to the centre of the eye and reported a lull of one hour and fifteen minutes, registered minimum MSLP values ranging from 951 to 956 mb.
Ubuntwo wrote:
Shell Mound wrote:At 2045Z on 15 September 2004, the ADT CI for Ivan was 6.0 (115 kt), whereas Laura’s ADT CI at 0250Z on 27 August 2020 was 6.4 (125 kt). Yet Ivan’s CDO was clearly more symmetric than Laura’s, its cloud-tops were far colder, and Ivan’s eye was arguably just as warm as Laura’s. Yet Laura’s ADT CI was 10 kt higher than Ivan’s. If anything, Laura’s should have been lower than Ivan’s, not higher. Are ADT estimates calculated differently today?
Yes, ADT's algorithm has changed. Satellites have also improved in resolution allowing them to better resolve eye temps (though Laura's was warmer at that point regardless).
These two GOES IR images, taken from the GIBBS archive, seemingly rely on the same temperature-scale, even though the image of Ivan was taken by GOES 12 and that of Laura by GOES 16. Even so, considering the latter’s higher resolution, Laura’s presentation should have been more impressive than Ivan’s, given that Laura was officially 15 kt stronger than Ivan at the time its image was taken. Ivan (left) clearly appears to be more intense than Laura (right), yet Ivan’s ADT CI was 115 kt at this time, while Laura’s was 125 kt. Notably, Ivan’s overall circulation and CDO are more symmetric than Laura’s, and Ivan was then encountering less vertical wind shear in its eastern and western quadrants, respectively, than Laura was, and featured considerably colder cloud-tops. I think the ADT CI should be reversed: Ivan should be assigned 125 kt and Laura 115 kt.
Ubuntwo wrote:
Shell Mound wrote:Regarding Harvey, I was mainly alluding to the damage in and around Rockport, which clearly was not indicative of Category-4 winds, given the lack of extreme vegetative damage and the fact that even relatively frail buildings tended to survive.
It should be noted, however, that the northeastern quadrant
of the hurricane came ashore in an unpopulated and unmonitored area near San Jose Island and
Matagorda Island, including Aransas National Wildlife Refuge, and the maximum winds were
probably not sampled by any anemometer.
Rockport is 8 miles inland from the coast, separated from the barrier island by a small bay. This is more than enough for land friction to take effect and reduce winds. They did not receive the RMW and were also on the weaker south side of the storm. High-end category 2 is probably around the wind most of Rockport received, barring mesovort gusts. Aransas Pass recorded 96kt, well outside the RMW - on the southern rim of Harvey's eyewall. This is perfectly in line with recon SMFR - they peaked at 90-100kt on Harvey's south side. With a landfall pressure of 938mb Harvey is in the company of strong category four hurricanes, many even larger than the storm - Knaff-Zehr corroborates this. 700mb flight level reduction, SFMR pre-shoaling (no, waves do not break 30 miles offshore south Texas) and wind-pressure relationships all strongly support a category 4 Harvey. As with every other high-end hurricane, it is accepted that maximum winds occur on an unsampled beach, otherwise Audrey would go down as a low-end category 1.
You are correct about Harvey. I gracefully retract my earlier statements.
Ubuntwo wrote:So, "Are the strongest US hurricanes getting smaller and/or weaker?" Well, they're not getting smaller. Frances, Wilma, and Irma were all enormous hurricanes at landfall. So are they getting weaker? Easiest standard to use is landfall pressure. Barometers are just about the only tool of observation reliable back to the 19th century, as long as they are well-calibrated.
None of those three hurricanes counts as among the strongest U.S. hurricanes by MSW at LF, and only Irma, with its minimum MSLP of 931 mb on Cudjoe Key, FL, is listed among the most intense by MSLP at LF. As I have mentioned earlier, I think Irma was more probably 110 kt, or high-end Category 3, at landfall in the Florida Keys than 115 kt, or low-end Category 4, based on a blend of radar velocities and aircraft data during landfall. 110 kt would also fit the filling rate observed by reconnaissance between the Straits of Florida north of Cuba, where Irma’s minimum MSLP briefly dipped to 928 mb (coincident with reconnaissance data supporting MSW of 115 kt) over the Gulf Stream, and Irma’s final landfall on Marco Island, FL, where storm chasers indicated a MSLP of 936 mb in the eye and MSW of 100 kt, based on a one-minute observation of 97 kt at 10 m. I would venture that Irma weakened by 5 kt per every 2 mb of filling between the Straits and Marco Island, which would support 110 kt in the Keys and 100 kt on Marco Island. Furthermore, post-storm surveys by the NWS in Key West derived estimated peak representative wind gusts of ~113 kt on Big Pine Key, which experienced the eastern eyewall and the strongest winds of Irma. Those gusts would correspond to ~87 kt MSW on land. Assuming slightly stronger winds just to the east, over water between Big Pine and Bahia Honda Keys—over and/or around Spanish Harbour, Big Mangrove, and No Name Keys—would correspond perfectly with 110 kt.
Ubuntwo wrote:Your posts use a smattering of observations varying in credibility/official status, the gaps filled in with logical leaps and conclusions as if the mere presence of a citation supports them. And the tone constantly implies a superiority towards the NHC and associated agencies. We're just weather enthusiasts. They know better.
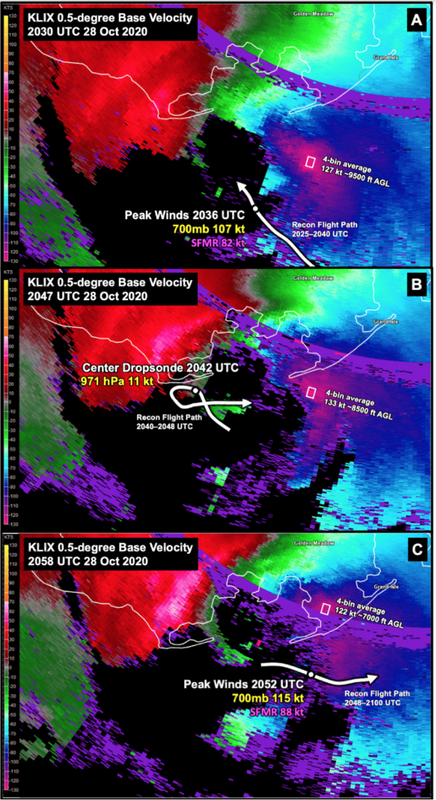
While I do respect the professionals at the NHC, upon recent examination I have had some questions about recent classifications. Regarding Zeta, for instance:
This image was taken from Zeta’s TCR. According to both the above and radar loops, Zeta’s peak radar velocities clearly struck Port Fourchon, LA, at ~2045Z:
0:26 in the above loop corresponds to the peak radar velocities in the figure from the TCR, and shows the maximum velocities heading through Port Fourchon and passing east of Golden Meadow. According to the TCR, Golden Meadow measured peak 1-min MSW of ~82 kt at 2139Z (peak gust: 96 kt), its anemometer being sited 6 m AGL. The TCR also notes that a levee breached and caused some localised flooding in and around Port Fourchon and Golden Meadow, but nothing particularly extreme. Nearby, an anemometer in Cocodrie measured ~67 kt NNW 1-min MSW at 2130Z, and another instrument in Port Fourchon measured ~76 kt SE 1-min MSW at 21Z. Furthermore, here are some images of the damage in and around Port Fourchon, Golden Meadow, and Leeville:
None of these images shows wind-caused damage that would be suggestive of anything stronger than sustained Category-1 winds. Some power poles were downed, possibly by surge and/or wave in some cases, but not snapped; metal structures were blown down; and some shingles and loose coverings were blown loose. Several of these images were taken in Port Fourchon, which should have experienced low-end Category-3 winds, per radar. Even the images from Golden Meadow do not suggest anything stronger than low-end Category-1 winds, with barely any damage to vegetation, structures, or power poles. I experienced low-end sustained Cat-1 conditions during Wilma in Boca Raton, FL, back in 2005, and even these caused far more serious damage to utilities, roofs, screens, trees, and shrubs than anything in the images from Zeta shown above.
Taken together, the data suggest that the radar velocities were mesoscale in nature and not representative of Zeta’s surface winds. Reanalysis may be necessary.
As far as Elsa is concerned, it was certainly a hurricane over the Lesser Antilles, but after that point I think its winds were largely overestimated. Case in point:
This image shows conditions at Buoy 41023 while Elsa passed nearly overhead. The buoy was located over the eastern Gulf of Mexico, and Elsa passed closest by on 6 July 2021. While the NHC indicated that the centre passed just east of the buoy, the actual observations from the buoy suggested that the centre passed just to the west. Furthermore, while the NHC upgraded Elsa to a hurricane at that point based on radar velocities, observations from the buoy, which sampled the strongest quadrant of N-moving Elsa, suggested that MSW were only around 55 kt rather than 65 kt at that time. Perhaps Elsa is another storm that merits reevaluation in the future.
1 likes
CVW / MiamiensisWx / Shell Mound
The posts in this forum are NOT official forecasts and should not be used as such. They are just the opinion of the poster and may or may not be backed by sound meteorological data. They are NOT endorsed by any professional institution or STORM2K. For official information, please refer to products from the NHC and NWS.
I don't understand what your after here shell mound. I reject the premise that there is a trend of smaller or weaker. There's not a lot of data to go on, when you think of how much data is required when dealing with natural disturbances, and much of what you are showing is via radars with what looks like 1 bit dynamic range.
Elsa
Back in my day I used to have to walk to school uphill, both ways. Snow storms used to be bigger. Hurricanes used to be stronger.
Are you working from a hypothesis to try and reach a conclusion, or do you have a conclusion and are trying to fit an explanation into it? In other words, are you convinced US hurricanes are weaker and are trying to prove this? That's an easy way to be pre-biased and doesn't usually lend to an interesting discussion.
I reject the premise that US landfalling hurricanes are getting weaker. I also rejected the premise a few years ago that the US would never again see a major hurricane. I don't think comparing radar pictures works in this case due to the wildly different technologies used, and I have no idea how satellite color, applied to varying pixel brightness, has or has not been adjusted over the years. I have seen it written that the maximum possible heights of cloud tops will vary throughout the year and is dependent on location but I haven't done any research into this.
In my opinion those are good starting places.
9 likes
M a r k - - - - - Join us in chat: Storm2K Chatroom Invite. Android and IOS apps also available.
The posts in this forum are NOT official forecasts and should not be used as such. Posts are NOT endorsed by any professional institution or STORM2K.org. For official information and forecasts, please refer to NHC and NWS products.
I think a lot of it is down to luck. Despite the spate of U.S. major hurricane landfalls in 2004-05, cooler shelf waters along with an antecedent weather pattern that allowed for shear and dry air intrusion on final approach weakened Ivan, Dennis, Katrina and Rita and in my opinion - along with Opal back in 1995 - helped create the (mis)perception that intense major hurricanes "must" or "always" weaken on approach to the northern Gulf coast, or at the least not be able to rapidly intensify. Obviously Michael proved this incorrect, along with some of the systems in 2020.
Floyd back in 1999 was thought to be a potential "giant Andrew," but recurved before reaching Florida. Tracking storms on here in recent years has helped me develop a new appreciation for how just slight differences in the timing/amplitude of a trough/ridge can be the difference in a TC recurving - or not - differences which can be tough to pin down several days in advance even with today's modeling, let alone that of 20+ years ago. More recently, Irma became very large post-Lesser Antilles due to multiple ERCs, while maintaining at least high-end Category 4 intensity. If the ridge had been just slightly weaker, it would have continued to track northwest from the Turks and Caicos into that extremely high OHC water in the southern Bahamas and Florida Straights, where multiple runs of multiple models had portrayed it into the 880s MB (likely overdone, but its satellite presentation just as it was about to slam into Cuba indicated that they probably weren't totally farfetched ).
On the flip side, we got rather unlucky to have two Category 4+ landfalls on the CONUS in a span of three years during a -AMO period, one of them in a season which featured only seven total NS. Probably the most anomalous thing that occurred in my lifetime related to Atlantic TC landfalls was the MH landfall drought from Wilma (2005) to Harvey (2017). In that span we saw Ike, Irene and Sandy, all of them huge, unwound sloshmakers which while highly impactful and costly, I agree they aren't as meteorologically interesting as perfectly formed stadium eyewalls with -80c cloud tops and tornado-like mesovortices.
tolakram wrote:I have seen it written that the maximum possible heights of cloud tops will vary throughout the year and is dependent on location but I haven't done any research into this.
Cloud top temps vary alongside troposphere heights throughout the year. As the season drags on convection usually looks "cooler". Earlier season storms like Laura and Dorian have warmer tops than those in late September and especially October-November. A good example of this is Eta last year, where deep convection typical of a 160 kt typhoon did not translate to a category 5 intensity.
5 likes
Kendall -> SLO -> PBC
Memorable Storms: Katrina (for its Florida landfall...) Wilma Matthew Irma
tolakram wrote:I have seen it written that the maximum possible heights of cloud tops will vary throughout the year and is dependent on location but I haven't done any research into this.
Cloud top temps vary alongside troposphere heights throughout the year. As the season drags on convection usually looks "cooler". Earlier season storms like Laura and Dorian have warmer tops than those in late September and especially October-November. A good example of this is Eta last year, where deep convection typical of a 160 kt typhoon did not translate to a category 5 intensity.
Just curious, how does that explain Iota then? I remember that after Eta, people were saying Iota would have some extremely cool cloud tops due to November troposphere. But that didn't happen and Iota actually looked like a "normal" high end C4/low end C5 on IR, unlike Eta.


