Same gif except comparing 1 July 2017/2020 with today.

Moderator: S2k Moderators


weeniepatrol wrote:
Same gif except comparing 1 July 2017/2020 with today.
https://i.imgur.com/kF32Nx1.gif


Category5Kaiju wrote:Hey you know, Mark Sudduth brings up a great point in his video, and I would like to know more about it from somebody who might be more knowledgable than me. It definitely makes me curious.
Why did 2010 feature so many recurves? I mean, if you looked at storm tracks alone you would've probably figured that it happened during a warm ENSO phase or an El Nino, but clearly that was not the case.


NotSparta wrote:Category5Kaiju wrote:Hey you know, Mark Sudduth brings up a great point in his video, and I would like to know more about it from somebody who might be more knowledgable than me. It definitely makes me curious.
Why did 2010 feature so many recurves? I mean, if you looked at storm tracks alone you would've probably figured that it happened during a warm ENSO phase or an El Nino, but clearly that was not the case.
The reason 2010's MDR was so warm was a wildly negative NAO during the winter. This carried into the summer which meant more troughing and recurving storms


Stratton23 wrote:SFLcane agreed, but man is that an ominous look from the euro, buckle up folks
SFLcane wrote:Stratton23 wrote:SFLcane agreed, but man is that an ominous look from the euro, buckle up folks
Yea for sure i just think there is time for things to go the other way. I need another round or two from the climate models. We shall see.
SFLcane wrote:Nothing is ever a sure thing in weather.
https://x.com/BenNollWeather/status/1787556232221606095


Teban54 wrote:SFLcane wrote:Nothing is ever a sure thing in weather.
https://x.com/BenNollWeather/status/1787556232221606095
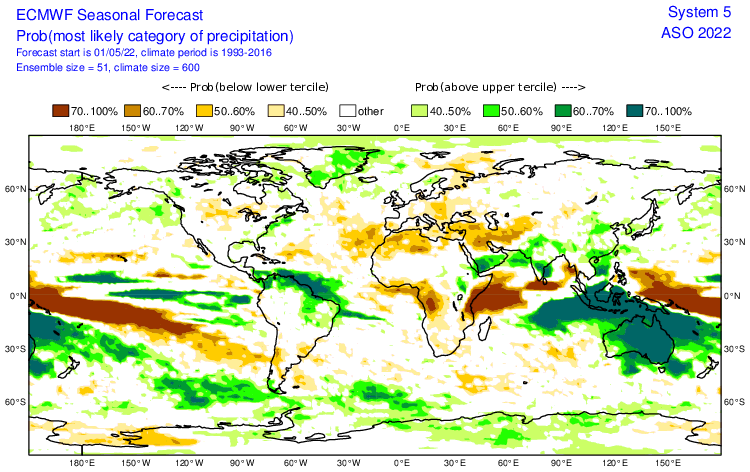
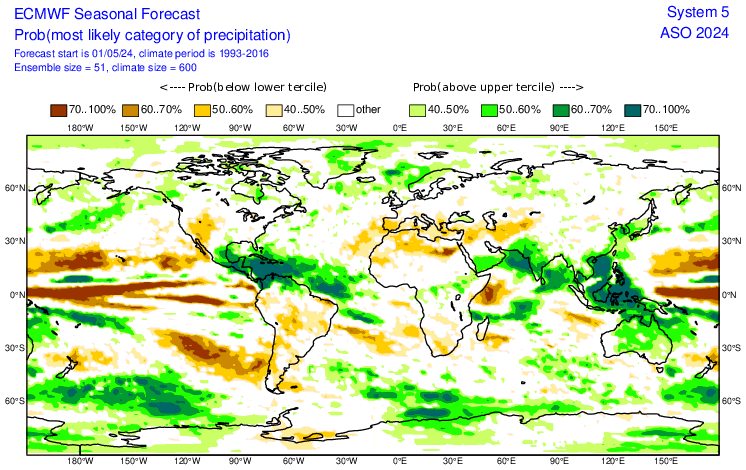
Does anyone recall examples of the other way round, where ECMWF shows high precipitation anomalies only for the season to turn out much less active? (Other than extreme bust years like 2013, of course)
I did a quick look at the ECMWF's official site which has data up to 2017. The only notable one I could find was 2022, which shows a rather extensive chunk of wet anomalies just north of South America. However, they seem rather localized and suppressed to the south, while 2024's forecast is much more extensive with wet anomalies all over the MDR.
https://i.postimg.cc/3xZJW5tY/image.png
https://i.postimg.cc/CKPhHCy2/image.png
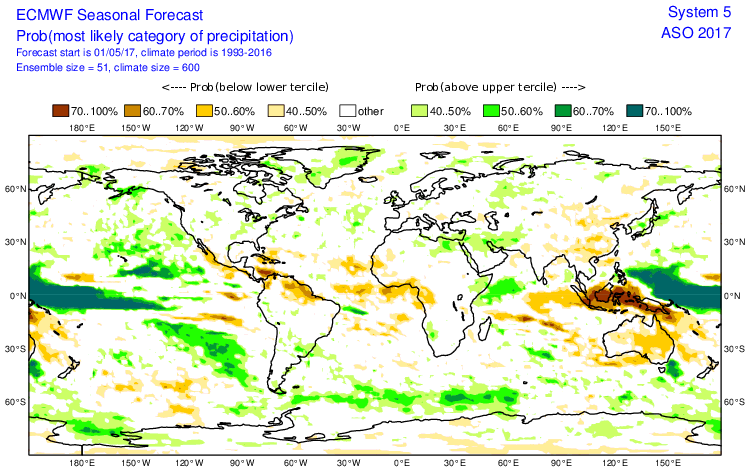
Also, just like 2020, the 2017 ECMWF forecasts were even more of a nothingburger:
https://i.postimg.cc/xT3S3GMP/image.png

LarryWx wrote:I know it currently doesn’t seem likely based on this latest Euro, but I’ll reiterate that there’s still good reason to hope that the very active April CSU forecast is going to end up too high based on past very active April CSU predictions. They’ve been making April predictions since 1995. There’s been a pretty clear pattern when they’ve gone very active in April:
-NS days: They’re predicting 115. Prior to this the highest they predicted in April was 85-95 (four times). All four of those progs ended up too high. The highest actual of these four was only 58 and they averaged a whopping 40.5 too high!
-#H: They’re predicting 11. The prior highest predicted in April was 9 (six times). All of those 6 progs ended up too high by an average of 3.
-# MH: They’re predicting 5, which they’ve predicted three other times in April. All three of those progs came in too high by an average of 2.33.
-ACE: They’re predicting 210. The prior highest April progs were 160-183 (five times). Of these five, all progs ended up too high with even the closest being 34 too high! The five averaged a whopping 85.8 too high!
But OTOH even if they were to miss these 4 categories too high by these averages there’d still be 75 NS days, 8 H, 3 MH, and 125 ACE, not a quiet season. Also, it sometimes only takes only a few or even just one to make it a bad season for land impacts. So, a lot of luck will be needed, regardless!


Teban54 wrote:SFLcane wrote:Nothing is ever a sure thing in weather.
https://x.com/BenNollWeather/status/1787556232221606095
Does anyone recall examples of the other way round, where ECMWF shows high precipitation anomalies only for the season to turn out much less active? (Other than extreme bust years like 2013, of course)
I did a quick look at the ECMWF's official site which has data up to 2017. The only notable one I could find was 2022, which shows a rather extensive chunk of wet anomalies just north of South America. However, they seem rather localized and suppressed to the south, while 2024's forecast is much more extensive with wet anomalies all over the MDR.
https://i.postimg.cc/3xZJW5tY/image.png
https://i.postimg.cc/CKPhHCy2/image.png
Also, just like 2020, the 2017 ECMWF forecasts were even more of a nothingburger:
https://i.postimg.cc/xT3S3GMP/image.png
Users browsing this forum: Google Adsense [Bot], Yellow Evan and 30 guests

