


I know that those who want to see action will not like this thread but I have to post the reallity of what is going on.
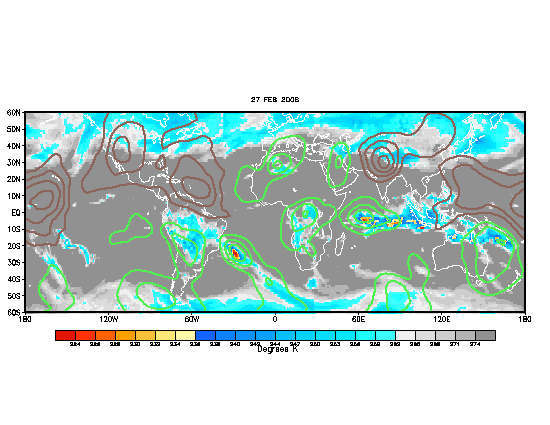
The green lines represent the favorable phase of the MJO and the brown lines represent the unfavorable phase.If you look at the graphic almost all the atlantic basin is in the dry MJO or unfavorable.This will last for a couple more weeks and believe me when the favorable MJO (Madden Julian Occillation) arrives in the atlantic things will heat up coinciding with the start of the peak of the season.My friend Don Sutherland has more graphics about this in his thread at tropical analysis forum.So folks let's take it easy and wait for things to heat up again after mid august and yes coinciding with the start of the peak of the season.At link below for those who not know what the (Madden Julian Occillation) is a complete explanation of about it.
http://www-das.uwyo.edu/~geerts/cwx/not ... 2/mjo.html


 , because as Cycloneye stated, from mid August on it is going to be extremly busy in the tropics.


 but that is just me.