DESTRUCTION5 wrote:Like I said before...The most boring storms out there...EPAC Westward Ho Storms...
Then whats an interesting storm hmm?
Moderator: S2k Moderators


DESTRUCTION5 wrote:Like I said before...The most boring storms out there...EPAC Westward Ho Storms...


Category 5 wrote:DESTRUCTION5 wrote:Like I said before...The most boring storms out there...EPAC Westward Ho Storms...
Then whats an interesting storm hmm?
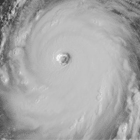

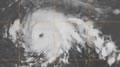
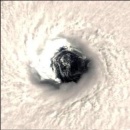
RL3AO wrote:This is interesting.
THE ECMWF SHOWS AN ALTERNATE
SCENARIO...WITH BORIS BECOMING STATIONARY OR MOVING EASTWARD AFTER
96 HR DUE TO THE DEVELOPMENT OF ANOTHER TROPICAL CYCLONE TO THE
EAST. WHILE ANOTHER CYCLONE IS A DISTINCT POSSIBILITY...THE ECMWF
MAY BE MAKING THE SYSTEM TOO POWERFUL AND TOO LARGE. THUS...ITS
FORECAST TRACK FOR BORIS APPEARS UNLIKELY AT THIS TIME.
So what is out there to its east? 95E is to the west.
AnnularCane wrote:RL3AO wrote:This is interesting.
THE ECMWF SHOWS AN ALTERNATE
SCENARIO...WITH BORIS BECOMING STATIONARY OR MOVING EASTWARD AFTER
96 HR DUE TO THE DEVELOPMENT OF ANOTHER TROPICAL CYCLONE TO THE
EAST. WHILE ANOTHER CYCLONE IS A DISTINCT POSSIBILITY...THE ECMWF
MAY BE MAKING THE SYSTEM TOO POWERFUL AND TOO LARGE. THUS...ITS
FORECAST TRACK FOR BORIS APPEARS UNLIKELY AT THIS TIME.
So what is out there to its east? 95E is to the west.
I don't see anything east of there. Are they talking about something the models are picking up?


Code: Select all
            *   EAST PACIFIC SHIPS INTENSITY FORECAST   *
                    *        GOES INPUT INCLUDED                *
                    *       BORIS  EP022008  06/27/08  18 UTC   *

TIME (HR)          0     6    12    18    24    36    48    60    72    84    96   108   120
V (KT) NO LAND    45    49    52    53    53    52    48    46    44    43    43    42    41
V (KT) LAND       45    49    52    53    53    52    48    46    44    43    43    42    41
V (KT) LGE mod    45    50    53    55    55    52    47    42    39    37    36    36    35

SHEAR (KTS)        8    14    16    19    22    23    27    16    15    12     9    11    12
SHEAR DIR         19    16    41    28    40    46    58    98   163   191   176   174   167
SST (C)         28.1  27.8  27.6  27.4  27.3  27.3  27.4  27.4  27.4  27.3  26.8  26.5  26.3
POT. INT. (KT)   144   141   139   137   136   136   137   137   138   136   131   127   125
200 MB T (C)   -53.3 -52.8 -53.2 -53.4 -53.5 -53.8 -54.0 -53.9 -54.0 -53.5 -53.7 -53.6 -53.9
TH_E DEV (C)       6     6     6     5     5     4     4     4     4     4     4     3     3
700-500 MB RH     76    72    72    73    68    73    67    65    62    61    59    61    56
GFS VTEX (KT)     10    10     9     9     9     9     8     8  LOST  LOST  LOST  LOST  LOST
850 MB ENV VOR   -33   -36   -40   -41   -40   -34   -28    -9     7    42    45    72    81
200 MB DIV        24    17     6    -2     0    10    -8    29    64    87    77   103    96
LAND (KM)        845   870   900   950  1004  1110  1176  1270  1394  1522  1631  1731  1838
LAT (DEG N)     13.1  13.3  13.5  13.6  13.7  13.7  13.8  13.8  13.8  13.7  13.8  13.8  13.8
LONG(DEG W)    109.5 110.2 110.8 111.6 112.3 114.1 115.7 117.3 119.1 120.8 122.6 124.0 125.4
STM SPEED (KT)     7     7     7     7     8     8     8     8     9     8     8     7     7

  FORECAST TRACK FROM OFCI      INITIAL HEADING/SPEED (DEG/KT):315/  8      CX,CY:  -5/  6
  T-12 MAX WIND:  30            PRESSURE OF STEERING LEVEL (MB):  625  (MEAN=582)
  GOES IR BRIGHTNESS TEMP. STD DEV. 100-300 KM RAD:  24.4 (MEAN=18.0)
  % GOES IR PIXELS WITH T < -20 C    50-200 KM RAD:  86.0 (MEAN=65.7)

                        INDIVIDUAL CONTRIBUTIONS TO INTENSITY CHANGE
                         6   12   18   24   36   48   60   72   84   96  108  120
                        ----------------------------------------------------------
  SAMPLE MEAN CHANGE     0.   0.   0.   1.   1.   1.   0.   0.  -1.  -1.  -2.  -2.
  SST POTENTIAL          1.   2.   3.   4.   6.   8.   9.  11.  12.  12.  11.  10.
  VERTICAL SHEAR         0.   0.   0.   0.  -2.  -4.  -5.  -5.  -4.  -3.  -2.  -1.
  PERSISTENCE            4.   6.   8.   9.   9.   9.   9.   8.   7.   6.   5.   4.
  200/250 MB TEMP.       0.   0.  -1.  -1.  -2.  -3.  -3.  -4.  -4.  -3.  -2.  -1.
  THETA_E EXCESS         0.  -1.  -1.  -2.  -3.  -4.  -5.  -6.  -7.  -7.  -8.  -8.
  700-500 MB RH          0.   1.   1.   2.   3.   4.   4.   5.   4.   4.   4.   3.
  GFS VORTEX TENDENCY    0.   0.  -1.  -1.   0.  -2.  -2.  -2.  -2.  -2.  -2.  -1.
  850 MB ENV VORTICITY   0.   0.   0.  -1.  -1.  -2.  -2.  -3.  -3.  -3.  -3.  -2.
  200 MB DIVERGENCE      0.   0.   0.  -1.  -1.  -1.  -1.   0.   0.   0.   0.   0.
  ZONAL STORM MOTION     0.   0.   0.  -1.  -1.  -1.  -2.  -2.  -2.  -2.  -2.  -2.
  STEERING LEVEL PRES    0.   0.   0.   0.   0.   0.   1.   1.   1.   1.   1.   1.
  DAYS FROM CLIM. PEAK   0.   0.   0.   0.  -1.  -1.  -1.  -2.  -2.  -3.  -3.  -4.
                        ----------------------------------------------------------
  SUB-TOTAL CHANGE       4.   7.   8.   9.   9.   5.   3.   1.   0.  -1.  -2.  -3.

  SATELLITE ADJUSTMENTS ----------------------------------------------------------
  MEAN ADJUSTMENT        0.   0.  -1.  -1.  -1.  -2.  -2.  -2.  -1.  -1.  -1.  -1.
  GOES IR STD DEV        0.  -1.  -1.  -1.  -1.  -1.  -1.  -1.  -1.  -1.  -1.  -1.
  GOES IR PIXEL COUNT    0.   1.   1.   1.   1.   1.   1.   0.   0.   0.   0.   0.
                        ----------------------------------------------------------
  TOTAL ADJUSTMENT       0.   0.  -1.  -1.  -1.  -2.  -2.  -2.  -2.  -1.  -1.  -1.
                        ----------------------------------------------------------
  TOTAL CHANGE (KT)      4.   7.   8.   8.   7.   3.   1.  -1.  -2.  -2.  -3.  -4.

** E. PACIFIC 2008 RI INDEX EP022008      BORIS 06/27/08  18 UTC **
           ( 25 KT OR MORE MAX WIND INCREASE IN NEXT 24 HR)

 12 HR PERSISTENCE (KT):  15.0 Range:-20.0 to  45.0 Scaled/Wgted Val:  0.5/  0.8
 850-200 MB SHEAR (KT) :  15.8 Range: 18.5 to   1.6 Scaled/Wgted Val:  0.2/  0.2
 D200 (10**7s-1)       :   9.0 Range:-11.0 to 127.0 Scaled/Wgted Val:  0.1/  0.1
 POT = MPI-VMAX (KT)   :  94.3 Range: 37.1 to 131.4 Scaled/Wgted Val:  0.6/  0.9
 850-700 MB REL HUM (%):  80.0 Range: 63.0 to  88.0 Scaled/Wgted Val:  0.7/  0.4
 % area w/pixels <-30 C:  78.0 Range: 26.0 to 100.0 Scaled/Wgted Val:  0.7/  0.2
 STD DEV OF IR BR TEMP :  21.0 Range: 35.4 to   2.7 Scaled/Wgted Val:  0.4/  0.7

 Prob of RI for 25 kt RI threshold=    25% is   2.0 times the sample mean(12.5%)
 Prob of RI for 30 kt RI threshold=     2% is   0.3 times the sample mean( 8.3%)
 Prob of RI for 35 kt RI threshold=     2% is   0.3 times the sample mean( 5.8%)

   ##         ANNULAR HURRICANE INDEX (AHI) EP022008      BORIS 06/27/08  18 UTC         ##
   ## STORM NOT ANNULAR, SCREENING STEP FAILED, NPASS=4 NFAIL=3                          ##
   ## AHI=  0   (AHI OF 100 IS BEST FIT TO ANN. STRUC., 1 IS MARGINAL, 0 IS NOT ANNULAR) ##
## ANNULAR INDEX RAN NORMALLY The following post is NOT an official forecast and should not be used as such. It is just the opinion of the poster and may or may not be backed by sound meteorological data. It is NOT endorsed by any professional institution including storm2k.org For Official Information please refer to the NHC and NWS products.
Users browsing this forum: No registered users and 13 guests


