Alyono wrote:the 12Z MU ensemble says there may be a ZERO percent chance of the operational MU verifying
Wouldn't say 0% but it's close to it with most of those ensembles pointing NW towards New England.
Moderator: S2k Moderators


ronjon wrote:PTrackerLA wrote:It's literally amazing how lucky the United States is every time!
Don't sound the "all safe to return" yet bell! The two big globals have swung and missed plenty this tropical season.
I am also curious if the Remains of 99L will come into play even though it never developed. Seems like sometimes in the tropics a little ripple in the atmosphere can have huge implications on the track of a developing system.ronjon wrote:Hopefully models for the upcoming 0z cycle will settle down with the Gulfstream IV data injested in them.
Very Good Points. One thing I have learned is that the Tropics are very unpredictable. Very Good Post.chaser1 wrote:Well, given Joaquin's present motion and impressive intensification, I'd lean toward the Euro for guidance right now. I'm not quite so comfortable with believing that we'll see a "sling-shot" off to the northeast however. Small tight storms can really be tricky given varying and regional scale steering mechanisms that often play into a storm's motion. I'm guessing that we'll see Joaquin continue to deepen under lighter shear and warm SST's, while slowly moving westward then Northwestward, and then NNE'ward just ahead of the front. I wouldn't think it would dawdle around as long as the models are indicating and in most years a tropical cyclone off the Bahamas, would sniff out any 500mb Eastern Seaboard trough and swiftly respond with a more pole-ward motion. My guess is that Joaquin will move a little quicker, and closer to the west and northwest, but still remain east of any point within the Conus. If I'm in the N. Bahamas though, I'd be battening down the hatches.
In most other years, I'd never even question either of the models' analysis of a 72 hour 500mb pattern and overall flow. Given the present short term steering pattern, i'd place less than 5%, the likelihood of Joaquin ever reaching Florida and probably only "slightly" greater odds of N.C. Outer Banks being hit. That said, and as ridiculous as it sounds... I have such a lack of confidence in each of our typically reliable Global models (and to an extent even the model ensembles), that I can't help but imagine "what if" the ridge to Joaquin's north were to build and expand westward greater than expected AND 99L simply washes out (becoming a zero factor). I mean... another "Andrew"? I'm not at all suggesting S. Florida, but simply the idea of a small deepening major hurricane potentially (and unexpectedly ) being pushed westward into Florida, Georgia, or the Carolina's. I don't think that its that realistic, but the Joker's in the deck are the poor modeling (which potentially includes a compromised capacity for even an accurate analysis), and the unusually strong El Nino and it's impact on the larger scale impact to both broad based Western hemisphere and smaller scale steering mechanisms. As previously stated, it'll be interesting to see if/how the models respond to the increased data gleaned from today's Gulfstream flight. I"m guessing this will bear out within the 0Z model runs.

Code: Select all
                    * ATLANTIC     SHIPS INTENSITY FORECAST          *
                    * IR SAT DATA AVAILABLE,       OHC AVAILABLE     *
                    *  JOAQUIN     AL112015  09/29/15  18 UTC        *

TIME (HR)          0     6    12    18    24    36    48    60    72    84    96   108   120
V (KT) NO LAND    55    60    64    67    69    71    75    78    82    85    85    81    75
V (KT) LAND       55    60    64    67    69    71    75    78    82    85    85    81    75
V (KT) LGE mod    55    63    69    73    75    77    79    82    88    97   101    93    82
Storm Type      TROP  TROP  TROP  TROP  TROP  TROP  TROP  TROP  TROP  TROP  TROP  TROP  TROP

SHEAR (KT)        19    17    17    20    18    14     7     5     6     4     8    18    11
SHEAR ADJ (KT)     0     3     2     1     1     1     5     0     0     1     5     4     4
SHEAR DIR          6     8    12    15    24    21    14    17    46   275   250   250   244
SST (C)         29.9  29.9  29.9  29.9  29.9  29.8  29.8  29.8  29.8  29.6  28.5  27.9  27.6
POT. INT. (KT)   165   165   165   165   164   163   161   160   163   163   145   136   132
ADJ. POT. INT.   140   140   141   141   139   138   134   133   140   145   129   117   111
200 MB T (C)   -52.8 -52.7 -52.8 -52.8 -52.5 -52.2 -52.0 -51.9 -51.3 -51.1 -50.5 -50.2 -51.0
TH_E DEV (C)      10    10    10    10    10    10    10    10    10     9     8     7     6
700-500 MB RH     59    61    62    64    66    65    68    65    66    57    38    32    40
MODEL VTX (KT)    17    18    19    18    18    18    19    19    19    20    21    20    17
850 MB ENV VOR    31    29    15    21    36    43    66    83    98   124   166   196   153
200 MB DIV         8     5    10    16     8    10    37    73    86    57    65     6     4
700-850 TADV       0    -1     0    -1     0     0     1     0     7    12    28    37     3
LAND (KM)        689   683   673   652   629   581   553   539   564   682   611   447   495
LAT (DEG N)     26.0  26.0  25.9  25.9  25.9  25.7  25.7  25.6  25.7  27.2  30.1  32.6  34.3
LONG(DEG W)     70.8  71.2  71.6  72.1  72.5  73.1  73.8  73.9  73.5  73.2  73.1  72.4  70.7
STM SPEED (KT)     3     4     4     4     3     3     1     0     4    11    14    12    10
HEAT CONTENT      47    43    42    45    50    61    68    64    66    56    42    21    18

  FORECAST TRACK FROM OFCI      INITIAL HEADING/SPEED (DEG/KT):220/  4      CX,CY:  -2/ -2
  T-12 MAX WIND:  35            PRESSURE OF STEERING LEVEL (MB):  558  (MEAN=624)
  GOES IR BRIGHTNESS TEMP. STD DEV.  50-200 KM RAD:  23.0 (MEAN=14.5)
  % GOES IR PIXELS WITH T < -20 C    50-200 KM RAD:  65.0 (MEAN=65.0)

                        INDIVIDUAL CONTRIBUTIONS TO INTENSITY CHANGE
                         6   12   18   24   36   48   60   72   84   96  108  120
                        ----------------------------------------------------------
  SAMPLE MEAN CHANGE     1.   2.   3.   4.   6.   8.   9.  11.  12.  12.  13.  14.
  SST POTENTIAL          1.   2.   3.   4.   6.   7.   8.   9.   9.  10.   9.   7.
  VERTICAL SHEAR MAG     0.   0.   0.  -1.   0.   1.   3.   5.   7.   8.   8.   7.
  VERTICAL SHEAR ADJ     0.   0.   0.   0.  -1.  -1.  -1.  -1.  -1.  -1.  -1.  -1.
  VERTICAL SHEAR DIR     0.   0.   0.   0.   0.   1.   1.   1.   1.   2.   3.   5.
  PERSISTENCE            4.   6.   7.   8.   8.   7.   7.   5.   4.   2.   0.  -1.
  200/250 MB TEMP.       0.   0.   0.  -1.  -1.  -2.  -2.  -3.  -4.  -5.  -7.  -8.
  THETA_E EXCESS         0.   0.   0.   0.   0.   0.   0.   0.  -1.  -2.  -3.  -4.
  700-500 MB RH          0.   0.   0.   0.  -1.  -1.  -2.  -2.  -2.  -2.  -1.  -1.
  MODEL VTX TENDENCY     0.   0.   0.   0.   0.   0.   0.   0.   1.   2.   0.  -3.
  850 MB ENV VORTICITY   0.   0.   0.   0.   0.   1.   1.   2.   3.   5.   7.   8.
  200 MB DIVERGENCE      0.   0.   0.  -1.  -1.  -1.   0.   1.   1.   1.   1.   1.
  850-700 T ADVEC        0.   0.   0.   0.   0.   0.   0.   0.   0.   0.  -1.  -1.
  ZONAL STORM MOTION     0.   0.   0.   0.   0.   0.  -1.  -1.  -1.  -2.  -2.  -2.
  STEERING LEVEL PRES    0.   0.   0.   0.   0.   1.   0.   1.   1.   1.   1.   0.
  DAYS FROM CLIM. PEAK   0.   0.   0.   0.   0.   0.   0.   0.   0.   0.   0.   0.
  GOES PREDICTORS        0.  -1.  -1.  -1.  -1.   0.   0.   0.   1.   1.   1.   0.
  OCEAN HEAT CONTENT     0.   0.   0.   0.   0.   0.   0.   0.   0.   0.   0.   0.
                        ----------------------------------------------------------
  TOTAL CHANGE           5.   9.  12.  14.  16.  20.  23.  27.  30.  30.  26.  20.

   ** 2013 ATLANTIC RI INDEX AL112015 JOAQUIN    09/29/15  18 UTC **
           ( 30 KT OR MORE MAX WIND INCREASE IN NEXT 24 HR)

 12 HR PERSISTENCE (KT):  20.0 Range:-49.5 to  33.0 Scaled/Wgted Val:  0.8/  2.4
 850-200 MB SHEAR (KT) :  18.4 Range: 28.8 to   2.9 Scaled/Wgted Val:  0.4/  0.5
 STD DEV OF IR BR TEMP :  23.0 Range: 37.5 to   2.9 Scaled/Wgted Val:  0.4/  0.5
 850-700 MB REL HUM (%):  69.2 Range: 43.2 to  93.5 Scaled/Wgted Val:  0.5/  0.6
 POT = MPI-VMAX (KT)   :  84.9 Range: 28.4 to 139.1 Scaled/Wgted Val:  0.5/  0.3
 Heat content (KJ/cm2) :  45.4 Range:  0.0 to 155.1 Scaled/Wgted Val:  0.3/  0.1
 D200 (10**7s-1)       :   9.4 Range:-23.1 to 181.5 Scaled/Wgted Val:  0.2/  0.1
 % area w/pixels <-30 C:  61.0 Range: 15.3 to 100.0 Scaled/Wgted Val:  0.5/  0.1

 Prob of RI for 25 kt RI threshold=    20% is   1.7 times the sample mean(11.9%)
 Prob of RI for 30 kt RI threshold=    12% is   1.6 times the sample mean( 7.6%)
 Prob of RI for 35 kt RI threshold=     6% is   1.4 times the sample mean( 4.6%)
 Prob of RI for 40 kt RI threshold=     5% is   1.7 times the sample mean( 3.0%)

   ##         ANNULAR HURRICANE INDEX (AHI) AL112015 JOAQUIN    09/29/15  18 UTC         ##
   ## STORM NOT ANNULAR, SCREENING STEP FAILED, NPASS=2 NFAIL=5                          ##
   ## AHI=  0   (AHI OF 100 IS BEST FIT TO ANN. STRUC., 1 IS MARGINAL, 0 IS NOT ANNULAR) ##

** PROBLTY OF AT LEAST 1 SCNDRY EYEWL FORMTN EVENT AL112015 JOAQUIN    09/29/2015  18 UTC **
TIME(HR)   0-12  12-24(0-24)  24-36(0-36)  36-48(0-48)
CLIMO(%)     0      0(  0)       3(  3)       4(  7)     <-- PROB BASED ON INTENSITY ONLY
PROB(%) 0 0( 0) 0( 0) 0( 0) <-- FULL MODEL PROB (RAN NORMALLY)Well that Clears things up.TheStormExpert wrote:18z Model Guidance.
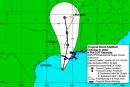
18z Track Guidance
18z Intensity Guidance


PTrackerLA wrote:Looks like the 5pm NHC track has more of a NE at day 5.
Has anyone seen the 12z Euro ensembles?
PTrackerLA wrote:Looks like the 5pm NHC track has more of a NE at day 5.
Has anyone seen the 12z Euro ensembles?
Yellow Evan wrote:PTrackerLA wrote:Looks like the 5pm NHC track has more of a NE at day 5.
Has anyone seen the 12z Euro ensembles?
The OFCI on the graphics above is just interpolated and not the actual 21z forecast from the previous advisory.
Users browsing this forum: No registered users and 60 guests


