ATL: DORIAN - Models
Moderator: S2k Moderators
-
supercane4867
- Category 5

- Posts: 4966
- Joined: Wed Nov 14, 2012 10:43 am
-
Dean4Storms
- S2K Supporter

- Posts: 6358
- Age: 63
- Joined: Sun Aug 31, 2003 1:01 pm
- Location: Miramar Bch. FL
Re: ATL: DORIAN - Models
Still many Ensemble Members of both GFS and ECM bringing Dorian over into the Gulf for a 2nd landfall. Nobody should feel all clear over here in the Gulf.
5 likes
-
HurricaneBelle
- S2K Supporter
- Posts: 1209
- Joined: Sun Aug 27, 2006 6:12 pm
- Location: Clearwater, FL
Re: ATL: DORIAN - Models
AJC3 wrote: If the probability at any point in these fields reached a certain number, "TS/HURCN CONDITIONS POSSIBLE..." is automatically placed into both the 7-day public forecasts (only within days 1-5, as I mentioned earlier), and the coastal marine forecasts that go out to 60 miles offshore.
What # is that threshold, or is that an NWS secret?
1 likes
-
StormLogic

- Tropical Storm

- Posts: 201
- Joined: Mon Jun 03, 2019 9:58 am
- Location: Beaumont
Re: ATL: DORIAN - Models
More ensembles on board with GOM & Intestifying as I was thinking Yesterday!

2 likes
Personal Forecast Disclaimer:
The posts in this forum are NOT official forecast and should not be used as such. They are just the opinion of the poster and may or may not be backed by sound meteorological data. They are NOT endorsed by any professional institution or storm2k.org. For official information, please refer to the NHC and NWS products.
The posts in this forum are NOT official forecast and should not be used as such. They are just the opinion of the poster and may or may not be backed by sound meteorological data. They are NOT endorsed by any professional institution or storm2k.org. For official information, please refer to the NHC and NWS products.
-
EquusStorm
- Category 5
- Posts: 1649
- Age: 35
- Joined: Thu Nov 07, 2013 1:04 pm
- Location: Jasper, AL
- Contact:
Re: ATL: DORIAN - Models
supercane4867 wrote:06z ICON
https://uploads.disquscdn.com/images/a0737eb704a87d0d7736b69e353406f2072a91529568238b70dc5a7cb3cc47f3.gif
That's startlingly Andrew-esque.
4 likes
Colors of lost purpose on the canvas of irrelevance
Not a meteorologist, in fact more of an idiot than anything. You should probably check with the NHC or a local NWS office for official information.
Not a meteorologist, in fact more of an idiot than anything. You should probably check with the NHC or a local NWS office for official information.
-
AJC3

- Admin

- Posts: 4156
- Age: 62
- Joined: Tue Aug 31, 2004 7:04 pm
- Location: Ballston Spa, New York
- Contact:
Re: ATL: DORIAN - Models
HurricaneBelle wrote:AJC3 wrote: If the probability at any point in these fields reached a certain number, "TS/HURCN CONDITIONS POSSIBLE..." is automatically placed into both the 7-day public forecasts (only within days 1-5, as I mentioned earlier), and the coastal marine forecasts that go out to 60 miles offshore.
What # is that threshold, or is that an NWS secret?

PWS64 is the probability of hurricane force winds for a given location in a specified 12-hour period.
PWS34 is the probability of tropical storm force winds for a given location in a specified 12-hour period.
The criteria are even more stringent for including "TS/HURCN CONDITIONS EXPECTED...", which are used exclusively during the first 48 hours/4 periods of the public and marine forecasts.
There is also the phrase "TS/HURCN CONDITIONS IMMINENT/OCCURRING...", which is pretty self-explanatory.
4 likes

Re: ATL: DORIAN - Models
Dean4Storms wrote:Still many Ensemble Members of both GFS and ECM bringing Dorian over into the Gulf for a 2nd landfall. Nobody should feel all clear over here in the Gulf.
Agreed. It's too far out still to know but it seems right now like the most likely case is for it to get tangled up on the peninsula, and if that happens far enough north, then maybe if it does get to the Gulf, it just comes out and goes back in somewhere between Tampa an Cross City.
However, if the modeling continues to shift south and west, we all know that those hurricanes almost always get into the Gulf and come up somewhere between Lafayette and Apalachicola with the double landfalling systems, usually majors. I don't want to see a SW Dip becoming more likely in the upcoming model runs 36-48 hours.
3 likes


Re: ATL: DORIAN - Models
What could be the possible strength for a 2nd landfall near the FL panhandle?
0 likes
Storm Track: Erin '95, Opal '95, Danny '97, Georges '98, Ivan '04, Dennis '05
-
chris_fit

- Category 5
- Posts: 3261
- Age: 43
- Joined: Wed Sep 10, 2003 11:58 pm
- Location: Tampa Bay Area, FL
Re: ATL: DORIAN - Models
Just for some context..... this was the GFS 48 hour forecast point.... about 24 hours ago....
That's some error.....

That's some error.....
Last edited by chris_fit on Wed Aug 28, 2019 9:36 am, edited 1 time in total.
3 likes
-
plasticup
Re: ATL: DORIAN - Models
EquusStorm wrote:supercane4867 wrote:06z ICON
https://uploads.disquscdn.com/images/a0737eb704a87d0d7736b69e353406f2072a91529568238b70dc5a7cb3cc47f3.gif
That's startlingly Andrew-esque.
Although with 3 inches of sea level rise since 1992 it would be worse.
0 likes
Re: ATL: DORIAN - Models
Is the 12Z NAM a harbinger of yet another plot twist? Way, WAY slower than previous 6Z run.
0 likes

Re: ATL: DORIAN - Models
LGEM coming in very strong, along with high SHIPs RI progs
* ATLANTIC 2019 SHIPS INTENSITY FORECAST *
* IR SAT DATA AVAILABLE, OHC AVAILABLE *
* DORIAN AL052019 08/28/19 12 UTC *
TIME (HR) 0 6 12 18 24 36 48 60 72 84 96 108 120
V (KT) NO LAND 55 59 62 66 69 75 81 87 89 91 92 95 93
V (KT) LAND 55 59 62 66 69 75 81 87 89 91 92 95 93
V (KT) LGEM 55 58 60 63 66 72 80 90 99 104 104 102 96
Storm Type TROP TROP TROP TROP TROP TROP TROP TROP TROP TROP TROP TROP TROP
SHEAR (KT) 4 5 9 11 9 6 2 6 12 9 12 13 16
SHEAR ADJ (KT) 4 4 0 -3 -1 -3 -3 -4 -1 -4 -2 -3 -2
SHEAR DIR 240 251 230 236 246 192 296 309 339 286 308 269 270
SST (C) 28.6 29.1 29.1 29.1 29.2 29.3 29.3 29.3 29.3 29.3 29.4 29.8 29.4
POT. INT. (KT) 146 154 154 154 156 157 157 157 157 157 158 164 156
ADJ. POT. INT. 139 147 146 146 147 146 143 140 140 138 136 139 131
200 MB T (C) -53.7 -53.6 -53.4 -53.5 -53.5 -53.4 -53.5 -53.2 -53.3 -52.9 -53.0 -52.7 -52.6
200 MB VXT (C) 0.1 0.1 -0.1 0.0 0.0 0.0 0.2 0.3 0.4 0.5 0.7 0.7 0.9
TH_E DEV (C) 11 12 12 12 11 11 10 10 10 9 8 9 7
700-500 MB RH 45 46 47 49 52 58 59 62 63 69 66 68 64
MODEL VTX (KT) 10 11 8 9 10 10 11 13 15 17 20 24 24
850 MB ENV VOR -12 -8 -11 -25 -29 -31 -49 -31 -29 8 -7 13 -1
200 MB DIV 6 6 -5 -2 0 39 21 41 23 23 9 44 2
700-850 TADV 2 6 6 6 5 1 2 0 -7 1 0 3 3
LAND (KM) 215 98 27 111 211 319 486 631 637 426 270 147 85
LAT (DEG N) 17.1 17.9 18.6 19.5 20.4 22.3 24.1 25.5 26.5 27.3 28.0 28.6 29.2
LONG(DEG W) 64.1 64.9 65.7 66.4 67.2 68.6 70.0 71.6 73.7 75.8 77.6 79.1 80.1
STM SPEED (KT) 10 11 11 11 12 11 11 10 10 10 8 6 5
HEAT CONTENT 45 65 72 78 83 54 52 41 58 55 52 72 42
FORECAST TRACK FROM OFCI INITIAL HEADING/SPEED (DEG/KT):315/ 10 CX,CY: -6/ 7
T-12 MAX WIND: 50 PRESSURE OF STEERING LEVEL (MB): 621 (MEAN=620)
GOES IR BRIGHTNESS TEMP. STD DEV. 50-200 KM RAD: 12.5 (MEAN=14.5)
% GOES IR PIXELS WITH T < -20 C 50-200 KM RAD: 82.0 (MEAN=65.0)
PRELIM RI PROB (DV .GE. 35 KT IN 36 HR): 30.0
INDIVIDUAL CONTRIBUTIONS TO INTENSITY CHANGE
6 12 18 24 36 48 60 72 84 96 108 120
----------------------------------------------------------
SAMPLE MEAN CHANGE 1. 2. 3. 4. 6. 8. 9. 10. 11. 11. 12. 12.
SST POTENTIAL 1. 2. 3. 4. 5. 7. 9. 11. 12. 13. 14. 15.
VERTICAL SHEAR MAG 1. 1. 2. 2. 4. 7. 9. 10. 11. 11. 11. 10.
VERTICAL SHEAR ADJ 0. 0. 0. 0. 1. 2. 3. 3. 3. 3. 3. 3.
VERTICAL SHEAR DIR 0. -1. -1. -2. -3. -3. -4. -4. -4. -3. -3. -3.
PERSISTENCE 1. 1. 1. 1. 0. 0. 0. 0. 0. 0. 0. 0.
200/250 MB TEMP. 0. 0. -1. -1. -1. -1. -1. -1. -1. -1. -1. -1.
THETA_E EXCESS 0. 1. 1. 1. 1. 1. 1. 1. 1. 1. 1. 0.
700-500 MB RH 0. 0. 0. 0. 0. 0. 0. -1. -1. -2. -2. -2.
MODEL VTX TENDENCY 0. -1. -1. -1. -1. 0. 1. 3. 5. 8. 12. 11.
850 MB ENV VORTICITY 0. 0. 0. -1. -1. -2. -3. -3. -3. -3. -3. -3.
200 MB DIVERGENCE 0. 0. -1. -1. -1. -1. -1. 0. 0. 0. 0. 0.
850-700 T ADVEC 0. 0. 0. 0. 0. 0. 0. 0. 0. 0. 0. 0.
ZONAL STORM MOTION 0. 0. 0. 0. 0. 0. 0. 0. 0. 0. 0. 0.
STEERING LEVEL PRES 0. 0. 0. 0. 0. 0. 0. 0. 0. 0. 0. 0.
DAYS FROM CLIM. PEAK 0. 0. 0. 0. 0. 0. 0. 0. 0. 0. 0. 0.
GOES PREDICTORS 0. 1. 1. 1. 1. 1. 1. 1. 1. 1. 0. 1.
OCEAN HEAT CONTENT 0. 0. 0. 0. 0. 0. 0. 0. 0. 0. 0. 0.
RI POTENTIAL 1. 2. 4. 6. 8. 7. 5. 3. 1. -1. -3. -4.
----------------------------------------------------------
TOTAL CHANGE 4. 7. 11. 14. 20. 26. 32. 34. 36. 37. 40. 38.
CURRENT MAX WIND (KT): 55. LAT, LON: 17.1 64.1
** 2019 ATLANTIC RI INDEX AL052019 DORIAN 08/28/19 12 UTC **
(SHIPS-RII PREDICTOR TABLE for 30 KT OR MORE MAXIMUM WIND INCREASE IN NEXT 24-h)
Predictor Value RI Predictor Range Scaled Value(0-1) % Contribution
12 HR PERSISTENCE (KT) : 5.0 -49.5 to 33.0 0.66 10.5
850-200 MB SHEAR (KT) : 7.6 30.1 to 2.3 0.81 4.9
HEAT CONTENT (KJ/CM2) : 68.6 0.0 to 151.8 0.45 2.4
STD DEV OF IR BR TEMP : 12.5 36.6 to 2.8 0.71 4.6
MAXIMUM WIND (KT) : 55.0 22.5 to 137.5 0.87 3.0
2nd PC OF IR BR TEMP : 0.6 2.9 to -2.9 0.39 1.7
POT = MPI-VMAX (KT) : 90.1 27.5 to 139.6 0.56 2.4
D200 (10**7s-1) : 1.0 -29.7 to 185.9 0.14 0.3
%area of TPW <45 mm upshear : 52.2 100.0 to 0.0 0.48 0.0
BL DRY-AIR FLUX (W/M2) : 436.8 895.4 to -55.0 0.48 0.0
SHIPS Prob RI for 20kt/ 12hr RI threshold= 14% is 2.6 times climatological mean ( 5.2%)
SHIPS Prob RI for 25kt/ 24hr RI threshold= 42% is 3.8 times climatological mean (10.9%)
SHIPS Prob RI for 30kt/ 24hr RI threshold= 30% is 4.3 times climatological mean ( 6.9%)
SHIPS Prob RI for 35kt/ 24hr RI threshold= 21% is 5.4 times climatological mean ( 3.8%)
SHIPS Prob RI for 40kt/ 24hr RI threshold= 0% is 0.0 times climatological mean ( 2.4%)
SHIPS Prob RI for 45kt/ 36hr RI threshold= 44% is 9.8 times climatological mean ( 4.5%)
SHIPS Prob RI for 55kt/ 48hr RI threshold= 39% is 8.4 times climatological mean ( 4.6%)
SHIPS Prob RI for 65kt/ 72hr RI threshold= 25% is 4.5 times climatological mean ( 5.4%)
0 likes
Very useful information on the Dvorak Technique --
https://severe.worldweather.wmo.int/TCF ... kBeven.pdf
https://severe.worldweather.wmo.int/TCF ... kBeven.pdf
-
chris_fit
- Category 5
- Posts: 3261
- Age: 43
- Joined: Wed Sep 10, 2003 11:58 pm
- Location: Tampa Bay Area, FL
Re: ATL: DORIAN - Models
This thing is gonna miss PR completely to the E. Just 24 hours ago that was unheard of... Except for the ICON model which has constantly shown this.
0 likes
-
StPeteMike
- Category 2

- Posts: 656
- Joined: Thu Jun 07, 2018 11:26 pm
Re: ATL: DORIAN - Models
Jonny wrote:What could be the possible strength for a 2nd landfall near the FL panhandle?
Too early to say honestly. I’m thinking it will cross closer the I-4 corridor or just a little north, but there’s still a chance it will go through SFL. If it’s the latter, a Panhandle hit could be at Cat 3 level. The former could be a Cat 1 or possibly even a tropical storm.
3 likes
The above post is not official and should not be used as such. It is the opinion of the poster and may or may not be backed by sound meteorological data. It is not endorsed by any professional institution or storm2k.org. For official information, please refer to the NHC and NWS products.
-
Hurricaneman

- Category 5
- Posts: 7404
- Age: 45
- Joined: Tue Aug 31, 2004 3:24 pm
- Location: central florida
Re: ATL: DORIAN - Models
chris_fit wrote:This thing is gonna miss PR completely to the E. Just 24 hours ago that was unheard of... Except for the ICON model which has constantly shown this.
And the UKMET
1 likes
Re: ATL: DORIAN - Models
sma10 wrote:Is the 12Z NAM a harbinger of yet another plot twist? Way, WAY slower than previous 6Z run.
To clarify, I know that the NAM is not a reliable tropical model, but the decrease motion is so glaring that it's hard to ignore that something may be changing. If the rest of the 12Z models show a similar slowing of speed ... well, I'm not really sure what it's all going to mean lol
0 likes
-
jlauderdal
- S2K Supporter
- Posts: 7240
- Joined: Wed May 19, 2004 5:46 am
- Location: NE Fort Lauderdale
- Contact:
Re: ATL: DORIAN - Models
the NAM has had some very good wins on pattern recognition on landfall approach, don't automatically discount it just because its the NAMsma10 wrote:sma10 wrote:Is the 12Z NAM a harbinger of yet another plot twist? Way, WAY slower than previous 6Z run.
To clarify, I know that the NAM is not a reliable tropical model, but the decrease motion is so glaring that it's hard to ignore that something may be changing. If the rest of the 12Z models show a similar slowing of speed ... well, I'm not really sure what it's all going to mean lol
0 likes
-
beachman80
Re: ATL: DORIAN - Models
So this is why if HP gets above Dorian in the Bahamas, why I think the ICON model could be onto something:
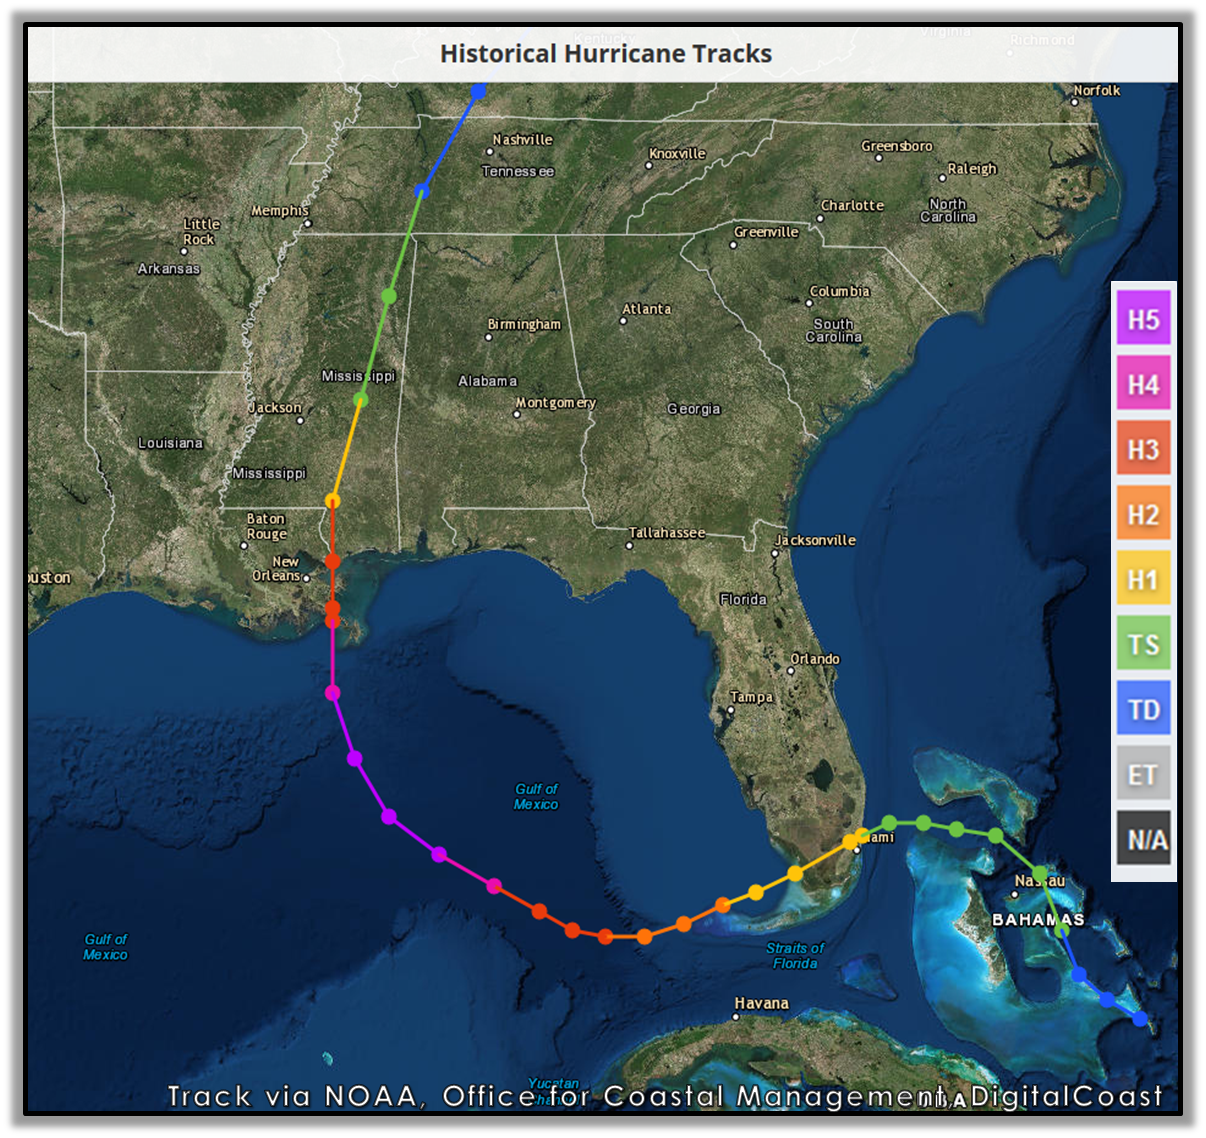

All three of the tracks were hit by HP north of it and took either due west tracks or WSW tracks. Another note is all three went further SOUTH of the tracks they were predicted to have by the NHC in that vicinity. Katrina dipped further south than thought, Andrew was supposed to go a little more WNW, not due west or slightly south of due west, and Irma took an unexpected dip into Cuba which was totally not forecast by the NHC.
All three of the tracks were hit by HP north of it and took either due west tracks or WSW tracks. Another note is all three went further SOUTH of the tracks they were predicted to have by the NHC in that vicinity. Katrina dipped further south than thought, Andrew was supposed to go a little more WNW, not due west or slightly south of due west, and Irma took an unexpected dip into Cuba which was totally not forecast by the NHC.
0 likes
Re: ATL: DORIAN - Models
jlauderdal wrote:the NAM has had some very good wins on pattern recognition on landfall approach, don't automatically discount it just because its the NAMsma10 wrote:sma10 wrote:Is the 12Z NAM a harbinger of yet another plot twist? Way, WAY slower than previous 6Z run.
To clarify, I know that the NAM is not a reliable tropical model, but the decrease motion is so glaring that it's hard to ignore that something may be changing. If the rest of the 12Z models show a similar slowing of speed ... well, I'm not really sure what it's all going to mean lol
True. But still don't know the ramifications of slowing speed because NAM only goes out 84hrs
0 likes
-
StPeteMike
- Category 2
- Posts: 656
- Joined: Thu Jun 07, 2018 11:26 pm
Re: ATL: DORIAN - Models
sma10 wrote:sma10 wrote:Is the 12Z NAM a harbinger of yet another plot twist? Way, WAY slower than previous 6Z run.
To clarify, I know that the NAM is not a reliable tropical model, but the decrease motion is so glaring that it's hard to ignore that something may be changing. If the rest of the 12Z models show a similar slowing of speed ... well, I'm not really sure what it's all going to mean lol
Likely hitting the ridge to the north and getting ready to start a more WNW movement.
0 likes
The above post is not official and should not be used as such. It is the opinion of the poster and may or may not be backed by sound meteorological data. It is not endorsed by any professional institution or storm2k.org. For official information, please refer to the NHC and NWS products.
Who is online
Users browsing this forum: No registered users and 4 guests