
Starting to wonder if we end up not seeing anything until the closing days of the month and end up having a "What if 2018-minus-El Nino" season (and I'm saying this knowing full well what 2018 produced, and this would not be a good scenario, especially given what's already transpired this year)
But it's interesting if you look at the timing, there's some weird coincidences:
A = Caribbean storm early in the season
B = MDR hurricane in early July
C = concurrent with B (albeit short lived this year rather than Cat 2 in the subtropics)
D = early August (this year a hurricane into the Gulf rather than north Atlantic)
E = mid-August (again, land-impacting hurricane rather than subtropical fish storm
Both years featured unusual early season MDR development, followed by below normal (nonexist in the case of 2018) MDR activity the entire month of August--if I remember correctly, the models were also struggling that year, and then the lid came off all at once when the month ended
2024 Indicators: SST's, MSLP, Shear, SAL, Steering, Instability (Day 16+ Climate Models)
Moderator: S2k Moderators
Forum rules

The posts in this forum are NOT official forecasts and should not be used as such. They are just the opinion of the poster and may or may not be backed by sound meteorological data. They are NOT endorsed by any professional institution or STORM2K. For official information, please refer to products from the National Hurricane Center and National Weather Service.
Re: 2024 Indicators: SST's, MSLP, Shear, SAL, Steering, Instability (Day 16+ Climate Models)
1 likes
The above post is not official and should not be used as such. It is the opinion of the poster and may or may not be backed by sound meteorological data. It is not endorsed by any professional institution or storm2k.org. For official information, please refer to the NHC and NWS products.
-
MarioProtVI
- Category 5

- Posts: 1034
- Age: 24
- Joined: Sun Sep 29, 2019 7:33 pm
- Location: New Jersey
Re: 2024 Indicators: SST's, MSLP, Shear, SAL, Steering, Instability (Day 16+ Climate Models)
Hammy wrote:Starting to wonder if we end up not seeing anything until the closing days of the month and end up having a "What if 2018-minus-El Nino" season (and I'm saying this knowing full well what 2018 produced, and this would not be a good scenario, especially given what's already transpired this year)
But it's interesting if you look at the timing, there's some weird coincidences:
A = Caribbean storm early in the season
B = MDR hurricane in early July
C = concurrent with B (albeit short lived this year rather than Cat 2 in the subtropics)
D = early August (this year a hurricane into the Gulf rather than north Atlantic)
E = mid-August (again, land-impacting hurricane rather than subtropical fish storm
Both years featured unusual early season MDR development, followed by below normal (nonexist in the case of 2018) MDR activity the entire month of August--if I remember correctly, the models were also struggling that year, and then the lid came off all at once when the month ended
So basically if September 2018 had those additional AOIs form, Isaac doesn’t get sheared to death on approach to Caribbean, Helene being a major and further west and longer lived, and Florence being Florence but stronger and a bit more of a southerly track more in the lines of Frances. Can probably see that happening
4 likes

Re: 2024 Indicators: SST's, MSLP, Shear, SAL, Steering, Instability (Day 16+ Climate Models)
MarioProtVI wrote:Hammy wrote:Starting to wonder if we end up not seeing anything until the closing days of the month and end up having a "What if 2018-minus-El Nino" season (and I'm saying this knowing full well what 2018 produced, and this would not be a good scenario, especially given what's already transpired this year)
But it's interesting if you look at the timing, there's some weird coincidences:
A = Caribbean storm early in the season
B = MDR hurricane in early July
C = concurrent with B (albeit short lived this year rather than Cat 2 in the subtropics)
D = early August (this year a hurricane into the Gulf rather than north Atlantic)
E = mid-August (again, land-impacting hurricane rather than subtropical fish storm
Both years featured unusual early season MDR development, followed by below normal (nonexist in the case of 2018) MDR activity the entire month of August--if I remember correctly, the models were also struggling that year, and then the lid came off all at once when the month ended
So basically if September 2018 had those additional AOIs form, Isaac doesn’t get sheared to death on approach to Caribbean, Helene being a major and further west and longer lived, and Florence being Florence but stronger and a bit more of a southerly track more in the lines of Frances. Can probably see that happening
Bonus points if they use the exact same names except Florence
2 likes
TC naming lists: retirements and intensity
Most aggressive Advisory #1's in North Atlantic (cr. kevin for starting the list)
Most aggressive Advisory #1's in North Atlantic (cr. kevin for starting the list)

Re: 2024 Indicators: SST's, MSLP, Shear, SAL, Steering, Instability (Day 16+ Climate Models)
I don't think I've ever seen such a high MPI in the Gulf, large portions of the region support sub-880 mb. If/when something develops there it's gonna have extraordinary background conditions.

7 likes
Re: 2024 Indicators: SST's, MSLP, Shear, SAL, Steering, Instability (Day 16+ Climate Models)
Teban54 wrote:MarioProtVI wrote:Hammy wrote:Starting to wonder if we end up not seeing anything until the closing days of the month and end up having a "What if 2018-minus-El Nino" season (and I'm saying this knowing full well what 2018 produced, and this would not be a good scenario, especially given what's already transpired this year)
But it's interesting if you look at the timing, there's some weird coincidences:
A = Caribbean storm early in the season
B = MDR hurricane in early July
C = concurrent with B (albeit short lived this year rather than Cat 2 in the subtropics)
D = early August (this year a hurricane into the Gulf rather than north Atlantic)
E = mid-August (again, land-impacting hurricane rather than subtropical fish storm
Both years featured unusual early season MDR development, followed by below normal (nonexist in the case of 2018) MDR activity the entire month of August--if I remember correctly, the models were also struggling that year, and then the lid came off all at once when the month ended
So basically if September 2018 had those additional AOIs form, Isaac doesn’t get sheared to death on approach to Caribbean, Helene being a major and further west and longer lived, and Florence being Florence but stronger and a bit more of a southerly track more in the lines of Frances. Can probably see that happening
Bonus points if they use the exact same names except Florence
Amazed I failed to catch that we're using the same name list
1 likes
The above post is not official and should not be used as such. It is the opinion of the poster and may or may not be backed by sound meteorological data. It is not endorsed by any professional institution or storm2k.org. For official information, please refer to the NHC and NWS products.
-
WaveBreaking

- Category 2

- Posts: 717
- Joined: Sun Jun 30, 2024 11:33 am
- Location: US
Re: 2024 Indicators: SST's, MSLP, Shear, SAL, Steering, Instability (Day 16+ Climate Models)
This is the strongest I’ve seen the monsoon trough so far. No wonder none of the waves are developing.

0 likes
I am NOT a professional meteorologist, so take all of my posts with a grain of salt. My opinions are mine and mine alone.
Re: 2024 Indicators: SST's, MSLP, Shear, SAL, Steering, Instability (Day 16+ Climate Models)
https://x.com/AndyHazelton/status/1826064220758089857
https://x.com/AndyHazelton/status/1826064596630634904
https://x.com/AndyHazelton/status/1826064596630634904
2 likes
TC naming lists: retirements and intensity
Most aggressive Advisory #1's in North Atlantic (cr. kevin for starting the list)
Most aggressive Advisory #1's in North Atlantic (cr. kevin for starting the list)
Re: 2024 Indicators: SST's, MSLP, Shear, SAL, Steering, Instability (Day 16+ Climate Models)
Moving this over from the global models thread:
Doesn't the vertical instability chart show below average every year? Here's what it had for 2017. (Granted, the numerical values are still higher than 2024, but that was also the case when Beryl formed.)
wxman57 wrote:I found a comparison between this time in 2023 vs. now using the NHC 7-day outlook graphic so I made my own. Quite a difference. After August 19 in 2023, there were 3 storms that formed in late August, 6 in September and 2 in October. That's 11 named storms after August 19th. This year, nothing. Unlikely we'll see any additional storms in August and early September is looking dead, too. We could reach the peak of the season (Sept 10) with only 5-6 named storms. I love it! Days off this time of year are a luxury.
I read Klotzbach's season update but I think something is being missed. Warm water - check. Low wind shear - maybe. As for a favorable environment - nope. Caribbean and Tropical Atlantic are dominated by dry, sinking air. It doesn't matter how warm the water is. If the atmosphere isn't favorable then hurricanes struggle to develop. I'm thinking my revised numbers of 18/8/4 may be too high. I'm just hoping for the current pattern to continue and any additional storms to stay out to sea. Perhaps those global models indicating no development are correct. Looking for an ensemble member somewhere to indicate development? Ha!
https://wxman57.com/images/NHC7Day.JPG
https://wxman57.com/images/NHC7Day.JPG
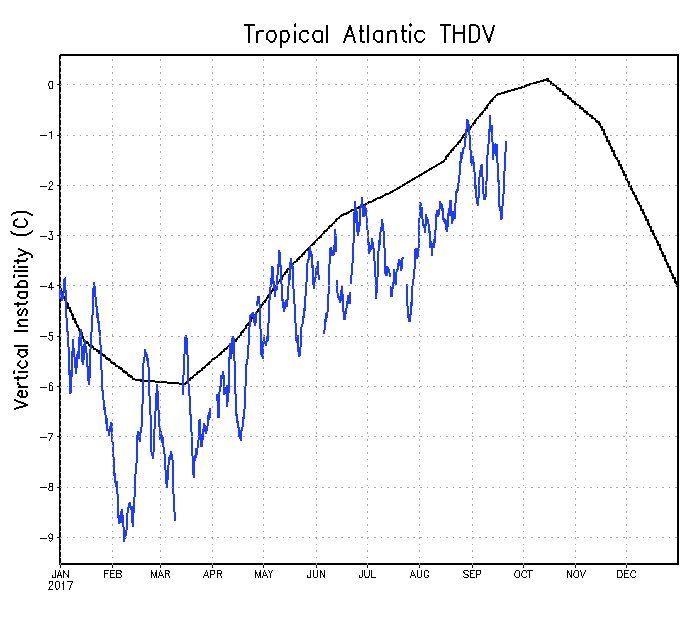
Tropical Atlantic Instability is way below normal:
https://www.ssd.noaa.gov/PS/TROP/TCFP/data/current/ts_al_tat_THDV.gif
Doesn't the vertical instability chart show below average every year? Here's what it had for 2017. (Granted, the numerical values are still higher than 2024, but that was also the case when Beryl formed.)
1 likes
TC naming lists: retirements and intensity
Most aggressive Advisory #1's in North Atlantic (cr. kevin for starting the list)
Most aggressive Advisory #1's in North Atlantic (cr. kevin for starting the list)

Re: 2024 Indicators: SST's, MSLP, Shear, SAL, Steering, Instability (Day 16+ Climate Models)
Teban54 wrote:Moving this over from the global models thread:wxman57 wrote:I found a comparison between this time in 2023 vs. now using the NHC 7-day outlook graphic so I made my own. Quite a difference. After August 19 in 2023, there were 3 storms that formed in late August, 6 in September and 2 in October. That's 11 named storms after August 19th. This year, nothing. Unlikely we'll see any additional storms in August and early September is looking dead, too. We could reach the peak of the season (Sept 10) with only 5-6 named storms. I love it! Days off this time of year are a luxury.
I read Klotzbach's season update but I think something is being missed. Warm water - check. Low wind shear - maybe. As for a favorable environment - nope. Caribbean and Tropical Atlantic are dominated by dry, sinking air. It doesn't matter how warm the water is. If the atmosphere isn't favorable then hurricanes struggle to develop. I'm thinking my revised numbers of 18/8/4 may be too high. I'm just hoping for the current pattern to continue and any additional storms to stay out to sea. Perhaps those global models indicating no development are correct. Looking for an ensemble member somewhere to indicate development? Ha!
https://wxman57.com/images/NHC7Day.JPG
https://wxman57.com/images/NHC7Day.JPG
Tropical Atlantic Instability is way below normal:
https://www.ssd.noaa.gov/PS/TROP/TCFP/data/current/ts_al_tat_THDV.gif
Doesn't the vertical instability chart show below average every year? Here's what it had for 2017. (Granted, the numerical values are still higher than 2024, but that was also the case when Beryl formed.)
https://pbs.twimg.com/media/DKQNTHjUEAEYJj9.jpg:large
I have to ask how the long-range forecasts could’ve missed the dry, stable Atlantic that we’re seeing right now and that could persist into September. Shouldn’t it have been picked up on the moisture plots or VP forecasts? Or is it tied to the detrimentally active AEJ/African Monsoon that the models (and most of us) thought would enhance activity?
0 likes
Irene '11 Sandy '12 Hermine '16 5/15/2018 Derecho Fay '20 Isaias '20 Elsa '21 Henri '21 Ida '21
I am only a meteorology enthusiast who knows a decent amount about tropical cyclones. Look to the professional mets, the NHC, or your local weather office for the best information.
I am only a meteorology enthusiast who knows a decent amount about tropical cyclones. Look to the professional mets, the NHC, or your local weather office for the best information.
-
WeatherBoy2000
- Category 1

- Posts: 460
- Joined: Mon Apr 10, 2023 9:29 am
Re: 2024 Indicators: SST's, MSLP, Shear, SAL, Steering, Instability (Day 16+ Climate Models)
Category5Kaiju wrote:WeatherBoy2000 wrote:CyclonicFury wrote:Of course I don't like to take long range models at face value, but the CFS has been consistently showing a train of MDR systems starting in the last few days of August through the middle of September. GEFS and EPS have shown significant MDR activity as well, though the Euro weeklies recent run showed slightly below average activity over the next weekend.
I really believe the lack of MDR activity is almost entirely related to the abnormally north monsoon trough position, and that should not be an issue once it retreats southward. Strong easterly shear is a common hinderence in the MDR during August in -ENSO years, especially the far eastern MDR right off Africa.
2010 was really the last year there have been long tracking CV hurricanes in August. Ever since then we've had to wait until September to get any, even in big years like 2017, it seems like 2024 is continuing that trend. Conditions seem to overall be very favorable, so I think when the switch is flipped it is going to happen in a big way. I also wonder if the CV season will be extended again like it was last year, Tammy formed on the 18th of October.
I really do think there’s a general misunderstanding in the wx community regarding how favorable early to mid August is for long-tracked Atlantic hurricanes. There seems to be a natural expectation that a storm like Allen, Andrew, or Charley should happen during a given season, but historically speaking, those are really exceptions and not the norm.
To be fair though, 2024 did feature a record breaking early July Category 5, which threw many off as it was something that only 2005 could do, until this year of course. But each season has its own quirks and is different. As far as I’m aware, our next long-lived Cape Verde hurricane in early to mid August may very well happen in 2025. Or, it may not happen for years.
I was not just talking about early to mid August, literally August in general. Even the much more favorable post Aug 20th timeframe has struggled to see these big CV storms that become hurricanes in the mdr until September. Up until 2010 they occurred much more often, it happened one year prior in 2009 with Bill, and then there's Dean in 2007, Frances in 2004, Fabian 2003, Alberto 2000, and so on. It's strange that it hasn't happened in 14 years when it used to occur regularly, at least during the 1995-2010 timeframe. That's not to say it won't happen again, but it seems like people were expecting more to come out of August, especially in the latter half of the month given the seasonal forecasts.
0 likes
-
WaveBreaking
- Category 2
- Posts: 717
- Joined: Sun Jun 30, 2024 11:33 am
- Location: US
Re: 2024 Indicators: SST's, MSLP, Shear, SAL, Steering, Instability (Day 16+ Climate Models)
aspen wrote:Teban54 wrote:Moving this over from the global models thread:wxman57 wrote:I found a comparison between this time in 2023 vs. now using the NHC 7-day outlook graphic so I made my own. Quite a difference. After August 19 in 2023, there were 3 storms that formed in late August, 6 in September and 2 in October. That's 11 named storms after August 19th. This year, nothing. Unlikely we'll see any additional storms in August and early September is looking dead, too. We could reach the peak of the season (Sept 10) with only 5-6 named storms. I love it! Days off this time of year are a luxury.
I read Klotzbach's season update but I think something is being missed. Warm water - check. Low wind shear - maybe. As for a favorable environment - nope. Caribbean and Tropical Atlantic are dominated by dry, sinking air. It doesn't matter how warm the water is. If the atmosphere isn't favorable then hurricanes struggle to develop. I'm thinking my revised numbers of 18/8/4 may be too high. I'm just hoping for the current pattern to continue and any additional storms to stay out to sea. Perhaps those global models indicating no development are correct. Looking for an ensemble member somewhere to indicate development? Ha!
https://wxman57.com/images/NHC7Day.JPG
https://wxman57.com/images/NHC7Day.JPG
Tropical Atlantic Instability is way below normal:
https://www.ssd.noaa.gov/PS/TROP/TCFP/data/current/ts_al_tat_THDV.gif
Doesn't the vertical instability chart show below average every year? Here's what it had for 2017. (Granted, the numerical values are still higher than 2024, but that was also the case when Beryl formed.)
https://pbs.twimg.com/media/DKQNTHjUEAEYJj9.jpg:large
I have to ask how the long-range forecasts could’ve missed the dry, stable Atlantic that we’re seeing right now and that could persist into September. Shouldn’t it have been picked up on the moisture plots or VP forecasts? Or is it tied to the detrimentally active AEJ/African Monsoon that the models (and most of us) thought would enhance activity?
I feel like it’s more tied to the African Monsoon than anything else, since the thermal lows it’s been producing have sent a ton of Saharan dust across the basin, alongside the monsoon trough pulling in any waves that try to exit the coast. IMO the switch flip will probably play out the same way it did last year, where the CV season takes off the moment the monsoon trough breaks down and allows waves to traverse the deep tropics uncontested.
1 likes
I am NOT a professional meteorologist, so take all of my posts with a grain of salt. My opinions are mine and mine alone.
Re: 2024 Indicators: SST's, MSLP, Shear, SAL, Steering, Instability (Day 16+ Climate Models)
aspen wrote:Teban54 wrote:Moving this over from the global models thread:wxman57 wrote:I found a comparison between this time in 2023 vs. now using the NHC 7-day outlook graphic so I made my own. Quite a difference. After August 19 in 2023, there were 3 storms that formed in late August, 6 in September and 2 in October. That's 11 named storms after August 19th. This year, nothing. Unlikely we'll see any additional storms in August and early September is looking dead, too. We could reach the peak of the season (Sept 10) with only 5-6 named storms. I love it! Days off this time of year are a luxury.
I read Klotzbach's season update but I think something is being missed. Warm water - check. Low wind shear - maybe. As for a favorable environment - nope. Caribbean and Tropical Atlantic are dominated by dry, sinking air. It doesn't matter how warm the water is. If the atmosphere isn't favorable then hurricanes struggle to develop. I'm thinking my revised numbers of 18/8/4 may be too high. I'm just hoping for the current pattern to continue and any additional storms to stay out to sea. Perhaps those global models indicating no development are correct. Looking for an ensemble member somewhere to indicate development? Ha!
https://wxman57.com/images/NHC7Day.JPG
https://wxman57.com/images/NHC7Day.JPG
Tropical Atlantic Instability is way below normal:
https://www.ssd.noaa.gov/PS/TROP/TCFP/data/current/ts_al_tat_THDV.gif
Doesn't the vertical instability chart show below average every year? Here's what it had for 2017. (Granted, the numerical values are still higher than 2024, but that was also the case when Beryl formed.)
https://pbs.twimg.com/media/DKQNTHjUEAEYJj9.jpg:large
I have to ask how the long-range forecasts could’ve missed the dry, stable Atlantic that we’re seeing right now and that could persist into September. Shouldn’t it have been picked up on the moisture plots or VP forecasts? Or is it tied to the detrimentally active AEJ/African Monsoon that the models (and most of us) thought would enhance activity?
Counter-intuitively, 700mb and 500mb relative humidity have both been near or above average throughout a large swarth of the MDR, especially the northern half. Even 850mb (SAL, not shown) has some above-average sections.
Here's 2022, for comparison:
1 likes
TC naming lists: retirements and intensity
Most aggressive Advisory #1's in North Atlantic (cr. kevin for starting the list)
Most aggressive Advisory #1's in North Atlantic (cr. kevin for starting the list)
-
AnnularCane
- S2K Supporter

- Posts: 2957
- Joined: Thu Jun 08, 2006 9:18 am
- Location: Wytheville, VA
Re: 2024 Indicators: SST's, MSLP, Shear, SAL, Steering, Instability (Day 16+ Climate Models)
aspen wrote:Teban54 wrote:Moving this over from the global models thread:wxman57 wrote:I found a comparison between this time in 2023 vs. now using the NHC 7-day outlook graphic so I made my own. Quite a difference. After August 19 in 2023, there were 3 storms that formed in late August, 6 in September and 2 in October. That's 11 named storms after August 19th. This year, nothing. Unlikely we'll see any additional storms in August and early September is looking dead, too. We could reach the peak of the season (Sept 10) with only 5-6 named storms. I love it! Days off this time of year are a luxury.
I read Klotzbach's season update but I think something is being missed. Warm water - check. Low wind shear - maybe. As for a favorable environment - nope. Caribbean and Tropical Atlantic are dominated by dry, sinking air. It doesn't matter how warm the water is. If the atmosphere isn't favorable then hurricanes struggle to develop. I'm thinking my revised numbers of 18/8/4 may be too high. I'm just hoping for the current pattern to continue and any additional storms to stay out to sea. Perhaps those global models indicating no development are correct. Looking for an ensemble member somewhere to indicate development? Ha!
https://wxman57.com/images/NHC7Day.JPG
https://wxman57.com/images/NHC7Day.JPG
Tropical Atlantic Instability is way below normal:
https://www.ssd.noaa.gov/PS/TROP/TCFP/data/current/ts_al_tat_THDV.gif
Doesn't the vertical instability chart show below average every year? Here's what it had for 2017. (Granted, the numerical values are still higher than 2024, but that was also the case when Beryl formed.)
https://pbs.twimg.com/media/DKQNTHjUEAEYJj9.jpg:large
I have to ask how the long-range forecasts could’ve missed the dry, stable Atlantic that we’re seeing right now and that could persist into September. Shouldn’t it have been picked up on the moisture plots or VP forecasts? Or is it tied to the detrimentally active AEJ/African Monsoon that the models (and most of us) thought would enhance activity?
Or maybe (operational) models being slow to pick up on favorable conditions?
Don't go by me, I'm not a model expert.
0 likes
"But it never rained rain. It never snowed snow. And it never blew just wind. It rained things like soup and juice. It snowed mashed potatoes and green peas. And sometimes the wind blew in storms of hamburgers." -- Judi Barrett, Cloudy with a Chance of Meatballs
-
cycloneye

- Admin

- Posts: 149261
- Age: 69
- Joined: Thu Oct 10, 2002 10:54 am
- Location: San Juan, Puerto Rico
Re: 2024 Indicators: SST's, MSLP, Shear, SAL, Steering, Instability (Day 16+ Climate Models)
IMO, the problem has been the seasonal forecasts from April and May from CSU, TSR, NOAA and other private firms that where bullish will numbers over 20 and some added words like hell (JB), explosive (Accuweather) etc that penetrated in the public and was in the news on TV, internet and newspapers and that has sticked until now and will continue to dominate the conversation as long the quiet period continues. But there is the other side about this and is, if we just got 4 more cat 3 or higher intensity TC's, ACE wise we could verify hyperactive ACE at the 165 threshold, with only 9 more named storms. Looking more and more quality over quantity.
8 likes
Visit the Caribbean-Central America Weather Thread where you can find at first post web cams,radars
and observations from Caribbean basin members Click Here
and observations from Caribbean basin members Click Here
-
Category5Kaiju

- Category 5
- Posts: 4330
- Joined: Thu Dec 24, 2020 12:45 pm
- Location: Seattle and Phoenix
Re: 2024 Indicators: SST's, MSLP, Shear, SAL, Steering, Instability (Day 16+ Climate Models)
cycloneye wrote:IMO, the problem has been the seasonal forecasts from April and May from CSU, TSR, NOAA and other private firms that where bullish will numbers over 20 and some added words like hell (JB), explosive (Accuweather) etc that penetrated in the public and was in the news on TV, internet and newspapers and that has sticked until now and will continue to dominate the conversation as long the quiet period continues. But there is the other side about this and is, if we just got 4 more cat 3 or higher intensity TC's, ACE wise we could verify hyperactive ACE at the 165 threshold, with only 9 more named storms. Quality over quantity.
Even then, who knows if we get an Irma or Ivan-like storm that ends up really boosting our ACE score alone. With Beryl having happened, I do think this season has the power to produce long-lived Cape Verde systems. That would really help with total ACE count.
2 likes
Unless explicitly stated, all info in my posts is based on my own opinions and observations. Tropical storms and hurricanes can be extremely dangerous. Refer to an accredited weather research agency or meteorologist if you need to make serious decisions regarding an approaching storm.
-
WeatherBoy2000
- Category 1
- Posts: 460
- Joined: Mon Apr 10, 2023 9:29 am
Re: 2024 Indicators: SST's, MSLP, Shear, SAL, Steering, Instability (Day 16+ Climate Models)
Category5Kaiju wrote:cycloneye wrote:IMO, the problem has been the seasonal forecasts from April and May from CSU, TSR, NOAA and other private firms that where bullish will numbers over 20 and some added words like hell (JB), explosive (Accuweather) etc that penetrated in the public and was in the news on TV, internet and newspapers and that has sticked until now and will continue to dominate the conversation as long the quiet period continues. But there is the other side about this and is, if we just got 4 more cat 3 or higher intensity TC's, ACE wise we could verify hyperactive ACE at the 165 threshold, with only 9 more named storms. Quality over quantity.
Even then, who knows if we get an Irma or Ivan-like storm that ends up really boosting our ACE score alone. With Beryl having happened, I do think this season has the power to produce long-lived Cape Verde systems. That would really help with total ACE count.
The difference between an above average season versus a hyperactive one can just be one CV hurricane. 2004 wouldn't have been a hyperactive season if Ivan didn't happen, let alone a 225 ace season. ACE highly favors long-lived and powerful hurricanes, you can argue that it is a flaw in the metric when it comes to judging an entire season. Despite 2020 having the second highest amount of hurricanes for any season on record along with tying 2005 for record amount of majors, the season didn't even crack 200 ace.
2 likes
-
toad strangler

- S2K Supporter
- Posts: 4546
- Joined: Sun Jul 28, 2013 3:09 pm
- Location: Earth
- Contact:
Re: 2024 Indicators: SST's, MSLP, Shear, SAL, Steering, Instability (Day 16+ Climate Models)
WeatherBoy2000 wrote:Category5Kaiju wrote:cycloneye wrote:IMO, the problem has been the seasonal forecasts from April and May from CSU, TSR, NOAA and other private firms that where bullish will numbers over 20 and some added words like hell (JB), explosive (Accuweather) etc that penetrated in the public and was in the news on TV, internet and newspapers and that has sticked until now and will continue to dominate the conversation as long the quiet period continues. But there is the other side about this and is, if we just got 4 more cat 3 or higher intensity TC's, ACE wise we could verify hyperactive ACE at the 165 threshold, with only 9 more named storms. Quality over quantity.
Even then, who knows if we get an Irma or Ivan-like storm that ends up really boosting our ACE score alone. With Beryl having happened, I do think this season has the power to produce long-lived Cape Verde systems. That would really help with total ACE count.
The difference between an above average season versus a hyperactive one can just be one CV hurricane. 2004 wouldn't have been a hyperactive season if Ivan didn't happen, let alone a 225 ace season. ACE highly favors long-lived and powerful hurricanes, you can argue that it is a flaw in the metric when it comes to judging an entire season. Despite 2020 having the second highest amount of hurricanes for any season on record along with tying 2005 for record amount of majors, the season didn't even crack 200 ace.
Ya, ACE is a great metric but like any other has flaws. You can have a bunch of storms RI right before landfall and record low ACE but be incredibly impactful. I'm not on the fence yet because I've learned to be very patient with Atlantic peak seasons BUT we are gonna find out a lot in the next 3-4 weeks.
2 likes
My Weather Station
https://www.wunderground.com/dashboard/pws/KFLPORTS603
https://www.wunderground.com/dashboard/pws/KFLPORTS603
-
Category5Kaiju
- Category 5
- Posts: 4330
- Joined: Thu Dec 24, 2020 12:45 pm
- Location: Seattle and Phoenix
Re: 2024 Indicators: SST's, MSLP, Shear, SAL, Steering, Instability (Day 16+ Climate Models)
Interesting read there. It does beg the question though, why are the conditions like this now and not late June/early July? With Beryl having been able to occur, was the jet simply weaker simply then than it is now?
0 likes
Unless explicitly stated, all info in my posts is based on my own opinions and observations. Tropical storms and hurricanes can be extremely dangerous. Refer to an accredited weather research agency or meteorologist if you need to make serious decisions regarding an approaching storm.
-
MEANINGLESS_NUMBERS
- Category 2
- Posts: 503
- Joined: Mon Nov 02, 2020 1:43 pm
Re: 2024 Indicators: SST's, MSLP, Shear, SAL, Steering, Instability (Day 16+ Climate Models)
cycloneye wrote:IMO, the problem has been the seasonal forecasts from April and May from CSU, TSR, NOAA and other private firms that where bullish will numbers over 20 and some added words like hell (JB), explosive (Accuweather) etc that penetrated in the public and was in the news on TV, internet and newspapers and that has sticked until now and will continue to dominate the conversation as long the quiet period continues. But there is the other side about this and is, if we just got 4 more cat 3 or higher intensity TC's, ACE wise we could verify hyperactive ACE at the 165 threshold, with only 9 more named storms. Looking more and more quality over quantity.
The other problem is that in addition to the extreme forecasts they mostly all said that their forecasts were of above-average confidence.
0 likes
Emily '87, Felix '95, Gert '99, Fabian '03, Humberto '19, Paulette '20, Teddy '20, Fiona '22, Lee '23, Ernesto '24, Humberto/Imelda '25
Who is online
Users browsing this forum: No registered users and 97 guests