Preliminary Outlook: Winter 2005-06

Winter Weather Discussion

Moderator: S2k Moderators

Forum rules

The posts in this forum are NOT official forecast and should not be used as such. They are just the opinion of the poster and may or may not be backed by sound meteorological data. They are NOT endorsed by any professional institution or STORM2K.

Help Support Storm2K
Message
Author
donsutherland1
S2K Analyst
S2K Analyst
Posts: 2718
Joined: Mon Sep 15, 2003 8:49 pm
Location: New York

Preliminary Outlook: Winter 2005-06

#1 Postby donsutherland1 » Sun Oct 09, 2005 10:53 pm

Winter 2005-06 looks to be generally somewhat cooler than normal in the East but warmer than normal across the Southern Plains and Pacific West Coast. The Northeast and Mid-Atlantic will likely see temperatures average about 0°-1° below normal for the December-February period. The Western United States will likely see temperatures average 1°-2° above normal.

Temperature Snapshot:
• Northeast: Somewhat cooler than normal
• Mid-Atlantic: Somewhat cooler than normal
• Southeast: Near normal
• Ohio Valley: Somewhat cooler than normal to near normal
• Northern Plains: Near normal
• Central Plains: Near normal to somewhat warmer than normal
• Southern Plains: Warmer than normal
• West Coast/Pacific Northwest: Warmer than normal

Precipitation Snapshot:
• Northeast: Near normal
• Mid-Atlantic: Near normal
• Southeast: Below normal to Near normal
• Ohio Valley: Near normal
• Northern Plains: Near normal
• Central Plains: Near normal
• Southern Plains: Below normal to near normal
• West Coast/Pacific Northwest: Above normal

Snowfall Estimates for Select Cities:
Baltimore: 20”-30”
Boston: 35”-45”
Burlington: 70”-80”
Chicago: 35”-45”
Cleveland: 80”-90”
New York City: 25”-35”
Philadelphia: 20”-30”
Pittsburgh: 40”-50”
Providence: 35”-45”
Richmond: 10”-15”
St. Louis: 16”-21”
Washington, DC: 18”-23”

ANALYSIS:

ENSO: Region 3.4 Anomalies vs. Region 1+2 Anomalies
Given the latest computer guidance and analogs, it appears likely that the December-March Region 3.4 anomaly will average between 0.00 and +0.50 while the December-March Region 1+2 anomaly will average < 0.00. Since 1950-51, 8 seasons have had such a profile. In such seasons, 7/8 (88%) cases saw the Central Plains and Southern Plains (including Texas) come out normal or warmer than normal. In 6/8 (75%) cases, the Central Plains were warmer than normal and in 5/8 (63%) cases, the Southern Plains were warmer than normal. In the Southeast (including Florida), 5/8 (63%) cases were warmer than normal and 7/8 (88%) were normal to warmer than normal. The other areas were relatively evenly divided between cold and warm anomalies.

However, once one factors in the Pacific Decadal Oscillation (PDO), one finds a clearer picture. The following applies for seasons where the PDO averaged > 0 during the December-March period:

Pacific Northwest: 75% warm
Rest of Pacific Coast: 75% warm
Northern Plains: 75% cool to normal
Central Plains: 75% normal to warm
Southern Plains (including Texas): 75% warm
Ohio Valley: 75% cool
Northeast: 100% cool
Mid-Atlantic: 100% cool
Southeast (including Florida): 50% normal

In such cases, wet anomalies are typically present across the Southeast and Mid-Atlantic states and the West Coast. Dry anomalies are typically present across the Deep South and Southwest.

In addition, 75% of those seasons saw a “Kocin-Uccellini snowstorm.”

Image

Neutral ENSO Winters after Neutral ENSO Summers/Autumns:
Since 1950-51, there have been 14 such seasons. This data, especially when a PDO>0 is factored in, strongly mirrors the above conclusions, along the East Coast and West Coast. In addition, of the 7 seasons where the PDO averaged above 0.00, 5 (71%) saw a “Kocin-Uccellini snowstorm.”

Image

ENSO Region Matches (September 2005 + Last 3 Months:
Such matches can help determine whether the most recent ENSO conditions are consistent with the longer-term ENSO situation that has prevailed and is likely for the coming winter.

The winters for the 10 most similar matches were:

1952-53
1960-61
1962-63
1966-67
1977-78
1980-81
1990-91
1992-93
2001-02
2003-04

As with the earlier ENSO scenarios, there is again consistency, especially when one factors in a PDO>0. 5/10 (50%) of these seasons saw at least one “Kocin-Uccellini snowstorm” while 4/5 (80%) of seasons that also included a PDO>0 saw such a snowstorm.

Image

Additional Factors:

Winter 2005-06 will likely see the QBO average appreciably negative even as it could rise rapidly late in the winter. There were two seasons where the December-March QBO averaged -10 or below and the Region 3.4 anomaly ranged between 0.00 and +0.50: 1958-59 and 1981-82. Both featured cool anomalies in at least part of the East and warm ones in part of the West. Given that this supports the preponderance of the ENSO-PDO scenarios, the QBO does not necessarily suggest warmth in the East. That small sample of two is inconclusive with regard to snowfall with 1958-59 not supporting big snowfall but 1981-82 providing healthy snowfall. Hence, as it is not conclusive, the QBO is discounted with regard to the snowfall ideas.

The NAO could average negative for the winter. However, given the changes that took place in the methodology behind the data, confidence in this idea is lower than it might otherwise be.

Local Indicators:
Last year, the local data suggested that New England had the potential for a blockbuster winter. Unfortunately, this year, the local data suggests the potential for below normal to much below normal snowfall for New England. Some weight is given to these indicators given their performance last winter.

Historic snowfall climatology also argues for a drop off in Boston’s snowfall. Since 1891-92, Boston has seen 11 seasons with 70” or more snowfall. 5/11 (45%) have occurred beginning with 1992-93. For the 10 such seasons prior to 2004-05, just 1 (1992-93) was followed by another blockbuster season (1993-94: 96.3” following the 83.9” that fell in 1992-93). 6/10 (60%) saw less than 40” snowfall the following season. 3/10 (30%) saw 50” or more. As a result, the combination of the local indicators that pointed to Boston’s blockbuster winter last season and historic climatology both argue that 2005-06 probably won’t be a blockbuster season.

New York City’s Wetter Climate:
New York City’s Central Park has received 40” or more snowfall for 3 consecutive winters. That exceeds the former mark of 2. If New York City were to have a 4th consecutive such season, it would be arguably among the most significant weather events relative to climatology for some time.

Historic climatology strongly argues against a doubling of NYC’s earlier record. However, NYC has seen 5 consecutive 30” seasons (1880-81 through 1884-85). With a wetter climate—and it appears that the City has seen the development of such a climate—perhaps that might have translated into a greater chance of more 40” seasons.

Let’s take a closer look at NYC’s wetter climate:

Annual Precipitation:
1869-1969: 42.94”
1970-2004: 49.51”
Change: +15%

December-March Precipitation:
1869-70 through 1969-70: 13.86”
1970-71 through 2004-05: 15.55”
Change: +12%

The tendency for extremes on the wet side has also increased:

Annual Extremes:
• < 40” Precipitation:
1869-1969: 36% of years
1970-2004: 11% of years

• >50” or more Precipitation:
1869-1969: 12% of years
1970-2004: 37% of years

December-March Extremes:
• <12” Precipitation:
1869-70 through 1969-70: 26% of seasons
1970-71 through 2004-05: 23% of seasons

• >15” Precipitation:
1869-70 through 1969-70: 33% of seasons
1970-71 through 2004-05: 57% of seasons

Key Assumptions:
• Neutral ENSO
• Weak warm anomaly in ENSO Region 3.4
• Cool anomaly in ENSO Region 1+2
• PDO>0
• QBO: East

Historic Tidbit: The Severe Winter of 1740-41:
Extract from the records of John Bissell, Esq., Town Clerk of Bolton, Connecticut:

At Guilford, a sheep was in the winter buried in a storm of snow, and lay there ten weeks and three days, and came out alive. The spring came on very slowly; the beginning of March about half the people of the government had spent all their hay; and subsisted them by falling [felling] trees, giving out their Indian corn; and by reason of which scarcity a great number of cattle and horses died, and near half the sheep, and about two thirds of the goats.

Update:
If necessary, an update will be provided toward the end of November.
Last edited by donsutherland1 on Mon Oct 10, 2005 3:41 pm, edited 1 time in total.
0 likes   

weather girl
Tropical Depression
Tropical Depression
Posts: 63
Joined: Thu Apr 21, 2005 2:35 pm

#2 Postby weather girl » Mon Oct 10, 2005 12:47 pm

You had the summer forecast pretty much in the bag, so I imagine this one is pretty close as well.

Everyone I've read....ok, mostly Dr. George Taylor, Oregon State Climatologist...is using 1995-1996 as an analog, but I don't see it listed with your forecast. Why do you not see it as an analog?

Thanks for the good work. Always a thorough read.
0 likes   

donsutherland1
S2K Analyst
S2K Analyst
Posts: 2718
Joined: Mon Sep 15, 2003 8:49 pm
Location: New York

#3 Postby donsutherland1 » Mon Oct 10, 2005 3:43 pm

Weather girl,

Tropical activity and ENSO anomalies this summer would argue for something along the lines of 1995-96. However, Winter 1995-96 saw a weak La Niña and currently the ENSO models (also analogs based on current conditions) generally argue against such a development.

Best wishes.
0 likes   

Coredesat

#4 Postby Coredesat » Tue Oct 11, 2005 1:02 am

Great post as always, Don. Hopefully the winter won't get in the way of my plans to go see some friends in Illinois this winter. :lol:
0 likes   

User avatar
brandybugg4180
Tropical Depression
Tropical Depression
Posts: 75
Joined: Sun Mar 27, 2005 3:54 am
Location: gaston, south carolina
Contact:

#5 Postby brandybugg4180 » Tue Oct 11, 2005 1:07 am

to be to the point i understand none of that forecast except for the parts that name my regiion and say above or below average. Im new to the weather boards and IM curious to learn things ..so could someone please tell me what all of that means for me i live in central south carolina
0 likes   

donsutherland1
S2K Analyst
S2K Analyst
Posts: 2718
Joined: Mon Sep 15, 2003 8:49 pm
Location: New York

#6 Postby donsutherland1 » Tue Oct 11, 2005 9:15 am

Brandybugg4180,

The discussion refers to a number of technical factors (ENSO = El Niño Southern Oscillation, PDO = Pacific Decadal Oscillation) that help shape the large-scale patterns. Right now, based on how things stand and how winters have often fared with the evolution of these indices, it appears that South Carolina could see near normal temperatures but somewhat below normal to near normal precipitation. Snowfall there will probably come out somewhat below normal to near normal given the temperature/precipitation ideas.
0 likes   

User avatar
gboudx
S2K Supporter
S2K Supporter
Posts: 4080
Joined: Thu Sep 04, 2003 1:39 pm
Location: Rockwall, Tx but from Harvey, La

#7 Postby gboudx » Tue Oct 11, 2005 9:29 am

I don't like the part about Texas getting below to near normal precip. We've had way below normal precip this year. Above normal temps don't bother me. Especially with heating costs going through the roof. We just need some rain.
0 likes   

cavaguy20
Tropical Wave
Tropical Wave
Posts: 2
Joined: Tue Jul 19, 2005 12:11 am

#8 Postby cavaguy20 » Wed Oct 12, 2005 12:02 am

Impressieve knowledge you have within Don... and your outlook seems very very on target to me! :)
0 likes   

User avatar
Tri-State_1925
Category 1
Category 1
Posts: 341
Joined: Fri Aug 13, 2004 11:16 am
Location: Worcester Hills, MA

#9 Postby Tri-State_1925 » Wed Oct 12, 2005 9:05 pm

The Don goes to the extreme...several years ago I thought about doing stuff like this, but I have neither the time nor the patience for it.
0 likes   

donsutherland1
S2K Analyst
S2K Analyst
Posts: 2718
Joined: Mon Sep 15, 2003 8:49 pm
Location: New York

Re: Preliminary Outlook: Winter 2005-06

#10 Postby donsutherland1 » Thu Oct 13, 2005 11:26 am

Is October's Wet Weather Providing a Winter Hint?

At the beginning of this thread, I noted:

Local Indicators:
Last year, the local data suggested that New England had the potential for a blockbuster winter. Unfortunately, this year, the local data suggests the potential for below normal to much below normal snowfall for New England. Some weight is given to these indicators given their performance last winter.


Through Noon today, the two-day rainfall for NYC is 6.00". Total rainfall for October is now 10.70". As a result, October 2005 is the third wettest October on record for NYC:

1. 13.31" 1903
2. 12.97" 1913
3. 10.70" 2005 (thru 10/13 Noon)

For what it is worth, NYC's snowfall following the two wettest Octobers:

1903-04: 32.2"
1913-14: 40.5" (memorable March 1914 blizzard)

For Washington, DC, snowfall totals for those winters came to 20.2" and 28.6" respectively. In Boston, snowfall came to 72.9" (much above normal) and 39.4" (somewhat below normal) respectively.

Meanwhile, even as NYC continues to be soaked, Bostonians are still waiting after having received just 0.02". The wait should end this afternoon. NWS Taunton notes at 11 am:

BACK EDGE OF PRECIPITATION HAS WORKED WESTWARD THROUGH MOST OF EASTERN MASSACHUSETTS INTO SOUTH CENTRAL AND SOUTHEAST NEW HAMPSHIRE. MORE RAIN IS SEEN SOUTH AND EAST OF NANTUCKET...WHICH SHOULD WORK IN LATER THIS AFTERNOON AND TONIGHT...RESATURATING THE DRY LAYERS AND BRINGING MORE RAINFALL FOR EASTERN AND ESPECIALLY SOUTH COASTAL AREAS TONIGHT.

Through Noon today, Boston has picked up just 2.30" for October. Whether or not the October precipitation pattern so far--wet October in DCA and NYC but much drier one in Boston--is a hint of heavier snowfall anomalies being centered south of New England (as suggested by the aforementioned local temperature/precipitation profiles that played some role in my preliminary winter outlook) remains to be seen.

On a more hopeful note for Boston/eastern New England, 1995 is the only year in which October saw 7" or more rainfall in both DCA and NYC. However, then Boston saw more than 6" rainfall, so Boston has much catching up to do.

There was one year in which October saw 6" or more rainfall in both NYC and DCA but less than 5" in Boston: 1902. That winter saw 42.0" snow in Boston, which is near to just a little above normal. Washington, DC picked up just 8.2" in that winter.
0 likes   

Brian_from_bellingham
Tropical Depression
Tropical Depression
Posts: 75
Joined: Wed Jan 12, 2005 10:57 am
Location: Bellingham, WA

#11 Postby Brian_from_bellingham » Tue Oct 18, 2005 3:43 pm

Don, right now the PDO is at -0.46, and probably continuing to fall. How would that change your forecast if the PDO remains neutral/negative?
0 likes   

donsutherland1
S2K Analyst
S2K Analyst
Posts: 2718
Joined: Mon Sep 15, 2003 8:49 pm
Location: New York

#12 Postby donsutherland1 » Thu Oct 20, 2005 9:52 am

Brian,

If the PDO were to go negative around -1.00 or lower and be sustained there, I'd have to make some important changes. My forecast assumes an average of > 0 (albeit probably less than +0.50 for the winter) and then possibility of a month or so < 0. If it's close to 0, I don't expect big changes.

At the time, the September figure wasn't available. I will re-examine the issue toward late November and consider a number of additional factors. At that time, I'll make such changes as might be necessary.
0 likes   

Brian_from_bellingham
Tropical Depression
Tropical Depression
Posts: 75
Joined: Wed Jan 12, 2005 10:57 am
Location: Bellingham, WA

#13 Postby Brian_from_bellingham » Tue Nov 08, 2005 6:03 pm

Don, I just saw the October PDO numbers, they came out a bit early this month. It is down to -1.32, pretty impressive, and lower then I thought it would be.

A lot of the METS in the NW have changed their forecast from earlier this fall. Things are changing rapidly.
0 likes   

krysof

#14 Postby krysof » Tue Nov 08, 2005 6:24 pm

Brian_from_bellingham wrote:Don, I just saw the October PDO numbers, they came out a bit early this month. It is down to -1.32, pretty impressive, and lower then I thought it would be.

A lot of the METS in the NW have changed their forecast from earlier this fall. Things are changing rapidly.


it looks very similair to 2001-2002 which sucked in the east and was great in the west and Alaska
0 likes   

donsutherland1
S2K Analyst
S2K Analyst
Posts: 2718
Joined: Mon Sep 15, 2003 8:49 pm
Location: New York

#15 Postby donsutherland1 » Wed Nov 09, 2005 9:27 am

Brian_from_bellingham,

The new PDO figure suggests much better winter prospects for the Pacific Northwest (if one likes colder weather/snow) and it's something I want to examine more closely. If necessary, I'll post a revision at the end of November.
0 likes   

aveosmth
Category 1
Category 1
Posts: 286
Joined: Fri Nov 21, 2003 10:16 pm

#16 Postby aveosmth » Wed Nov 09, 2005 3:03 pm

A negative PDO for us in the Southwest will mean cooler than normal temps with below average precipitation.

The only good thing about these type of setups is that they are conducive to low elevation snowfall. In 2002 we had snow flurries in the suburbs of Los Angeles (only 800 ft elevation).
0 likes   

lurkerinthemidst
Tropical Depression
Tropical Depression
Posts: 95
Joined: Mon Aug 30, 2004 9:07 pm
Location: Hudson,FL & Cleveland, TN

#17 Postby lurkerinthemidst » Wed Nov 16, 2005 1:49 pm

Don - Ok I think I am understanding this a little. I am new to tracking winter weather because until 8 months ago I lived in FL. So am I correct in thinking that in SE TN that we will have a warmer than normal winter and the chances of snow even less than normal? I know that some of my questions may sound really dumb but I am trying to learn a little about winter weather patterns and how to predict it a little more.

Thanks
0 likes   

User avatar
Hurricaneman
Category 5
Category 5
Posts: 7351
Age: 45
Joined: Tue Aug 31, 2004 3:24 pm
Location: central florida

#18 Postby Hurricaneman » Thu Nov 17, 2005 2:21 pm

I think that is a pretty good forecast right now, the cold has come
0 likes   

donsutherland1
S2K Analyst
S2K Analyst
Posts: 2718
Joined: Mon Sep 15, 2003 8:49 pm
Location: New York

Re: Preliminary Outlook: Winter 2005-06

#19 Postby donsutherland1 » Mon Apr 17, 2006 1:56 pm

Verification:

The Northeast and Mid-Atlantic will likely see temperatures average about 0°-1° below normal for the December-February period. The Western United States will likely see temperatures average 1°-2° above normal.

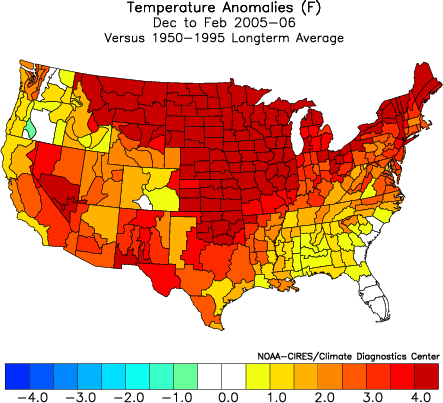
Actual:
All areas saw temperatures run above normal, generally from 2°-4° above normal. The Pacific Northwest and Southeast were somewhat cooler. The exceptional warmth in January was largely responsible for this outcome.

Temperature Snapshot:

Forecast:
• Northeast: Somewhat cooler than normal
• Mid-Atlantic: Somewhat cooler than normal
• Southeast: Near normal
• Ohio Valley: Somewhat cooler than normal to near normal
• Northern Plains: Near normal
• Central Plains: Near normal to somewhat warmer than normal
• Southern Plains: Warmer than normal
• West Coast/Pacific Northwest: Warmer than normal

Actual:
• Northeast: Warmer than normal
• Mid-Atlantic: Warmer than normal
• Southeast: Near normal to somewhat warmer than normal
• Ohio Valley: Warmer than normal
• Northern Plains: Much warmer than normal
• Central Plains: Much warmer than normal
• Southern Plains: Warmer to much warmer than normal
• West Coast/Pacific Northwest: Warmer than normal

Winter 2005-06 Temperature Anomalies:
Image

Precipitation Snapshot:

Forecast:
• Northeast: Near normal
• Mid-Atlantic: Near normal
• Southeast: Below normal to Near normal
• Ohio Valley: Near normal
• Northern Plains: Near normal
• Central Plains: Near normal
• Southern Plains: Below normal to near normal
• West Coast/Pacific Northwest: Above normal

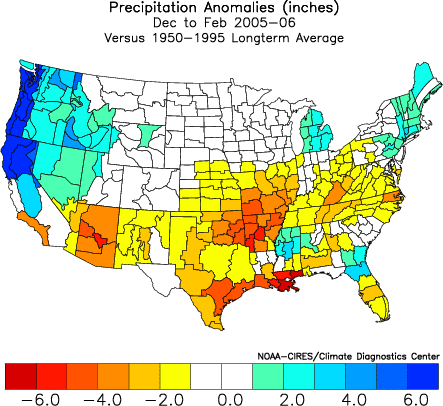
Actual:
• Northeast: Near normal to somewhat above normal
• Mid-Atlantic: Below normal
• Southeast: Near normal
• Ohio Valley: Below normal to near normal
• Northern Plains: Near normal
• Central Plains: Below normal
• Southern Plains: Much below normal
• West Coast/Pacific Northwest: Above normal to much above normal

Winter 2005-06 Precipitation Anomalies:
Image

Snowfall Estimates for Select Cities:

Estimates were made for 12 cities. The results were as follows:

- Within range: 2 (17%)
- Within 4" of the estimated range: 6 (50%)
- Within 6" of the estimated range: 9 (75%)

Baltimore: 20”-30”; Actual: 19.6"
Boston: 35”-45”; Actual: 39.9"
Burlington: 70”-80”; Actual: 70.4"
Chicago: 35”-45”; Actual: 26.0"
Cleveland: 80”-90”; Actual: 50.6"
New York City: 25”-35”; Actual: 40.0"
Philadelphia: 20”-30”; Actual: 19.5"
Pittsburgh: 40”-50”; Actual: 32.2"
Providence: 35”-45”; Actual: 33.9"
Richmond: 10”-15”; Actual: 8.5"
St. Louis: 16”-21”; Actual: 10.5"
Washington, DC: 18”-23”; Actual: DCA: 13.6"; IAD: 14.1"

Additional Elements:

Unfortunately, this year, the local data suggests the potential for below normal to much below normal snowfall for New England. Some weight is given to these indicators given their performance last winter.

Historic snowfall climatology also argues for a drop off in Boston’s snowfall. Since 1891-92, Boston has seen 11 seasons with 70” or more snowfall. 5/11 (45%) have occurred beginning with 1992-93. For the 10 such seasons prior to 2004-05, just 1 (1992-93) was followed by another blockbuster season (1993-94: 96.3” following the 83.9” that fell in 1992-93). 6/10 (60%) saw less than 40” snowfall the following season. 3/10 (30%) saw 50” or more. As a result, the combination of the local indicators that pointed to Boston’s blockbuster winter last season and historic climatology both argue that 2005-06 probably won’t be a blockbuster season.


Boston finished with 39.9" snowfall. Moreover, parts of northern New England experienced below normal seasonal snowfall.

New York City’s Central Park has received 40” or more snowfall for 3 consecutive winters. Historic climatology strongly argues against a doubling of NYC’s earlier record. However, NYC has seen 5 consecutive 30” seasons (1880-81 through 1884-85). With a wetter climate—and it appears that the City has seen the development of such a climate—perhaps that might have translated into a greater chance of more 40” seasons.

New York City finished with 40.0" seasonal snowfall.

Key Assumptions:
• Neutral ENSO; Actual: Weak La Niña
• Weak warm anomaly in ENSO Region 3.4; Actual: -0.68
• Cool anomaly in ENSO Region 1+2; Actual: -0.10
• PDO>0; Actual: +0.63
• QBO: East; Actual: East
0 likes   

User avatar
x-y-no
Category 5
Category 5
Posts: 8359
Age: 65
Joined: Wed Aug 11, 2004 12:14 pm
Location: Fort Lauderdale, FL

#20 Postby x-y-no » Mon Apr 17, 2006 4:18 pm

Looks like you did darn well with precipitation.

Temps somewhat less so. :-) All that cold air never did make it out of Siberia.
0 likes   


Return to “Winter Weather”

Who is online

Users browsing this forum: No registered users and 11 guests