Right now, I’m thinking that the highest temperature during the 3/8-15 period will likely reach at least:
Boston: 55° or above
Detroit: 60° or above
New York City: 65° or above
Philadelphia: 65° or above
Washington, DC: 68° or above
Moreover, it would not surprise me if the temperature reached 70° in at least Washington, DC and perhaps Philadelphia and even New York City. 60° or above should not be ruled out for Boston.
Given the possible magnitude of warmth, a closer look is in order:
Major Teleconnection Indices:
If one examines the ensemble forecasts for the NAO and PNA, one finds strong agreement that the NAO will be in the 0.000 to +0.999 range and the PNA in the 0.000 to -2.000 range during the 3/10-15 timeframe.
In general, an NAO > 0 is a milder signal for both the Great Lakes region and East Coast. Early on, as the NAO becomes modestly positive, a PNA+ can thwart the warmup. A PNA- can exacerbate it, particularly in the Great Lakes and Mid-Atlantic regions As the NAO reaches +2.000, the PNA’s influence diminishes.
Mean temperature data for select cities for the 3/5-15 period follows:
Boston: (PNA+/PNA-)
NAO: 0 to -0.999: 34.4°/36.4°
NAO: 0 to +0.999: 35.5°/38.2°
NAO: +1 to +1.999: 36.3°/38.1°
Detroit: (PNA+/PNA-)
NAO: 0 to -0.999: 32.1°/33.1°
NAO: 0 to +0.999: 32.8°/37.7°
NAO: +1 to +1.999: 36.7°/36.3°
New York City: (PNA+/PNA-)
NAO: 0 to -0.999: 38.2°/40.5°
NAO: 0 to +0.999: 39.5°/43.1°
NAO: +1 to +1.999: 40.6°/42.7°
Philadelphia: (PNA+/PNA-)
NAO: 0 to -0.999: 38.6°/41.2°
NAO: 0 to +0.999: 39.2°/44.1°
NAO: +1 to +1.999: 42.0°/44.0°
Washington, DC (DCA): (PNA+/PNA-)
NAO: 0 to -0.999: 42.8°/46.2°
NAO: 0 to +0.999: 43.2°/49.3°
NAO: +1 to +1.999: 46.9°/47.9°
In general, as the NAO rises, one also sees an increased frequency of days in which the high temperature reaches or exceeds 50° and 60°. Data for the above cities follows:
Boston: Percentage of days 50° or above/60° or above
NAO: 0 to -0.999: 15%/2%
NAO: 0 to +0.999: 26%/14%
NAO: +1 to +1.999: 28%/12%
Detroit: Percentage of days 50° or above/60° or above
NAO: 0 to -0.999: 16%/5%
NAO: 0 to +0.999: 30%/16%
NAO: +1 to +1.999: 36%/18%
New York City: Percentage of days 50° or above/60° or above
NAO: 0 to -0.999: 33%/9%
NAO: 0 to +0.999: 43%/21%
NAO: +1 to +1.999: 50%/20%
Philadelphia: Percentage of days 50° or above/60° or above
NAO: 0 to -0.999: 41%/12%
NAO: 0 to +0.999: 49%/27%
NAO: +1 to +1.999: 59%/26%
Washington, DC (DCA): Percentage of days 50° or above/60° or above
NAO: 0 to -0.999: 58%/30%
NAO: 0 to +0.999: 65%/42%
NAO: +1 to +1.999: 73%/48%
Given the ensemble forecast for the NAO and PNA, select data (mean temperature and percentage of days 50° or above/60° or above) during the 3/5-15 period follows for the above cities:
Boston:
Mean Temperature: 39.7°
% of Days with Highs of 50° or above: 34%
% of Days with Highs of 60° or above: 20%
Detroit:
Mean Temperature: 36.9°
% of Days with Highs of 50° or above: 23%
% of Days with Highs of 60° or above: 23%
New York City:
Mean Temperature: 44.0°
% of Days with Highs of 50° or above: 49%
% of Days with Highs of 60° or above: 29%
Philadelphia:
Mean Temperature: 44.7°
% of Days with Highs of 50° or above: 57%
% of Days with Highs of 60° or above: 31%
Washington, DC:
Mean Temperature: 48.7°
% of Days with Highs of 50° or above: 69%
% of Days with Highs of 60° or above: 49%
500 mb Height Anomalies:
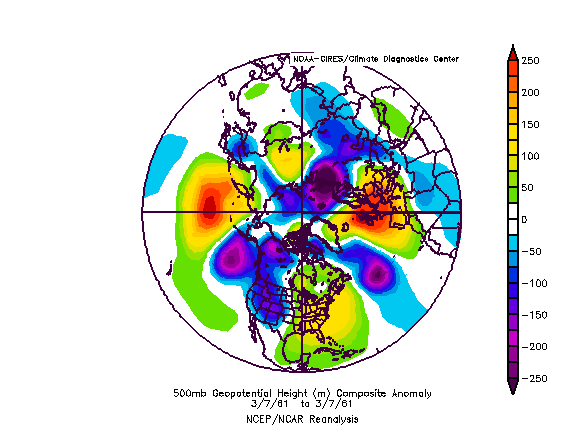
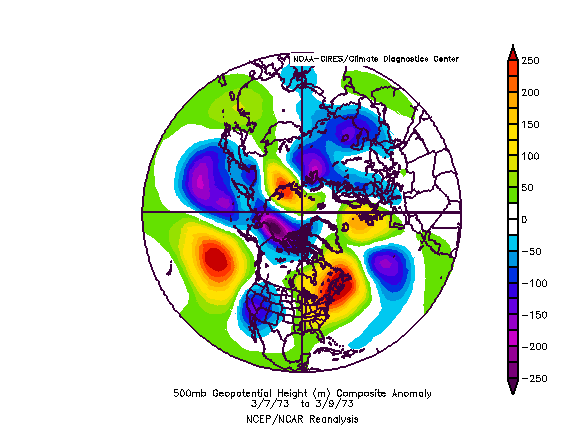
Analog outbreaks of warmth based on forecast 500 mb anomalies and the major teleconnection data above show some similarities with those that occurred in March 1961, March 1973, and March 1990.
NCEP Ensemble Mean 500 mb Height Anomalies (3/11 0z):

Composite 500 mb Height Anomalies for Select Outbreaks of Warmth (3/5-15 period):

March 7, 1961:

March 7-9, 1973:

March 11-13, 1990:

Select data for those outbreaks of warmth follow:
• All 3 cases saw readings reach 60° or above on one or more days in Detroit, New York City, Philadelphia, and Washington, DC +/- 3 days from the period assessed (i.e., 3/7/1961, 3/7-9/1973, and 3/11-13/1990).
• Boston saw readings reach 60° or above on one or more days +/- 3 days from the period assessed in two cases.
• Washington, DC reached 70° or above on one or more days two cases +/- days from the period assessed.
 The posts in this forum are NOT official forecast and should not be used as such. They are just the opinion of the poster and may or may not be backed by sound meteorological data. They are NOT endorsed by any professional institution or


