This has to mean something! GOM History
Moderator: S2k Moderators
Forum rules

The posts in this forum are NOT official forecasts and should not be used as such. They are just the opinion of the poster and may or may not be backed by sound meteorological data. They are NOT endorsed by any professional institution or STORM2K. For official information, please refer to products from the National Hurricane Center and National Weather Service.
-
curtadams
- S2K Supporter

- Posts: 1122
- Joined: Sun Aug 28, 2005 7:57 pm
- Location: Orange, California
- Contact:
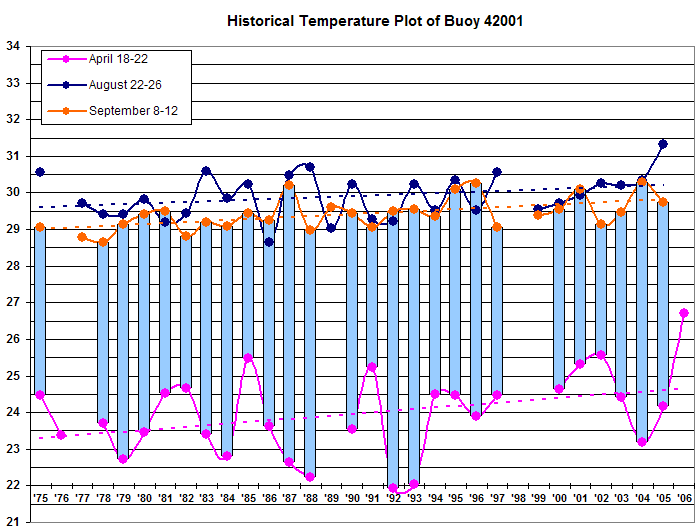
The overall warming trend is very clear. But, by eyeball, there isn't much correlation between a *particular* April and the same year's August apart from the overall trend. Further, August 2005 was fairly cool by recent standards and we all know what happened THEN. This is good science (surely somebody's already done this? but sometimes it's surprising what's not been done.) but we can conclude that the April 20 measurement at one buoy says little about upcoming hurricane intensity. The warming trend is a real eye-opener, though.
0 likes

Warning: Lots of numbers and analysis below. Reading this may make your head hurt.
I've gone a little further in breaking this down using some four-day averages (like someone suggested).

Here's the past 45 days, along with 1-day, 4-day, and 7-day moving averages. This doesn't have a lot of significance to what follows, but it's interesting to look at.
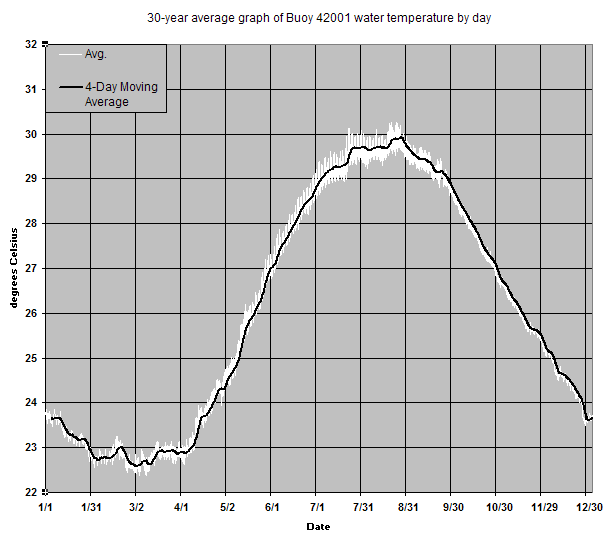
Here's the 30-year average of temperature at the buoy throughout the year. It reaches a maximum somewhere in late August, at an average of about 30°C/86°F.
In order to predict temperature changes, I looked at three 4-day time periods:
(1) The current one (April 18-22)
(2) The peak temperature period for that buoy (August 22-26)
(3) The climatological peak of hurricane season (September 8-12)
First, the 30-year averages:
Average April temperature: 24.0°C/75.2°F
--------Range: 22.0°C/71.6°F (1993) -- 26.7°C/80.1°F (2006)
Average April ---> August rise: 5.9°C
--------Range: 4.0°C (1991) -- 8.5°C (1988)
Average April ---> September rise: 5.4°C
--------Range: 3.6°C (2002) -- 7.6°C (1987 and 1992)
Average August temperature: 29.9°C/85.8°F
--------Range: 28.7°C/83.7°F (1986) -- 31.3°C/88.3°F (2005)
Average September temperature: 29.4°C/84.9°F
--------Range: 28.7°C/83.7°F (1978) -- 30.3°C/86.5°F (1996 and 2004)
So a straight assumption that the current temperature at the buoy would rise 5.9°C between now and August 22 this year, just taking the average, would yield a prediction of 32.6°C/90.7°F on August 22 -- and 32.1°C/89.8°F on September 8. But a closer look shows that that's probably not the most accurate way.
======================================
For the 13 years out of the past 30 in which the April temperature was over 24.0°C (almost half the sample):
Average April ---> August rise: 5.3°C
--------Range: 4.0°C (1991) -- 7.2°C (2005)
Average April ---> September rise: 4.6°C
--------Range: 3.6°C (2002) -- 5.6°C (2005)
Average August temperature: 30.0°C/86.0°F
--------Range: 29.2°C/84.6°F (1981) -- 31.3°C/88.3°F (2005)
Average September temperature: 29.4°C/84.9°F
--------Range: 28.8°C/83.8°F (1982) -- 30.1°C/86.2°F (1995 and 2001)
======================================
For the 6 years out of the past 30 in which the April temperature was over 24.5°C:
Average April ---> August rise: 4.7°C
--------Range: 4.0°C (1991) -- 5.1°C (2000)
Average April ---> September rise: 4.2°C
--------Range: 3.6°C (2002) -- 4.9°C (2000)
Average August temperature: 29.8°C/85.6°F
--------Range: 29.3°C/84.7°F (1991) -- 31.3°C/88.3°F (2005)
Average September temperature: 29.3°C/84.9°F
--------Range: 28.8°C/83.8°F (1982) -- 30.3°C/86.5°F (2002)
Taking the lowest April-to-August increase we've seen in the last 30 years (4.0°C) and lowering that by 0.5°C would result in a theoretical minimum increase for 2006 of 3.5°C. Taking the highest April-to-August increase we've seen in the last 30 years (8.5°C) and raising that by 0.5°C would result in a theoretical maximum increase for 2006 of 9.0°C. So the water temperature will almost surely be between 30.2°C/86.3°F and 35.7°C/96.3°F. But the actual increase between now and August 22 will likely be between the actual 30-year minimum April-to-August increase (4.0°C) and the 30-year average April-to-August increase (5.9°C), and is more likely to be between the 30-year minimum April-to-August increase (4.0°C) and the average April-to-August increase seen in years where the April temperature was at least 24.0°C (4.6°C).
My prediction for the water temperature at Gulf buoy 42001 on August 22, 2006: 31.3°C/88.3°F, an increase of 4.6°C from today's temperature. Note that this is the same as the actual temperature one year ago. 2005 was an anomaly in that the temperature rose 7.2°C between April and August; none of the other 12 years where the April temperature was over 24.0°C saw an April-to-August temperature increase of more than 6.1°C.
I've gone a little further in breaking this down using some four-day averages (like someone suggested).
Here's the past 45 days, along with 1-day, 4-day, and 7-day moving averages. This doesn't have a lot of significance to what follows, but it's interesting to look at.
Here's the 30-year average of temperature at the buoy throughout the year. It reaches a maximum somewhere in late August, at an average of about 30°C/86°F.
In order to predict temperature changes, I looked at three 4-day time periods:
(1) The current one (April 18-22)
(2) The peak temperature period for that buoy (August 22-26)
(3) The climatological peak of hurricane season (September 8-12)
First, the 30-year averages:
Average April temperature: 24.0°C/75.2°F
--------Range: 22.0°C/71.6°F (1993) -- 26.7°C/80.1°F (2006)
Average April ---> August rise: 5.9°C
--------Range: 4.0°C (1991) -- 8.5°C (1988)
Average April ---> September rise: 5.4°C
--------Range: 3.6°C (2002) -- 7.6°C (1987 and 1992)
Average August temperature: 29.9°C/85.8°F
--------Range: 28.7°C/83.7°F (1986) -- 31.3°C/88.3°F (2005)
Average September temperature: 29.4°C/84.9°F
--------Range: 28.7°C/83.7°F (1978) -- 30.3°C/86.5°F (1996 and 2004)
So a straight assumption that the current temperature at the buoy would rise 5.9°C between now and August 22 this year, just taking the average, would yield a prediction of 32.6°C/90.7°F on August 22 -- and 32.1°C/89.8°F on September 8. But a closer look shows that that's probably not the most accurate way.
======================================
For the 13 years out of the past 30 in which the April temperature was over 24.0°C (almost half the sample):
Average April ---> August rise: 5.3°C
--------Range: 4.0°C (1991) -- 7.2°C (2005)
Average April ---> September rise: 4.6°C
--------Range: 3.6°C (2002) -- 5.6°C (2005)
Average August temperature: 30.0°C/86.0°F
--------Range: 29.2°C/84.6°F (1981) -- 31.3°C/88.3°F (2005)
Average September temperature: 29.4°C/84.9°F
--------Range: 28.8°C/83.8°F (1982) -- 30.1°C/86.2°F (1995 and 2001)
======================================
For the 6 years out of the past 30 in which the April temperature was over 24.5°C:
Average April ---> August rise: 4.7°C
--------Range: 4.0°C (1991) -- 5.1°C (2000)
Average April ---> September rise: 4.2°C
--------Range: 3.6°C (2002) -- 4.9°C (2000)
Average August temperature: 29.8°C/85.6°F
--------Range: 29.3°C/84.7°F (1991) -- 31.3°C/88.3°F (2005)
Average September temperature: 29.3°C/84.9°F
--------Range: 28.8°C/83.8°F (1982) -- 30.3°C/86.5°F (2002)
Taking the lowest April-to-August increase we've seen in the last 30 years (4.0°C) and lowering that by 0.5°C would result in a theoretical minimum increase for 2006 of 3.5°C. Taking the highest April-to-August increase we've seen in the last 30 years (8.5°C) and raising that by 0.5°C would result in a theoretical maximum increase for 2006 of 9.0°C. So the water temperature will almost surely be between 30.2°C/86.3°F and 35.7°C/96.3°F. But the actual increase between now and August 22 will likely be between the actual 30-year minimum April-to-August increase (4.0°C) and the 30-year average April-to-August increase (5.9°C), and is more likely to be between the 30-year minimum April-to-August increase (4.0°C) and the average April-to-August increase seen in years where the April temperature was at least 24.0°C (4.6°C).
My prediction for the water temperature at Gulf buoy 42001 on August 22, 2006: 31.3°C/88.3°F, an increase of 4.6°C from today's temperature. Note that this is the same as the actual temperature one year ago. 2005 was an anomaly in that the temperature rose 7.2°C between April and August; none of the other 12 years where the April temperature was over 24.0°C saw an April-to-August temperature increase of more than 6.1°C.
0 likes


The GOM certainly is much warmer than average without any fronts to cool it down:
http://www.osdpd.noaa.gov/PSB/EPS/SST/d ... 2.2006.gif
a front is coming though for the middle of the week i think.
the temp anomalies are not too dissimilar to 2001
http://www.osdpd.noaa.gov/PSB/EPS/SST/d ... 3.2001.gif
http://www.osdpd.noaa.gov/PSB/EPS/SST/d ... 2.2006.gif
a front is coming though for the middle of the week i think.
the temp anomalies are not too dissimilar to 2001
http://www.osdpd.noaa.gov/PSB/EPS/SST/d ... 3.2001.gif
0 likes
-
feederband

- S2K Supporter
- Posts: 3423
- Joined: Wed Oct 01, 2003 6:21 pm
- Location: Lakeland Fl


Good Job MTM!! I see you're in Mobile. I was born there.
The other thing that one should look at is El Nino vs. Neutral vs. La Nina.
Table 1. Consensus List of El Niño and La Niña Years
Winter WRCC CDC CPC MEI Consensus
1973-74 C+ C C+ C+ Strong La Niña
1974-75 C C- C- Weak La Niña
1975-76 C+ C C+ C Strong La Niña
1976-77 W W-
1977-78 W+ W- W- El Niño
1978-79
1979-80 W- W-
1980-81
1981-82
1982-83 W+ W W+ W+ Strong El Niño
1983-84 C-
1984-85 C- C-
1985-86
1986-87 W W
1987-88 W+ W- W W- El Niño
1988-89 C+ C- C+ C Strong La Niña
1989-90
1990-91 W+
1991-92 W W W+ W+ Strong El Niño
1992-93 W W+ W- El Niño
1993-94 W+ W
1994-95 W+ W W- El Niño
1995-96 C- C-
1996-97
1997-98 W+ W W+ W+ Strong El Niño
1998-99 C+ C C- La Niña
1999-00 C C
2000-01 C C C- C- La Niña
2001-02
2002-03 W W W W El Niño
2003-04
2004-05 C C C C- La Niña
>24C Data:
What I find interesting is that the two years with the most increase were la Nina Years: 2005 and 2000.
What I also find interesting is that the two years with the least increase were El Nino Years: 1991 and 2002.
All three of the warmest temps were on the La Nina Side...
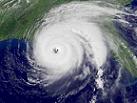
Other thing, is it possible for you to plot the 4-day average of the 2006 season on the 30-year graph to see the relationship. That would be great!!!
The other thing that one should look at is El Nino vs. Neutral vs. La Nina.
Table 1. Consensus List of El Niño and La Niña Years
Winter WRCC CDC CPC MEI Consensus
1973-74 C+ C C+ C+ Strong La Niña
1974-75 C C- C- Weak La Niña
1975-76 C+ C C+ C Strong La Niña
1976-77 W W-
1977-78 W+ W- W- El Niño
1978-79
1979-80 W- W-
1980-81
1981-82
1982-83 W+ W W+ W+ Strong El Niño
1983-84 C-
1984-85 C- C-
1985-86
1986-87 W W
1987-88 W+ W- W W- El Niño
1988-89 C+ C- C+ C Strong La Niña
1989-90
1990-91 W+
1991-92 W W W+ W+ Strong El Niño
1992-93 W W+ W- El Niño
1993-94 W+ W
1994-95 W+ W W- El Niño
1995-96 C- C-
1996-97
1997-98 W+ W W+ W+ Strong El Niño
1998-99 C+ C C- La Niña
1999-00 C C
2000-01 C C C- C- La Niña
2001-02
2002-03 W W W W El Niño
2003-04
2004-05 C C C C- La Niña
>24C Data:
What I find interesting is that the two years with the most increase were la Nina Years: 2005 and 2000.
What I also find interesting is that the two years with the least increase were El Nino Years: 1991 and 2002.
Average August temperature: 29.9°C/85.8°F
--------Range: 28.7°C/83.7°F (1986) -- 31.3°C/88.3°F (2005)
Average September temperature: 29.4°C/84.9°F
--------Range: 28.7°C/83.7°F (1978) -- 30.3°C/86.5°F (1996 and 2004)
All three of the warmest temps were on the La Nina Side...
Other thing, is it possible for you to plot the 4-day average of the 2006 season on the 30-year graph to see the relationship. That would be great!!!
0 likes
Who is online
Users browsing this forum: No registered users and 158 guests